Haute école de gestion de Genève CRAG - Centre de Recherche Appliquée en Gestion Cahier de recherche
© CRAG – Haute Ecole de Gestion de Genève
Age of tracking and the smoothness of upper
secondary school transitions
Joelle LATINA & José V. RAMIREZ
Cahier : : N° HES-SO/HEG-GE/C--13/4/1--CH
© CRAG – Haute Ecole de Gestion de Genève 2
Age of tracking and the smoothness of upper secondary school
transitions
Joelle LATINA et José V. RAMIREZ
Cahier de recherche
Décembre 2013
Résumé
Dans cet article, nous examinons si le report d'un an du regroupement en secondaire inférieur influe sur la probabilité de changement de filière au secondaire supérieur. Nous exploitons une expérience naturelle dans le canton de Genève où trois collèges (de secondaire inférieur) regroupaient leurs élèves un an plus tard que la majorité des collèges du canton. La sélection dans le traitement étant indépendante de la variable expliquée, l'effet de traitement peut être estimé. Quels que soit le modèle écométrique utilisé, le report d’une année du regroupement a, ceteris paribus, un effet négatif (et
significatif) sur la probabilité de rupture de la transition en secondaire supérieur. Cependant, nous trouvons que cet effet négatif diminue significativement avec le niveau de performance scolaire de l’élève au secondaire inférieur. Nous expliquons notre résultat comme un sous-produit de l'effet " big-fish-little-pond".
Mots-clés
effet “big-fish-little-pond”, qualité éducationnelle relative, transitions scolaires, regroupement
Summary
In this article, we examine if a one-year delay in middle school tracking influences the probability of track changes at the upper secondary level. We take advantage of a natural experiment in Geneva (Switzerland), whereby a group of middle schools tracked their students a year later than the majority of schools. Because of specific conditions, we argue that selection into treatment is independent of the potential outcome and, therefore, use a regression design to identify the average treatment effect. Both linear probability and panel data models estimate a small but significant negative impact of delayed middle-school tracking on the smoothness of upper secondary school transitions. However, we find this negative effect of a later tracking to decrease with the level of performance. We explain our result as a by-product of the “big-fish-little-pond” effect.
Keywords
Age of tracking and the smoothness of upper secondary
school transitions
Joelle Latinaa,b,∗, Jos´e V. Ramireza,b
aHaute Ecole de Gestion, 7 Route de Drize 1227 Carouge, Switzerland
bLeading House on the Economics of Education, University of Geneva, Switzerland
Abstract
In this article, we examine if a one-year delay in middle school tracking influences the probability of track changes at the upper secondary level. We take advantage of a natural experiment in Geneva (Switzerland), whereby a group of middle schools tracked their students a year later than the majority of schools. Because of specific conditions, we argue that selection into treat-ment is independent of the potential outcome and, therefore, use a regression design to identify the average treatment effect. Both linear probability and panel data models estimate a small but significant negative impact of delayed middle-school tracking on the smoothness of upper secondary school transi-tions. However, we find this negative effect of a later tracking to decrease with the level of performance. We explain our result as a by-product of the “big-fish-little-pond” effect.
Keywords: big-fish-little pond effect, relative educational quality, school transitions, tracking
JEL: I20, I21, I28
1. Introduction
Tracking is a common feature of many countries’ school systems, though the intensity and the age of tracking vary greatly. From ability streaming in US high schools to German early school tracking, a wide range of
institu-∗Corresponding author. Tel.: +4122 388 1870 Fax: +4122 388 1701
Email addresses: [email protected] (Joelle Latina),
tional features exist and a natural question arises as to how exactly tracking impacts students, with regards to their educational choices, achievements or interaction with their peers. A closely related question is to examine how placement into a particular track is influenced by other factors than students achievement, such as family background or parental education and how they further interact with tracking. This paper is well in line with the former strand of literature, and deals specifically with the impact of the age of middle-school tracking on the smoothness of post-compulsory school tran-sitions. We examine, in particular, how delayed tracking might impact the probability of track changes during upper secondary studies.
There are two main reasons why one should look at the smoothness of upper secondary transitions. First, the OECD report Education at a glance (OECD, 2012) highlights that, over the 25 countries for which they have data, on average, 70% of students complete the (upper secondary) program they entered “on time”, i.e., within the theoretical duration of the program. This rate rises to 85% when adding two years to the theoretical duration, to take into account grade repetition and changes of programs. Both numbers point out that track changes at this stage are common and worth examining. With regards to Switzerland, even if almost 90% of a given cohort ends up with a secondary degree, the length and the age at graduation have increased sharply over the last decade (SRED, 2011; Swiss Federal Statistical Office, 2011). This means, in particular, that larger public resources have to be invested in the upper secondary school system, as more students tend to stay at this stage for longer periods of time. It goes without saying that, in addition to the public cost, individuals also support a private cost in foregone
earnings associated with longer years spent studying, and this is especially true if those additional years do not have any positive impact on future school transitions and labor market outcomes. Therefore, smoother upper secondary transitions appear economically desirable, both from a public and private perspective.
The second argument is of a different nature and relates to the consis-tency of our modeling strategy. As noted in many empirical studies (see, for example, Betts, 2011), examining the impact of tracking on students per-formances is an empirically difficult question, because disentangling the two phenomena is hard (reverse causality issues). Another strategy is to tackle the impact of tracking trough another educational output and use as depen-dent variables less co-varying indicators, such as tertiary degree completion (e.g., Malamud and Pop-Eleches, 2011) or, as in our case, the smoothness of upper secondary school transitions.
The impact of the age of tracking has received substantial attention re-cently and, generally speaking, results suggest that a later tracking is ben-eficial to least-favored students. Most studies look at the impact of the age of tracking on test scores and the most comprehensive analysis in this field has been done by Hanushek and Woessman (2006). They construct a relatively large sample of 18 to 26 countries that allows them to use a difference-in-difference approach. Their results indicate that early tracking increases educational inequality and tends to reduce mean performance. In addition, numerous case studies have tried to identify the impact of tracking using natural experiments. For Sweden, Meghir and Palme (2005) exploited a major educational reform from the late 1940’ that, among others,
post-poned tracking from age 12 to 13. One of their main result is that “the reform led to an increase in schooling beyond the new compulsory level for individuals with higher ability and unskilled fathers” (p. 422). Muehlenweg (2007) finds that, in Germany, postponing tracking by two years (from 10 to 12) has no negative effect on test score mean, while positive effects are found for pupils with less favorable family backgrounds. A recent study by Piopiunik (2013) examined the impact of a policy reform that anticipated tracking by two years (from age 10 to 8) on students performance, in Bavaria (Germany). Using PISA data along with double and triple difference es-timations, the author finds that early tracking reduces the performance of 15-year-old students. Koerselman (2013) brings to our attention incentive effects that may arise in tracked systems, leading forward-looking students to anticipate track allocation in increasing their effort, a mechanism empir-ically supported by his UK data and a credible explanation as to why we observe a widening early test score gap (grades 3 and 4) between early and late tracking countries.
Other studies look at the impact of the age of tracking on different educa-tional outcomes. For Romania, Malamud and Pop-Eleches (2011) highlight that a later secondary school tracking (from 8 to 10 years of general school-ing) increased the number of disadvantaged students applying for University but had no effect upon degree completion, because the number of available University slots had stayed the same. In a context relatively similar to ours, van Elk et al. (2011) study the impact of a delayed tracking (from 12 to 13 or even 14 years old) on higher education completion, using Dutch data. Both their OLS and IV estimates suggest that delayed tracking is beneficial to
students at the margin of engaging in higher education, as it increases their probability of completing a degree by 5 percent. No detrimental effect is found on high achieving pupils. Finally, for Switzerland, Bauer and Riphahn (2006) use a difference-in-difference estimation on a cross-sectional census dataset and they find that early tracking is relatively beneficial to students with highly educated parents, as it increases their educational mobility.
Our case study, Geneva, a dense urban Swiss Canton, has witnessed the coexistence of two different (within) middle-school tracking systems during an extended period of time (1971-2011), with a system tracking students a year earlier than the other one. This natural experiment is long enough to be valued as a valid example of treatment measure (Betts, 2011). While the literature points out that early tracking tends to increase school perfor-mance inequality, our results suggest that delaying tracking can reduce the smoothness of subsequent school transitions and particularly so for low abil-ity students. We propose this result to be caused by low achieving students’ higher probability to make improper educational decisions regarding upper secondary schooling when tracked a year later.
The remainder of this paper is structured as follows: the next section ex-poses our identification strategy while describing the lower-secondary school system and the third one details our empirical framework. Section 4 presents the results we discuss in section 5. The last section concludes.
2. Variation in the timing of tracking
During the period covered by our data, 1993–2007, two different tracking systems prevailed in the Canton of Geneva. While the majority of middle
schools tracked their students from the beginning, i.e., at the age of twelve, a group of three middle schools (representing around 16% of all students) only started tracking students at the age of thirteen, i.e., a year later. Although we will simply use the term “tracking” in this paper, what we are referring to is within-school “streaming”, as students are allocated to different tracks within a common school structure (Brunello and Checchi, 2007).
The coexistence of two-tier tracking system finds its origin at the be-ginning of the 1970’ (1971–1972); Bain et al. (2000) explain that, at this time, the local government decided to run a pilot project and selected three middle schools as a treatment group. The idea was to delay the standard age of tracking by one year and thereby to introduce more heterogeneity among middle school students. After a successful trial period and favorable expert recommendations, the project could, however, not be generalized to the whole canton. The reform was supposed to be extended to all middle schools in September 1980, but in May, the government suddenly changed gears and completely backed up. The three treated establishments were, nev-ertheless, enthusiastic about the new delayed tracking system and, thanks to the relative autonomy granted to middle schools in the Canton, were allowed to keep it. This systemic difference subsisted until very recently (2011), when only a supra-Cantonal curriculum harmonization was a strong enough factor of change.
It is important to note that the treated middle schools had not much in common, except for their delayed tracking system: different directors and school policies, different locations across the canton and, therefore, different compositions of their student populations. Indeed, in Geneva, students are
allocated to a middle school on the sole basis of their home address and rules are strict: it is not possible for parents to request a particular middle school for their children. In addition, the local housing market is extremely tight, as the vacancy rate is one of the lowest in Switzerland, with a local average vacancy rate of 0.8% over the period and annual values consistently below this threshold since 2000 (Cantonal Office of Statistics, 2011); thus rendering strategic moves highly unlikely and, in all cases, very costly, as new leases imply substantial rent increases. The combination of those factors makes the cost of self-selection very high. On the other side, the benefit from any self-selection is likely to be very small, since the public system is generally perceived as equivalent (and more importantly, equivalently good) across all middle schools1. Finally, the allocation of primary students to a specific middle school may vary from one year to another, making middle school targeting trough neighborhood selection only approximate.
The crucial point we make here, is that selection into treatment is only dependent on the home address and though, arguably, there exist compo-sitional differences related to the population of a particular neighborhood, they will be accounted for by the model. Most importantly, assignment to treatment is independent of potential outcomes, since students do not self-select themselves into a particular tracking system based on their chances
1Teachers mobility between the different schools (both within and between the two
tracking systems) is very low and greatly due to the dynamic of retirement vacancies. Moreover, teachers salary is set at Cantonal level and there aren’t any wage incentives, regarding, for example, students performance, at the class and/or at the school level. Fur-thermore, comprehensive school rankings do not exist (including for managerial purposes) and the only information available to practitioners is a yearly school ranking solely based on standardized test scores at the Cantonal level.
of accomplishing smooth upper secondary studies. Therefore, the (average treatment) effect of the age of tracking on the smoothness of upper secondary transitions can be reasonably well identified through a dummy variable.
3. Empirical framework 3.1. Data
The database used in this paper is the Geneva Schooling Database (GSD), compiled and yearly updated by the cantonal schooling administration. The GSD records every child who goes to public and private schools in Geneva, from primary to upper secondary level. We could access data from 1993 up to 2007, i.e., data for twelve cohorts of public students. For two cohorts, the latest ones (i.e., in their first year of upper secondary education in 2003 and 2004, respectively), we also possess information on students’ grades. In addition, for our empirical strategy to be consistent, we only run the analysis on students who stayed in the same tracking system during all their middle school years2.
3.2. Variables
As previously mentioned, the idea here is to examine the smoothness of upper secondary school transitions, and by this, we mean looking at track changes during the first three years of upper secondary schooling3. Specifically, all possible upper secondary choices are grouped into six main
2Thus, about 16% of all observations were dropped.
3While our data would have allowed us to consider four, we only took three years of
post-compulsory education into account, because labor-market exiting may arise after the completion of an apprenticeship training (which is possible in three years) and our data do not allow us to identify those cases.
tracks reflecting the diversity of the Swiss upper secondary school system: college-bound high school (the academic track), general school (that delivers lower-level general knowledge), full time vocational education (professional schools), dual vocational education and training (i.e., the apprenticeship sys-tem, whereby apprentices divide their time between a professional school and on-the-job training), remedial education (this covers all preparatory years to various schools and special structures, designed for students that do not meet other track requirements) and dropouts4. A change of track is then simply defined as a switch between tracks over a period of any two consecutive years5. This definition implies that we keep a neutral standpoint, as we take any track change into account, whether going upward or downward. Once again, our standpoint is that any track change means additional costs, both at the private and public level6.
Table 1 presents the distribution of transition options in the sample by first, second and third transition, and by age of tracking. Additionally, p-values resulting from corresponding t tests across sub-sample means are re-ported, so as to check whether transition patterns differ between students tracked at 12 and 13. While there appear to be differences in the general pattern of the first transition between the two types of students, these
differ-4A thorough explanation of the Swiss school system can be found in a report by the
Swiss Coordination Center for Research in Education (SKBF, 2011)
5Including remedial education and dropouts as track “choices” imply that students
transitioning to either of those tracks will automatically get credited with a change of track subsequently. However, when examining the smoothness of transitions, one needs to take those cases into account since they always increase the number of years before getting any diploma and are part of the educational system.
6This view is somehow comparable with frictional search costs that can occur on the
labor market: both the worker (student) and the firm (public sector) would be better off if a match could be found instantly.
ences seem to fade over time, except for transitions to apprenticeship training that attracts greater percentages of students tracked at 12 at each point in time.
Insert Table 1 about here
As we take into account the first three years of upper secondary school-ing, the maximum number of observed track changes for a given individual is two (between the first and second year, and/or between the second and the third one). Table 2 presents basic summary statistics for our dependent vari-able and it highlights that, for our sample of around 39’000 individuals, track changes occur both across individuals (between variation) and over time for a given individual (within variation). Table 3 illustrates that track changes are more frequent between the first and second year of post-compulsory school, suggesting that, on average, re-orientations tend to intervene at earlier stages. Moreover, table 3 highlights that, unconditionally, track changes are signifi-cantly more frequent among delayed tracking students.
Insert Table 2 about here Insert Table 3 about here
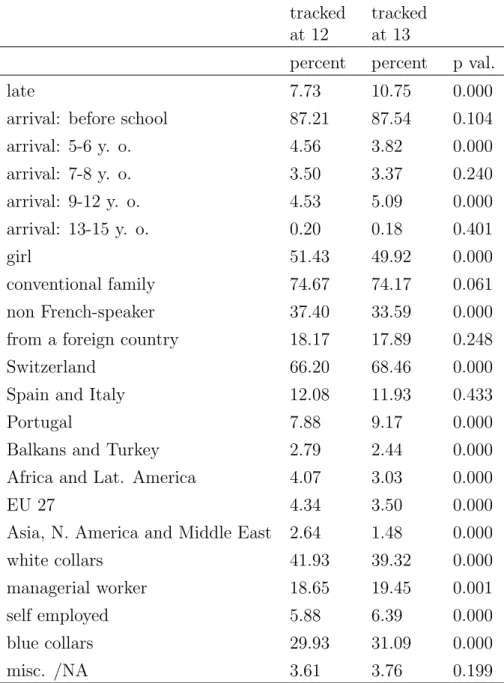
The idea behind our choice of independent variables, aside, of course, from our dummy of interest reflecting the age of tracking, is to control for as many individual characteristics as possible, to minimize a possible omitted variable bias. As a set of controls we have: an indicator of middle school performances based on middle school grade retention, gender, socioeconomic status, nationality group, a dummy indicating whether or not the country of provenance is different from Switzerland, language spoken at home, age at arrival inside the school system and family structure. Time dummies are
also added to control for year-specific factors. A complete description of all the independent variables can be found in table 4 and a table of summary statistics, by age of tracking, is available in appendix table A.1. The third column of table A.1 reports p-values resulting from corresponding t tests across sub-sample means. Even though most of the means appear signifi-cantly different between the sub-samples, it is still worth noticing that (raw) proportions of all variables remain in a very comparable range across both tracking systems. Finally, we will also use middle school level proportions of all independent variables to further strengthen our results.
Insert Table 4 about here 3.3. Modeling
As we assume independence between treatment and outcome, our esti-mation strategy is to compare estiesti-mations performed using panel data mod-eling (that allows to correct for both heteroskedasticity and auto-correlation in the error term), and linear probability models, that permit to estimate the average treatment effect (e.g., Blundell and Costa Dias 2000; Imbens and Wooldridge 2009; Angrist and Pishke, 2009). Comparable results across estimations would support the robustness of our findings.
For the simple OLS case, we estimate the following equation:
yit = x0itβ + γTi+ εit (1)
where yit denotes the probability to change track for individual i at time
t, xitis a vector of individual controls as described in the previous subsection
Concerning panel data modeling, as in our case all independent variables (individual characteristics) are non-time varying, we use a population-average model, which, in the case of a dichotomous dependent variable, allows an estimation of marginal effects. Specifically, we use a population average logit model, defining the probability to change track for an individual i at time t as:
P r(yit = 1 | xit, β, αi) = Λ(αi+ γTi+ x0itβ) (2)
with αi = α and Λ(.), the logistic conditional distribution function, where
Λ(z) = (1+eezz) (Cameron and Trivedi, 2005).
4. Results
4.1. Baseline results
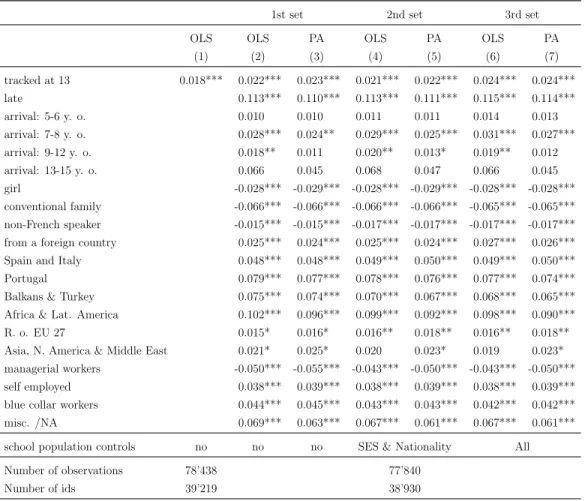
We first report estimation results of our baseline set of specifications in table 5. Depending on the variables we add to the model, we classify specifications into a first, a second and a third set but all sets present results obtained using a population average (PA) logit model 7 and a simple linear
probability model. The first set only controls for individual characteristics, as discussed in section 3.2; the second set, however, also includes nationality and socioeconomic status groups but considered at the school level, which enables us to explicitly takes into account any compositional effect due to differences in middle school populations. Furthermore, adding school level
7The correlation term is only constrained to be the same across individuals for the
controls allows us to estimate the impact of delayed middle school tracking more precisely, since the model accounts for school-specific factors. Finally, for the sake of completeness the last two columns of table 5 present the third set of specifications where the time-variying school level proportions of all independent variables are added to the model.
Insert Table 5 about here
Results are remarkably similar across specifications, and our dummy of interest reflecting the age of tracking, appears very significant and positive, indicating that, ceteris paribus, a later middle school tracking tends to in-crease the probability of track changes during upper secondary studies by 2%8. As previously mentioned, when there is no self-selection issue, OLS
allows to estimate the average treatment effect.
As discussed in section 2 and as supported by the stability of our find-ings so far, we believe that our empirical framework allows us to identify the effect of delayed tracking. Nevertheless, a further support to this state-ment is provided by the results obtained through a two-stage estimation strategy: in a first stage we estimate propensity scores using (time-varying) school level proportions of nationality groups and socioeconomic categories as determinants of the probability to get treated. That is, we try to proxy housing choices, i.e., neighborhood selection, using the socioeconomic and ethnic composition of the area, as reflected by the middle school attached to it. In a second stage, propensity scores are used as sample weights to
re-8As mentioned previously, results are robust to the exclusion from the sample of
stu-dents transitioning to either remedial education or dropping out as first transition option. The delayed tracking dummy appears significant at 1% and of a very comparable magni-tude. Complete results are available upon request.
estimate our baseline model with a complete set of individual characteristics (Freedman and Berk, 2008; Caliendo and Kopeinig, 2008; Imbens, 2004). In both OLS and PA regressions, our dummy of interest appears significant at 1% and of a very comparable magnitude (0.034 and 0.035 respectively)9. 4.2. Further results
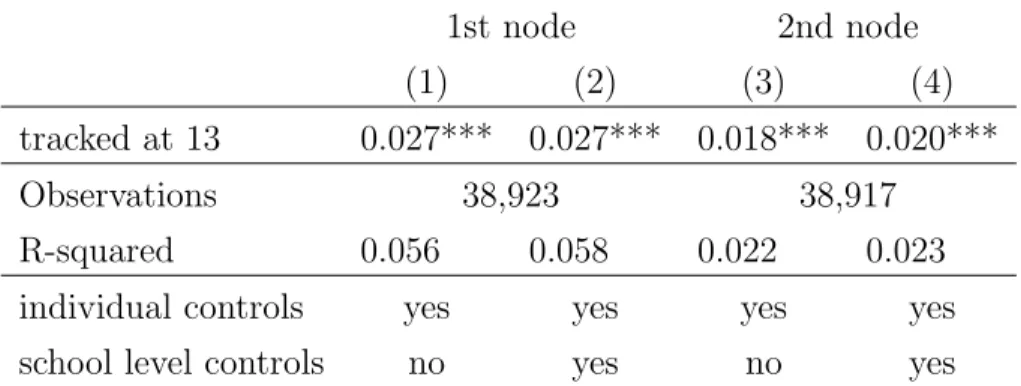
To further verify the robustness of our results, we investigate if our main result holds under alternative specifications and on different sub-samples. We first investigate if the impact of delayed tracking is different across transition nodes, i.e., we check if the total effect is not, in fact, driven by a large effect at the first node and no further effect at the second one. OLS estimations by transition nodes are presented in table 6. Our dummy of interest stays significant at both nodes and decreases slightly in magnitude, suggesting that the effect of delayed tracking fades but still persists over time.
Insert Table 6 about here
Second, one potential drawback of our modeling strategy is that our es-timates may, in fact, still suffer from an omitted variable bias. Specifically, if, say, the educational quality of children sent to the three treated middle schools were to differ significantly in comparison to all other middleschool-ers, and if educational quality were actually correlated with the probability of track changes at the upper secondary level, then, when only partially con-trolling for school performance (i.e., educational quality), our estimates could be biased. In this case, even signing the bias would be hazardous. There-fore, we try to overcome this limitation by using a twofold strategy: first, we 9Complete results of those estimations are not reported but are available upon request.
will perform estimations dividing students according to their first transition choice, and second, we will use information on middle school grades, that, as previously mentioned, we only possess for two cohorts.
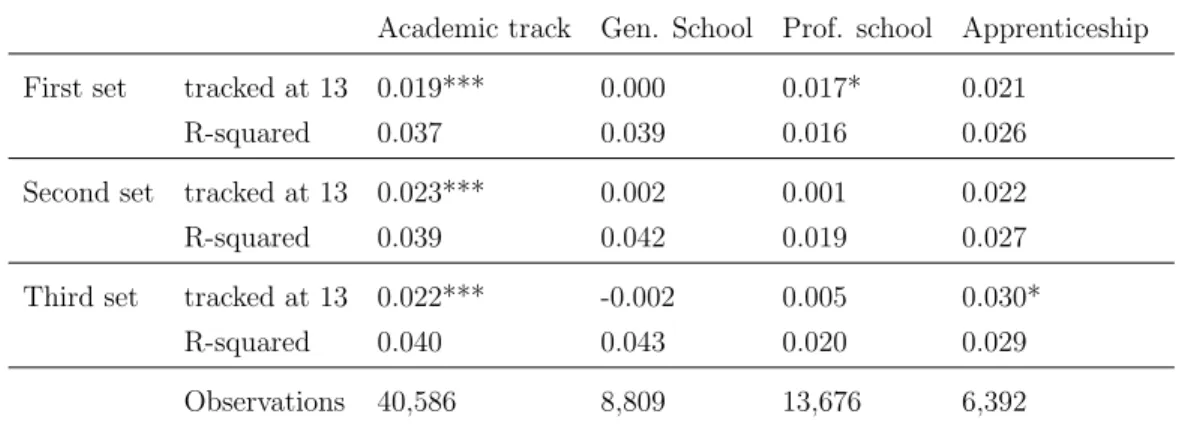
Our first goal is to perform estimations on sub-samples of more homoge-neous students, defining our sub-samples using ex-post information on stu-dents first transition choice, thereby creating six groups. The idea behind this splitting is that all students attending a particular upper secondary track have to meet track-specific grade requirements upon admission. This guar-antees that, for example, all students attending the academic track during their first year of upper secondary schooling had to meet an admission re-quirement of a cumulative grade point average of 4.5 out of 610. This second
round of results is presented in appendix table A.2, and estimates suggest that only students choosing the academic track are more at risk of changing tracks subsequently. Moreover, results are robust to the inclusion of school level controls in the model: the delayed tracking dummy stays at a magni-tude of 2% (significant at 1%) for smagni-tudents choosing the academic track and a 3% effect appears on students choosing apprenticeship, but the latter is only significant at 10%. However, at this point, we would like to empha-size two elements: first, we are performing our estimations on the complete population of students and consequently, there should be, in principle, no sampling errors. Therefore, all point estimates are worth looking at, and the relatively narrow range of coefficient magnitudes for our dummy of interest is
10The only meaningful exception to this rule is apprenticeship training (the second
being dropouts), that only requires a match between a student and a firm willing to hire an apprentice; firms are absolutely free to chose whomever they see fit.
a reassuring sign. Second, a legitimate question is to ask if the two groups of middle schools exhibit different patterns in sending students to the six upper secondary tracks.
As reported in table 1, on average over the whole period, the two groups of schools did not differ much in the percentages of students transitioning to the academic track in their first transition. This is particularly interesting for our purpose, because this suggests that our result is unlikely to be driven by other omitted factors, such as, for example, a better job performed by a particular group of middle schools in sending more often students to the most socially valued (academic) track.
Our second approach to control for educational quality is to use informa-tion on grades obtained during the last year of middle school for the 2003 and 2004 cohorts (i.e., students in the last grade of middle school in 2003 and 2004, respectively). The idea here is that, by using grades, we are able to control for the educational quality of students more precisely than just dividing the sample using their first transition choice. A debatable question, is, however, which indicator of educational quality to use, so as to reflect the true educational quality. Attempting to answer this question with the data at hand, is clearly not the object of this paper, so we will keep a neutral stand-point in presenting results for two indicators: the cumulative grade stand-point average (GPA)11 and the standardized test scores in mathematics. For both
performance indicators we use two different empirical specifications. In the first one, we divide the population of students by quartile, and re-estimate
11Defined as the average of the math, German and French annual GPAs, which are the
separately the same model for each quartile, including in all four regressions the complete set of individual controls. In the second specification, we only run one regression on the complete sample but add dummies for each quar-tile, as well as an interaction term between the delayed tracking dummy and quartile dummies. Results of the first specification by quartile are presented in table 7, where only the estimated values of our dummy of interest are reported.
Insert Table 7 about here
Two striking results appear: first, whichever indicator of educational quality is used, the probability to change track of the highest performing students is never negatively affected by the age of middle school tracking: both performance indicators suggest that a later tracking is actually bene-ficial for high achievers, in reducing their subsequent probability to change track but only significantly when considering standardized math scores. Sec-ond, the lower end of the ability distribution seems consistently negatively affected by the age of tracking: the dummy denoting delayed tracking ap-pears positive and significant for the first quartile in both models. Results concerning the middle range of the ability distribution are less clear cut, as signs vary across performance indicators; although the strong significance of coefficients related to GPA partitioning tends to point toward a negative ef-fect on those students as well. When looking at the magnitude of the point estimates, effects on the first quartile suggest an increase in the probability to change track from 5 to 12%12, while the negative impact of delayed
track-12Tests on the equality of coefficients across GPA quartiles (using the first quartile as
ing decreases when moving up in the performance distribution. These results all point out that the group “at risk”, i.e., the most negatively affected by a delayed tracking, comprises, perhaps unsurprisingly, students on the lower end of the achievement distribution.
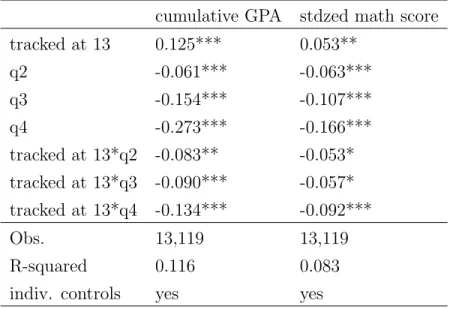
Table 8 presents results of the second specification, where the regression is now run on the complete two cohort sample. Results appear very similar to our previous specifications. When tracked at 12, the probability to change track at the upper secondary level decreases significantly along each quar-tile of the GPA distribution. Furthermore, this probability decreases as the level of performance increases, irrespectively of the tracking system and the performance indicator. However, when looking only at the cumulative GPA, distributional effects are larger for students tracked at 13, as indicated by the higher magnitude of the estimated interaction effects.
Insert Table 8 about here
As a final check, we combine both approaches and use the first transition choice as well as grades to create different sub-samples of both cohorts. In this case, we first split students by their initial transition choice and then divide them according to their position relative to the median score of their upper secondary track: either above or below. We then re-estimate the model for each sub-group, and the results of those twelve estimations are presented in appendix table A.3. This final set of results confirms, once again, that only low-performing students are negatively affected by a later tracking13.
math scores, effects on the second and third quartiles are significantly different from the first one at 10% and the fourth one is significantly different at 1%.
13We also performed this estimation further dividing the sample by transition node,
In addition, a new result emerging is that delayed tracking also impacts the first half of the distribution of students (i.e., below the median) choosing pro-fessional schools, though the significance level is at 5%. Propro-fessional schools are, on average, the second most-demanding upper secondary track (after the academic track) and, for this reason, finding a significant effect is not surprising.
5. Discussion
After examining the robustness of our empirical findings, what remains to do is to make actual sense of them. Our main result suggests that delaying middle-school tracking by a year does not help students accomplish smooth upper secondary school transitions. The exact channel through which delayed tracking affects school transitions is, however, unobservable. Nevertheless, we think that the theory of social contrast can shed some light on this process. The theory of social contrast states that humans tend to assess their in-dividual characteristics relatively to the set of characteristics possessed by others surrounding them, whether it relates to their physical attractiveness (e.g. Wade and Abetz, 1997) or to their educational quality, as showed by the seminal work of Davis (1966). Since his contribution, in the context of education, the social contrast mechanism is usually called the “big-fish-little-pond” effect, whereby “students compare their own academic achievements
performance groups). Results are robust and significant effects are found on both transition nodes for the group below the median going to the academic track (effects of 0.05 for the first node and of 0.02 for the second; significant at 1% and 10% respectively). Other effects are observed on the first transition node of students below the median transitioning to professional schools (0.07, significant at 5 percent), as well as on the first node of low achieving students transitioning to an apprenticeship (0.12 significant at 5 percent).
with the academic achievement of their peers and use this social compari-son impression as one basis for forming their academic self-concept” (p.366, Marsh and Hau, 2003). Marsh and Hau (2003) provided solid evidence that this effect is valid across a wide sample of countries and can therefore, be reasonably well considered as an established empirical fact.
Taking this idea one step further, Jonsson and Mood (2008) examined the impact of peers achievement on educational choice formation and, among others, they found that: “The tendency to make a high-aspiring choice at upper secondary school is less for those who go to school with high-achieving peers” (p.759). When looking at the negative effect of delayed tracking on students transitioning to the academic track, this statement makes particular sense. Given that the academic track is the most demanding upper secondary track, our result would thus be consistent with an overall higher degree of scholarly ambition among delayed tracking students, affecting particularly low achievers, who are, ceteris paribus, more re-orientation prone.
A third possible explanation can be found in the status characteristics theory, as developed in and supported by Correll (2004), whereby individuals self-assess their own competence while constrained by cultural or societal beliefs, resulting in double standards of assessment. Correll cites the example of the common belief that men are better at math. Due to this, at equal performance levels (e.g., equal test score results), men will use a more lenient standard than women when assessing their own task competence, leading ”men to overestimate and women to underestimate their actual task ability” (p.98). Individuals then form aspirations based on their perceived abilities, implying that those with higher perceived task abilities will further aspire
to activities involving this particular competence, e.g, men will engage more often in advanced math classes or choose math-oriented college majors. In our specific context, it is likely that the assignment of students to tracks creates a (systemic) belief concerning their expected school performances, impacting their self-assessment of academic abilities. Given that the negative impact of delayed tracking is the strongest on low achievers, it is consistent with a detrimental impact of a low track allocation on students perceived abilities and subsequent academic aspirations. In other words, as in the men-women example, low achieving students exposed to three years of tracking, i.e., highly exposed to a negative systemic belief, tend to underestimate their own scholastic ability while students only tracked for two years, i.e., less exposed to the belief, tend to overestimate it. At equal performance level, theses differences in performance assessment lead to diverging educational aspirations, the latter being more academically eager than the former.
Finally, our results would also provide a certain justification for some sort of tracking; while the boutique model of peer interactions justifies tracking through its positive effects on students performances (as empirically sup-ported by Hoxby and Weingarth, 2005), we find support for within-school tracking through its impact on educational choices. Heterogeneous peers somehow seem to provide a blurry point of reference for low achieving stu-dents, which, apparently, lead them to make improper educational decisions. Those unsuccessful matches are subsequently broken and a generally better suitable alternative is found, as expressed by the higher rate of track changes after the first year of upper secondary studies, compared to changes at a later stage.
6. Conclusion
In this paper, we took advantage of a natural experiment to identify the impact of a one-year delay in middle-school tracking on the probability to change track at the upper secondary level. Our main result suggests that students tracked at a later stage are more likely to change track during upper secondary studies. After controlling for a wide range of individual factors, the age of tracking still appears to increase significantly the probability of track changes at the upper secondary level, though quantitative impact is small.
When splitting students by performance level, results suggest that stu-dents on the lowest end of the ability distribution might well be affected significantly more, with estimates ranging from 5 to 12%, depending on the performance indicator used. In addition, we find that quartile differentials are larger for students tracked at 13 than students tracked at 12, suggest-ing that the inequality in terms of track change probability (at the upper secondary level) is higher in the delayed tracking system. More precisely, when looking at results obtained using the cumulative GPA as performance indicator, the track change probability difference between the lowest and the highest quartile of the GPA distribution is around 27 percentage points when students are tracked at 12 but rises to more than 50 percentage points when students are tracked a year later.
While in a comprehensive system, low achieving students might benefit from their high achieving peers, thereby increasing their level of performance, in this paper, we find a negative impact of high performing students on their lower achieving counterparts, because the former lead the latter to make
improper educational decisions. Said differently, low achievers tracked at 13 are more likely to change track subsequently. Although the classical human capital theory assumes that individuals make rational choices and choose a specific level of educational attainment using a cost-benefit analysis, it clearly appears that teenagers do not make purely rational choices. It is well known that peer groups influence social outcomes, such as drinking or political attitudes (Sacerdote, 2011); therefore, finding that they influence educational aspirations as well does not appear far-fetched.
Acknowledgement
Both authors would like to thank the Canton of Geneva, the Cantonal Department of Public Education (DIP) and its Research Department in Ed-ucation (SRED) for providing the data. We are grateful to Jennifer Hunt, Martin Carnoy, Eric Verdier, Philippe M´ehaut, Ulrich Blum, Jacques Amos, and Fran¸cois Rastoldo for their useful comments and suggestions. Funding was provided by the Federal Office for Professional Education and Technol-ogy. Any remaining error is ours.
Table 1: First, second and third transitions by age of tracking
1st transition 2nd transition 3rd transition
Age of tracking 12 13 12 13 12 13
percent percent p-val percent percent p-val percent percent p-val Academic track 51.88 53.28 0.038 45.91 46.47 0.403 41.36 41.59 0.728 General School 11.61 10.08 0.000 10.97 11.16 0.653 10.68 10.71 0.936 Professional schools 17.52 17.74 0.676 19.39 20.34 0.079 17.37 18.33 0.067 Apprenticeship 8.54 6.50 0.000 16.02 13.70 0.000 19.10 16.86 0.000 Remedial 7.91 9.85 0.000 0.38 0.52 0.146 0.11 0.11 0.880 Drop out 2.54 2.54 0.973 7.33 7.80 0.195 11.38 12.41 0.020
Data source: Geneva Schooling Database for 12 cohorts of students (1993-2007).
Notes: p-values report results from t tests on the equality of means. A hundred percent is 39,219 for each of the transitions.
Table 2: Track changes: summary statistics
Mean Std. Dev. Observations overall 0.217 0.412 N = 78’438 between 0.311 n = 39’219
within 0.270 T = 2
Data source: Geneva Schooling Database for 12 co-horts of students (1993-2007).
Table 3: Proportions of track changes by age of tracking and transition node
1st node 2nd node Total Tracked at 12 26,1% 16,6% 32’652 Tracked at 13 28,4% 18,0% 6’567
p-val 0.000 0.005
Data source: Geneva Schooling Database for 12 cohorts of students (1993-2007).
Notes: p-values report results from the t test on the equality of means across the two sub-samples.
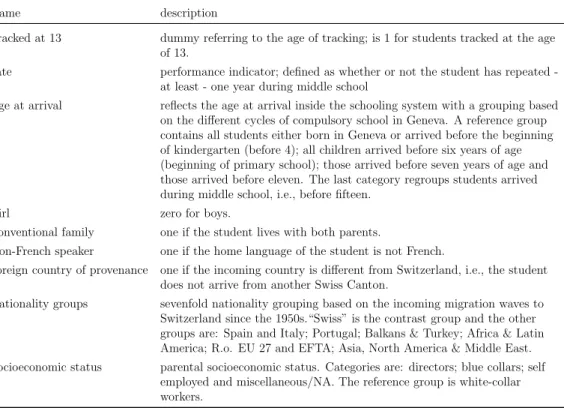
Table 4: Description of independent variables
name description
tracked at 13 dummy referring to the age of tracking; is 1 for students tracked at the age of 13.
late performance indicator; defined as whether or not the student has repeated -at least - one year during middle school
age at arrival reflects the age at arrival inside the schooling system with a grouping based on the different cycles of compulsory school in Geneva. A reference group contains all students either born in Geneva or arrived before the beginning of kindergarten (before 4); all children arrived before six years of age (beginning of primary school); those arrived before seven years of age and those arrived before eleven. The last category regroups students arrived during middle school, i.e., before fifteen.
girl zero for boys.
conventional family one if the student lives with both parents.
non-French speaker one if the home language of the student is not French.
foreign country of provenance one if the incoming country is different from Switzerland, i.e., the student does not arrive from another Swiss Canton.
nationality groups sevenfold nationality grouping based on the incoming migration waves to Switzerland since the 1950s.“Swiss” is the contrast group and the other groups are: Spain and Italy; Portugal; Balkans & Turkey; Africa & Latin America; R.o. EU 27 and EFTA; Asia, North America & Middle East. socioeconomic status parental socioeconomic status. Categories are: directors; blue collars; self
employed and miscellaneous/NA. The reference group is white-collar workers.
Table 5: Baseline results
1st set 2nd set 3rd set
OLS OLS PA OLS PA OLS PA
(1) (2) (3) (4) (5) (6) (7) tracked at 13 0.018*** 0.022*** 0.023*** 0.021*** 0.022*** 0.024*** 0.024*** late 0.113*** 0.110*** 0.113*** 0.111*** 0.115*** 0.114*** arrival: 5-6 y. o. 0.010 0.010 0.011 0.011 0.014 0.013 arrival: 7-8 y. o. 0.028*** 0.024** 0.029*** 0.025*** 0.031*** 0.027*** arrival: 9-12 y. o. 0.018** 0.011 0.020** 0.013* 0.019** 0.012 arrival: 13-15 y. o. 0.066 0.045 0.068 0.047 0.066 0.045 girl -0.028*** -0.029*** -0.028*** -0.029*** -0.028*** -0.028*** conventional family -0.066*** -0.066*** -0.066*** -0.066*** -0.065*** -0.065*** non-French speaker -0.015*** -0.015*** -0.017*** -0.017*** -0.017*** -0.017*** from a foreign country 0.025*** 0.024*** 0.025*** 0.024*** 0.027*** 0.026*** Spain and Italy 0.048*** 0.048*** 0.049*** 0.050*** 0.049*** 0.050*** Portugal 0.079*** 0.077*** 0.078*** 0.076*** 0.077*** 0.074*** Balkans & Turkey 0.075*** 0.074*** 0.070*** 0.067*** 0.068*** 0.065*** Africa & Lat. America 0.102*** 0.096*** 0.099*** 0.092*** 0.098*** 0.090***
R. o. EU 27 0.015* 0.016* 0.016** 0.018** 0.016** 0.018**
Asia, N. America & Middle East 0.021* 0.025* 0.020 0.023* 0.019 0.023* managerial workers -0.050*** -0.055*** -0.043*** -0.050*** -0.043*** -0.050*** self employed 0.038*** 0.039*** 0.038*** 0.039*** 0.038*** 0.039*** blue collar workers 0.044*** 0.045*** 0.043*** 0.043*** 0.042*** 0.042*** misc. /NA 0.069*** 0.063*** 0.067*** 0.061*** 0.067*** 0.061*** school population controls no no no SES & Nationality All
Number of observations 78’438 77’840
Number of ids 39’219 38’930
Legend: * 0.10 ** 0.05 *** 0.01
Note: Dependent variable is the probability to change track and variance is robust and year dummies are included. For PA estimations, marginal effects are reported. School controls include school level proportions of all nationality and socioeconomic groups in the second set and the proportions of all independent variables in the third one.
Table 6: Results by transition node 1st node 2nd node (1) (2) (3) (4) tracked at 13 0.027*** 0.027*** 0.018*** 0.020*** Observations 38,923 38,917 R-squared 0.056 0.058 0.022 0.023
individual controls yes yes yes yes school level controls no yes no yes
Legend: * 0.10 ** 0.05 *** 0.01
Notes: OLS estimation on the probability to change track with robust variance on 12 cohorts.
Table 7: Results by level of performance
Grouping by\ quartile 1st 2nd 3rd 4th cumulative GPA 0.124*** 0.038* 0.039** -0.004
Obs. 3,056 3,300 3,415 3,348
stdzed math score 0.053** -0.001 -0.004 -0.035***
Obs. 2,664 2,555 2,691 5,209 a
indiv. controls yes yes yes yes
Legend: * 0.10 ** 0.05 *** 0.01
Notes: OLS estimation on the probability to change track with robust variance on 2 cohorts (2003 & 2004).
aThe high number of students in the last quartile is due to a peak in the
Table 8: Specification with interactions
cumulative GPA stdzed math score tracked at 13 0.125*** 0.053** q2 -0.061*** -0.063*** q3 -0.154*** -0.107*** q4 -0.273*** -0.166*** tracked at 13*q2 -0.083** -0.053* tracked at 13*q3 -0.090*** -0.057* tracked at 13*q4 -0.134*** -0.092*** Obs. 13,119 13,119 R-squared 0.116 0.083
indiv. controls yes yes
Legend: * 0.10 ** 0.05 *** 0.01
Notes: OLS estimation on the probability to change track with robust variance on 2 cohorts.
References
Angrist, J. D., Pischke, J.-S., 2009. Mostly harmless econometrics: an em-piricist’s companion. Princeton University Press, Princeton.
Bain, D., Davaud, C., Favre, B., Hexel, D., Jaeggi, J.-M., Lurin, J., Ras-toldo, F., Soussi, A., 2000. H´et´erog´en´eit´e au cycle d’Orientation. Tech. rep., Service de la Recherche en Education, Geneva, Switzerland.
Bauer, P., Riphahn, R. T., 2006. Timing of school tracking as a determinant of intergenerational transmission of education. Economics Letters 91 (1), 90–97.
Betts, J. R., 2011. The economics of tracking in education. In: Handbook of the Economics of Education. Vol. 3. North-Holland, Amsterdam; London, pp. 341–381.
Blundell, R., Costa Dias, M., 2000. Evaluation methods for non-experimental data. Fiscal studies 21 (4), 427–468.
Brunello, G., Checchi, D., 2007. Does school tracking affect equality of op-portunity? new international evidence. Economic Policy 22 (52), 781–861. Caliendo, M., Kopeinig, S., 2008. Some practical guidance for the implemen-tation of propensity score matching. Journal of Economic Surveys 22 (1), 31–72.
Cameron, A., Trivedi, P., 2005. Microeconometrics methods and applications. Cambridge University Press, Cambridge; New York.
Correll, S. J., 2004. Constraints into preferences: Gender, status, and emerg-ing career aspirations. American Sociological Review 69 (1), 93–113. CSO, 2011. Taux de vancance selon la taille des logements depuis 1985. Tech.
rep., Cantonal Statistical Office, Geneva.
Davis, J. A., 1966. The campus as a frog pond: An application of the theory of relative deprivation to career decisions of college men. American Journal of Sociology, 17–31.
Freedman, D. A., Berk, R. A., 2008. Weighting regressions by propensity scores. Evaluation Review 32 (4), 392–409.
Hanushek, E. A., Woessmann, L., 2006. Does educational tracking affect per-formance and inequality? differences-in-differences evidence across coun-tries. The Economic Journal 116 (510), 63–76.
Hoxby, C. M., Weingarth, G., 2005. Taking race out of the equation: School reassignment and the structure of peer effects. Unpublished manuscript. Imbens, G. W., 2004. Nonparametric estimation of average treatment effects
under exogeneity: A review. Review of Economics and statistics 86 (1), 4–29.
Imbens, G. W., Wooldridge, J. M., 2009. Recent developments in the econo-metrics of program evaluation. Journal of Economic Literature 47 (1), 5– 86.
Jonsson, J. O., Mood, C., 2008. Choice by contrast in Swedish schools: How peers’ achievement affects educational choice. Social Forces 87 (2), 741– 765.
Koerselman, K., 2013. Incentives from curriculum tracking. Economics of Education Review 32, 140–150.
Malamud, O., Pop-Eleches, C., 2011. School tracking and access to higher ed-ucation among disadvantaged groups. Journal of Public Economics 95 (11), 1538–1549.
Marsh, H. W., Hau, K. T., 2003. Big-fish-little-pond effect on academic self-concept: A cross-cultural (26-country) test of the negative effects of aca-demically selective schools. American Psychologist 58 (5), 364–376. Meghir, C., Palme, M., 2005. Educational reform, ability, and family
back-ground. The American Economic Review 95 (1), 414–424.
Muehlenweg, A., 2007. Educational effects of early or later secondary school tracking in Germany. ZEW-Centre for European Economic Research Dis-cussion Paper No. 07-079.
OECD, 2012. Education at a Glance 2012: Oecd Indicators. Organization for Economic Cooperation and Developement, Paris.
Piopiunik, M., 2013. The effects of early tracking on student performance: Evidence from a school reform in bavaria. Ifo Working Paper Series Ifo Working Paper No. 153, Ifo Institute for Economic Research at the Uni-versity of Munich.
Sacerdote, B., 2011. Peer effects in education: How might they work, how big are they and how much do we know thus far? In: Handbook of the Economics of Education. Vol. 3. North-Holland, Amsterdam; London, pp. 249–277.
SFSO, 2011. Evolution du nombre d´el`eves et d’´etudiants, par degr´e de sco-larit´e. Tech. rep., Swiss Federal Statistical Office, Neuchˆatel.
SKBF, 2011. Swiss Education Report 2010. Tech. rep., Swiss Coordination Centre for Research in Education, Aarau.
SRED, 2011. L’enseignement `a Gen`eve. indicateurs cl´es du syst`eme genevois d’enseignement et de formation. Tech. rep., Service de la Recherche en Education, Geneva.
van Elk, R., van der Steeg, M., Webbink, D., 2011. Does the timing of track-ing affect higher education completion? Economics of Education Review 30 (5), 1009–1021.
Wade, T. J., Abetz, H., 1997. Social cognition and evolutionary psychology: Physical attractiveness and contrast effects on women’s self-perceived body image. International Journal of Psychology 32 (4), 247–263.
A. Appendix
Table A.1: Descriptive statistics of independent variables
tracked at 12
tracked at 13
percent percent p val.
late 7.73 10.75 0.000
arrival: before school 87.21 87.54 0.104
arrival: 5-6 y. o. 4.56 3.82 0.000 arrival: 7-8 y. o. 3.50 3.37 0.240 arrival: 9-12 y. o. 4.53 5.09 0.000 arrival: 13-15 y. o. 0.20 0.18 0.401 girl 51.43 49.92 0.000 conventional family 74.67 74.17 0.061 non French-speaker 37.40 33.59 0.000 from a foreign country 18.17 17.89 0.248
Switzerland 66.20 68.46 0.000
Spain and Italy 12.08 11.93 0.433
Portugal 7.88 9.17 0.000
Balkans and Turkey 2.79 2.44 0.000
Africa and Lat. America 4.07 3.03 0.000
EU 27 4.34 3.50 0.000
Asia, N. America and Middle East 2.64 1.48 0.000
white collars 41.93 39.32 0.000
managerial worker 18.65 19.45 0.001
self employed 5.88 6.39 0.000
blue collars 29.93 31.09 0.000
misc. /NA 3.61 3.76 0.199
Source: Geneva Schooling Database for 12 cohorts (1993-2007).
Notes: p-values report results from the result of the t test on the equality of means across the two sub-samples.
Table A.2: Results by sub-sample
Academic track Gen. School Prof. school Apprenticeship
First set tracked at 13 0.019*** 0.000 0.017* 0.021
R-squared 0.037 0.039 0.016 0.026
Second set tracked at 13 0.023*** 0.002 0.001 0.022
R-squared 0.039 0.042 0.019 0.027
Third set tracked at 13 0.022*** -0.002 0.005 0.030*
R-squared 0.040 0.043 0.020 0.029
Observations 40,586 8,809 13,676 6,392
Legend: * 0.10 ** 0.05 *** 0.01
Notes: OLS estimation on the probability to change track with robust variance on 12 cohorts. First set only includes individual controls while the second set additionally controls for middle school level proportions of SES and nationality groups. The third one adds proportions of all variables at the school level. Results for remedial education and dropouts are omitted.
T able A.3: Re sults b y group of p erformance and first tran siti on choice Academic trac k Gen . Sc ho ol Prof. Sc ho ol Appren ticeship b elo w med. ab o v e med. b elo w med. ab o v e med. b elo w med. ab o v e med . b elo w med. ab o v e med. trac k ed at 13 0.075*** 0.002 0.006 -0.013 0.090** 0.037 0.083 -0.060 Observ at ions 3,480 3,718 450 506 1,277 1,440 333 342 R-squared 0.04 0.024 0.088 0.046 0.032 0.045 0.116 0.06 indiv. con trols y es y es y es y es y es y es y es y es Legend: * 0.10 ** 0.05 *** 0.01 Notes: OLS estimation on the probabilit y to change trac k with robust v ariance on 2 cohorts (2003 & 2004). Results for remedial education and drop outs are omitted.
© CRAG – Haute Ecole de Gestion de Genève
Cahiers de recherche du Centre de Recherche Appliquée en
Gestion (CRAG) de la Haute Ecole de Gestion - Genève
© 2013
CRAG – Centre de Recherche Appliquée en Gestion
Haute école de gestion - Genève Campus de Battelle, Bâtiment F
7, route de Drize – 1227 Carouge – Suisse [email protected]
www.hesge.ch/heg/crag +41 22 388 18 18 +41 22 388 17 40