© 2020 ISTE OpenScience – Published by ISTE Ltd. London, UK – openscience.fr Page | 1
A significant effect of bone anisotropy on reliability
measurements of mini-plate fixation system used in
multiple mandibular fractures: A clinical case of angular
and parasymphysis fractures
Un effet significatif de l’anisotropie de l’os sur les mesures de fiabilité du
système de fixation par mini-plaques utilisé dans les fractures
mandibulaires multiples : Un cas clinique de fractures angulaires et de
parasymphyse
Ghais Kharmanda1*, Hasan Mulki2, Mohamed Yasser Kharma3 1
Mechanics Laboratory of Normandy, INSA Rouen, France
2
College of Engineering and Technology, American University of the Middle East, Kuwait, Hasan.Mulki@aum.edu.kw
3
Department of Oral Maxillofacial Surgery, Al-Farabi College for Dentistry, Saudi Arabia
ABSTRACT. Mechanical properties of bone tissues are very important when introducing fixed mini-plates into multiple fracture cases. The effect of these properties becomes more significant when dealing with reliability analysis where several failure modes can occur. In our previous work, the anisotropy case considering a single fracture case and a single failure mode, led to a low reliability index value during the convalescence period. In this work, the studied clinical case contains two different fractures that certainly leads to a very low reliability index value. This makes no sense to assess the reliability level at the convalescence period. Thus, the anisotropy effect is studied at the end of the healing period where the fracture surfaces must be bonded. Two material models are elaborated for the studied clinical case (a male patient at the age of 35 years) where two different fractures exist. In Study I, isotropic bone tissues are considered, while in Study II, anisotropic (orthotropic) bone tissues are considered. A successful healing requires that a number of constraints which are affected by the loading conditions are fulfilled, and since muscle activity is difficult to estimate, there is a strong need to introduce the uncertainty on the loading in order to obtain a reliable design. The failure mode occurs when the yield stress of one or more parts is reached. The results show that when performing a direct simulation, there is a significant difference of maximum von-Mises stresses in the cancellous bone tissues between the isotropy and anisotropy cases. In addition, the failure modes and the reliability indices are very affected when considering the bone anisotropy. It is
recommended to consider bone anisotropy in order to obtain more realistic results.
KEYWORDS. Bone anisotropy, Multiple mandibular fractures, Mini-plate fixation, Reliability analysis.
1. Introduction
The mandible fracture injuries are frequently caused by vehicle accidents, falls, violence and sport (Ogundare et al. 2003; Simsek et al. 2007). The mini-plates system is one of the fractured mandible fixation approaches. During the surgery operation, some muscles are cut or harmed and cannot subsequently operate at its maximum capacity. Thus, there is a strong need to integrate the uncertainty on the loading in order to obtain reliable designs. Several works have been carried out to perform optimization and/or reliability concepts on this type of fixation. Kharmanda et al. (2014) confirmed the effect of the muscle force consideration during the conceptual and detailed design stages. Kharmanda and Kharma (2016) applied structural optimization and reliability concepts to the mini-plate fixation system used in symphysis mandibular fractures (unilateral fracture, a clinical case of a mal patient 28 years of age) considering a single cortical bone tissue. Kharmanda et al. (2017a) evaluated the reliability level for different failure modes considering also a single bone tissue (only cortical tissue) as an isotropic material. Considering that the mandible consists of cortical and cancellous tissues, Kharmanda et al. (2017b) presented a study of another clinical case of a fractured mandible (frontal fracture, a mal patient 35 years of age) to evaluate the reliability level in both convalescence and
© 2020 ISTE OpenScience – Published by ISTE Ltd. London, UK – openscience.fr Page | 2
healing periods. On the other hand, when considering the bone anisotropy, Kharmanda et al. (2016) and Kharmanda et al. (2018) used an equivalent isotropic approximation to deal with orthotropic behaviors. Kharmanda et al. (2019) showed the effect of the bone anisotropic on the reliability assessment of mini-plate fixation system stabilization in symphysis mandibular fractures. They elaborated two material models of a clinical case with a single fracture under the convalescence period: Case I (a single isotropic bone tissue) and Case II (composite anisotropic bone tissues). The single failure mode which had occurred, was the relative displacement threshold. However, in this work, a clinical case with double fractures is studied at the end of the healing period where the fracture surfaces must be bonded. The reliability level is evaluated when the maximum von-Mises stress value at least in one component (part) exceeds its corresponding yield value. This way a multiple failure mode case may occur when two or more limit state functions (equality constraints) verified. Comparing to the previous works in literature, Ramos et al. (2014) evaluated the displacement in the isotropy and anisotropy cases. They studied the same mandible considering three bone material models. The first model was composed of a single isotropic cortical bone tissue. The second model was composed of isotropic cortical and cancellous bone tissues. In the third model, Young's modulus was obtained from a CT scan as a function of the pixel value. They found that when considering the anisotropy case, the displacement values were higher than those resulted from isotropy case. Their result is similar to our first finding in this work when performing a direction simulation. Furthermore, in Kharmanda et al. (2019), the studied fractured mandible had a low reliability index value. In this work, the studied model is more complicated and contains two fractures (angular and parasymphysis fractures) which certainly leads to very low reliability index. This way there is no sense to assess the reliability level at the convalescence period where there is a gap between the two fracture surfaces. Therefore, the effect of the anisotropy is extended here to reliability measurements at the end of the healing period.
2. Materials and methods 2.1. Model description
2.1.1. Clinical case
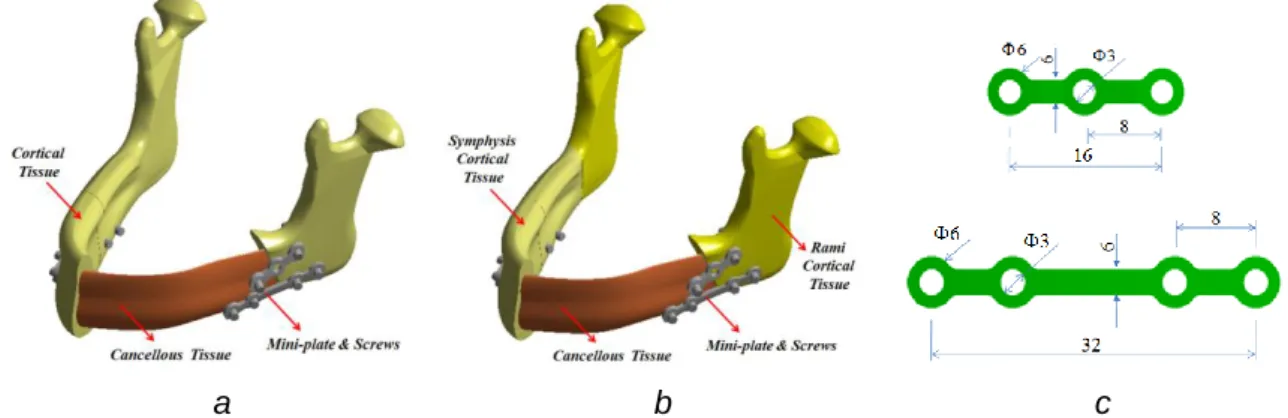
Figure 1a shows an orthopantomogram of a male patient at the age of 35 years. This case is analyzed as a clinical case of angular and parasymphysis fractures. The surgical operation was realized at Aleppo University Hospital by the third author. The surgeon used mini-plates of I types (Figure 2c). Two mini-plates (3 hole mini-plate with 2 screws and 4 hole mini-plate with 4 screws) for the angular fracture and one mini-plate (4 hole mini-plate with 4 screws) for the parasymphysis fracture as shown in Figure 1a. There were no specific complications related to treatment and the healing period was almost three months. The patient was advised to only drink liquids for one week after the operation (at the beginning of the convalescence period) and to eat soft diet for 12 weeks to minimize bite forces.
a b
Figure 1. a) Orthopantomogram of a male patient at the age of 35 years, b) Geometrical model of the studied fractured mandible
© 2020 ISTE OpenScience – Published by ISTE Ltd. London, UK – openscience.fr Page | 3 2.1.2. Geometry and meshing
A numerical representation of the mandible geometry is carried out using SolidWorks software and the numerical simulation and optimization procedures are performed using the ANSYS software. Due to the limited effect of the teeth on the mechanical response of the mandible, these are for simplicity ignored in the geometrical models. Figure 1b shows the geometrical model of the studied fractured mandible (anatomical description) with the mini-plates and screws. To simplify the following study, the studied mandible domain is divided into four parts as shown in Figure 1b. According to the fracture line, the mandible is divided into front and back parts. According to the bite force application line, it is divided into right and left parts. In Figure 2a, cortical and cancellous bone tissues are the used layers for Study I, while Figures 2b represents Study II where the cortical bone tissues is divided into two layers: symphysis and ramus bone tissues.
a b c
Figure 2. a) Components for Study I, b) Components for Study II, and c) Dimensions of the used mini-plates
The finite element mesh consists of 42837 elements (47013 nodes) for Study I and 43462 elements (47596 nodes) for Study II (non-linear elements of the types: CONTACT & SOLID). It is assumed that there is no movement between the fracture surfaces at the end of the healing period. For the angular fracture, two mini-plates were used where the kind of the upper mini-plate is one 3-hole I-plate (only 2 screws), while for the lower, a 4 hole I-plate (4 screws) is used. For the parasymphysis fracture, only one single 4 hole I-plate (4 screws) is used. The screws are modeled as simple cylinders with a length appropriate for penetration. Standard I mini-plates are used and the dimensions of the mini-plates are shown in Figure 2c. In accordance with the locking type mini-plate concept, the interface between the screws and the plates is considered fully bonded. It is supposed that there is no contact between the mini-plate surfaces and the bone. The thickness of the mini-plates is chosen to be: 2mm.
2.1.3. Material properties
The used materials (metal and bone) in this study are assumed to be homogenous and linear elastic. The mini-plates and the screws are made of titanium with Young’s modulus 110GPa and Poisson’s ratio 0.34. The yield stress of the mini-plates is: yMet 860MPa (Korkmaz 2007). In Study I, the mandible consists of two tissues: The cortical bone tissue is considered to be isotropic with Young’s modulus 15750 MPa and Poisson’s ratio 0.325 and the cancellous bone tissue is also considered to be isotropic with Young’s modulus 300 MPa and Poisson’s ratio 0.3 (Reina-Romo et al. 2010). The corresponding yield stress for the cortical bone in tension is taken as Cory 110MPa and for the cancellous bone in tension is taken as Cany 3MPa. However, in Study II, the mandible is assumed to be composed of three tissues with anisotropic behavior. All material properties are found in Table 1 (Castano et al. 2002; Kharmanda et al. 2019). Considering the equivalent isotropic approximation in Bonnet et al. (2009), the equivalent Young's modulus can be calculated. Then, using the proposed
© 2020 ISTE OpenScience – Published by ISTE Ltd. London, UK – openscience.fr Page | 4
optimized formulation by Kharmanda (2015), the corresponding yield stress in tension for the cortical (symphysis and ramus) bone tissue is taken as: Cory 95MPa and for the cancellous bone tissue is taken as: Cany 4.5MPa.
Parameters Cancellous Tissue Cortical Tissues
Sym. Ram. x E (MPa) 960 22900 17000 y E (MPa) 390 14200 13800 z E (MPa) 320 10500 10600 xy 0.3 0.19 0.38 yz 0.3 0.31 0.23 xz 0.3 0.29 0.47 xy G (MPa) 170 6000 6200 yz G (MPa) 130 3700 4100 xz G (MPa) 90 4800 5400
Table 1. Material properties used in the bone anisotropic model (Castano et al. 2002; Kharmanda et al. 2019)
2.1.4. Boundary conditions
The muscle forces being included in the model are Superficial Masseter (SM), Deep Masseter (DM), Anterior Temporalis (AT), Medial Temporalis (MT), Posterior Temporalis (PT) and Medial Pterygoid (MP) (their component values are in Table 2).
Muscle Forces Fx(N) Fy(N) Fz(N) Superficial Masseter (SM) 18.2 303.3 12.1
Deep Masseter (DM) 7.8 128.3 15.6
Anterior Temporalis (AT) -18.4 104.8 -43.8
Medial Temporalis (MT) -6.5 36.3 -53.1
Posterior Temporalis (PT) -3.4 6.8 -37
Medial Pterygoid (MP) 187.4 325.1 -76.5
Table 2. Muscle forces components (Mesnard et al. 2011)
During the bite process, the digastric muscles are not significantly active and therefore for simplicity ignored in analysis (Ramos et al. 2014). According to Figure 3, the bite force is applied in regions J and G. The sums of the masseter muscle forces are Right
M and Left
M and applied in regions F and H. The sums of the temporal muscle forces are Right
T and Left
T and applied in regions A and B. Finally, the sums of the pterygoid muscle forces are Right
P and Left
P and applied in regions E and I. The fixation of the mandible is located at regions C and D.
© 2020 ISTE OpenScience – Published by ISTE Ltd. London, UK – openscience.fr Page | 5 Figure 3. Illustration of the boundary conditions
The muscle forces existing in Table 2 are measured at its maximum capacity of an un-fractured mandible (Mesnard et al. 2011), which corresponds to a bite force of F208N. In the case where a mandible fracture exists, the different muscle activities are not well known (non-deterministic). This indicates that in order to evaluate the probability of failure, the muscle activity (forces) cannot be taken as known, but must be considered as non-deterministic values. The force values represent the mean values which are considered to be associated with the starting point. Due to the existing uncertainties in the muscle forces, a reliability analysis is essential in order to determine the failure modes to get a well performing fixation system.
2.2. Reliability analysis
2.2.1. Reliability concept and formulations
In structural reliability theory, several effective tools have been developed, namely FORM, SORM and simulation techniques (Kharmanda and El-Hami 2016). According to Hasofer and Lind (1976), the normalized space of independent Gaussian variables (Figure 4b) is utilized instead of the space of physical variables (Figure 4a). The transformation of the random variables y into the standard normalized space is computed as u = T(y) considering that T(y) is the probabilistic transformation function.
a b
Figure 4. a) The physical space, and b) The normalized space
The probabilistic transformation function is assumed to follow the normal distribution law and it defines the normalized variable ui by the transformation
i i i i y m u (1)
© 2020 ISTE OpenScience – Published by ISTE Ltd. London, UK – openscience.fr Page | 6
where yi is the random variable in the physical space, with the mean values mi and standard-deviations i. The standard deviations are here assumed to be proportional to the mean values. The reliability index is obtained from the solution of a particular constrained optimization problem:
min d u . .: max(s t Hj( )) 0
u (2)
where the distance is calculated by:
2 i
d =
u (3)The solution to Problem (2) leads to the Most Probable failure Point (MPP) and the resulting minimum value represents the distance between the active limit state function H(u) and the origin of the normalized space. Two failure cases can be distinguished:
– The first failure case is called Single Failure Mode (S.F.M.) where the MPP is found at the minimum distance between the origin of the normalized space and a single limit state curve/ surface.
The second failure case is called Multiple Failure Modes (M.F.M.) where the MPP is found at the minimum distance between the origin of the normalized space and the intersection of two or more limit state curves/surfaces.
2.2.2. Failure modes
There are several modes that can lead to failure. Mini-plate fracture has been reported in several works (Jensen et al. 2006; Colletti et al. 2014). These types of failure are either due to fracture or yield of the mini-plates. Since fracture is usually associated with prior yielding, the threshold for the stresses in the mini-plates is set to the yield strength Met
y
of the material. The other potential cause of failure is when the yield stress in the bone tissues is exceeded.
For Study I, considering the different failure modes ( i)0
I j u
H , the reliability index problem can be expressed as follows: 2 1 1 max 2 max 3 max 4 max 5 min : ( ) . . : ( ) ( ) 0 : ( ) ( ) 0 : ( ) ( ) 0 : ( ) ( ) 0 : ( ) n i i i I RightUpper Met i i y I RightLower Met i i y I Left Met i i y I CorRightFront Cor i i y I i d u u s t H u u H u u H u u H u u H u
max 6 max 7 max 8 max 9 max ( ) 0 : ( ) ( ) 0 : ( ) ( ) 0 : ( ) ( ) 0 : ( ) ( ) CorLeftFront Cor i y I CorRightBack Cor i i y I CorLeftBack Cor i i y I CanRightFront Can i i y I CanLeftFront C i i y u H u u H u u H u u H u u 10 max 11 max 0 : ( ) ( ) 0 : ( ) ( ) 0 an I CanRightBack Can i i y I CanLeftBack Can i i y H u u H u u (9)The first three constraints (H1I( )ui 0, H2I( )ui 0 and H3I( )ui 0) are associated with the metal parts,
© 2020 ISTE OpenScience – Published by ISTE Ltd. London, UK – openscience.fr Page | 7
cancellous tissue and the other constraints ( H4I( )ui 0 , H5I( )ui 0 , H6I( )ui 0 and H7I( )ui 0 ) are
associated with the cortical tissue (see Figures 1b and 2a for the distribution of the different parts). For Study II, considering the different failure modes ( i)0
II j u
H , the reliability index problem can be expressed as follows: 2 1 1 max 2 max 3 max 4 max 5 min : ( ) . . : ( ) ( ) 0 : ( ) ( ) 0 : ( ) ( ) 0 : ( ) ( ) 0 : ( n i i i II RightUpper Met i i y II RightLower Met i i y II Left Met i i y II SymRightFront Cor i i y II d u u s t H u u H u u H u u H u u H
max 6 max 7 max 8 max 9 max ) ( ) 0 : ( ) ( ) 0 : ( ) ( ) 0 : ( ) ( ) 0 : ( ) ( ) SymLeftFront Cor i i y II SymLeftBack Cor i i y II RamRight Cor i i y II RamLeft Cor i i y II CanRightFront Ca i i y u u H u u H u u H u u H u u 10 max 11 max 12 max 0 : ( ) ( ) 0 : ( ) ( ) 0 : ( ) ( ) 0 n II CanLeftFront Can i i y II CanRightBack Can i i y II CanLeftBack Can i i y H u u H u u H u u (10)The first three constraints (H1II( )ui 0, H2II( )ui 0 and H3II( )ui 0) are associated with the metal parts,
the last four constraints ( H9II( )ui 0, H10II( )ui 0, H11II( )ui 0 and H12II( )ui 0) are associated with the
cancellous tissue and the other constraints (H4II( )ui 0, H5II( )ui 0, H6II( )ui 0, H7II( )ui 0 and H8II( )ui 0)
are associated with the cortical tissue whereH4II( )ui 0, H5II( )ui 0and H6II( )ui 0 are related to symphysis
tissue, and H7II( )ui 0 and H8II( )ui 0 are related to ramus tissue (see Figure 1b and 2b for the
distribution of the different parts).
The random variable vector y contains 20 force components: 2 for the bite force and 18 for the muscle forces. In general, in structural engineering applications, the reliability index should be in the range [34.25] (Kharmanda and El-Hami 2016; Kharmanda and El-Hami 2017). The standard deviations are considered here to be proportional to the mean point (50%).
3. Results and discussion
Taking into account the muscle force values in Table 2 and the bite force value at its maximum capacity of an un-fractured mandible, the components of the these forces in reference to the selected coordinate system are given in Tables 3 and 5, that represent the starting point (SP) for Studies I and II. For Study I, when performing a direct simulation, the maximum von-Mises stress which is considered as a fracture indicator (Gross and Abel 2001), is found at the upper right mini-plate as shown in Figure 5a. Its value equals to: maxRightUpper 87MPa. The maximum total displacement is located at left cortical bone tissue (Figure 5b). Its value equals to: maxCorLeftBack 0.3mm. The maximum von-Mises stress values in the cortical and cancellous tissues are: maxCorLeftBack 86MPa and maxCanRightFront 1.7MPa, respectively.
© 2020 ISTE OpenScience – Published by ISTE Ltd. London, UK – openscience.fr Page | 8
a b
Figure 5. Distribution of a) von-Mises stress and b) total displacement, for Study I at the starting point
For Study II, when performing a direct simulation, the maximum von-Mises stress is found at the upper right mini-plate as shown in Figure 6a. Its value equals to: maxRightUpper 106MPa. The maximum total displacement is located at left cortical bone tissue. Its value equals to: maxCorLeftBack 0.4mm. The maximum von-Mises stress values in the cortical and cancellous tissues are: maxRamiRight 77MPa and
4 max k CanLeftBac MPa, respectively. a b
Figure 6. Distribution of a) von-Mises stress and b) total displacement, for Study II at the starting point
At the SP, the resulting maximum values of von-Mises stress and total displacement for Study II are higher than those of Study I. Ramos et al. (2014) found a similar result when evaluating the displacement in the anisotropy case. In addition to their findings, an anisotropy influence study is extended here to other output parameters and reliability studies.
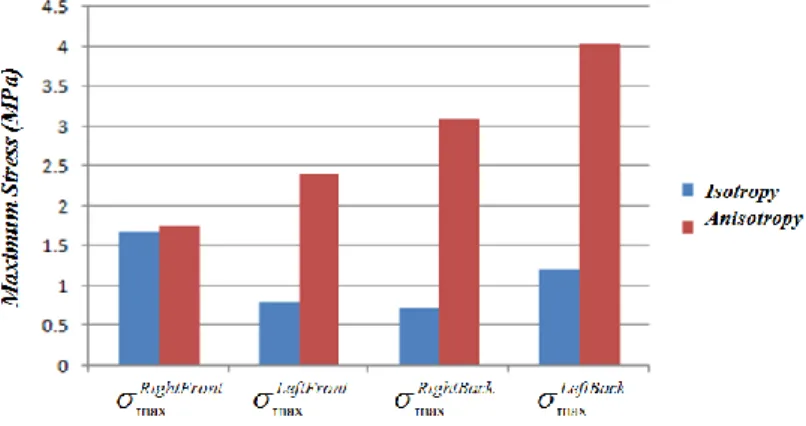
A significant difference between the maximum von-Mises stress values in the cancellous tissues is noted at the starting point. Figure 7 shows comparison between the maximum von-Mises stresses in the different cancellous bone parts when considering the bone isotropy and anisotropy. For the anisotropy study, the maximum von-Mises stresses in three cancellous bone parts may lead to failure in the case of small variations of the force values, especially in the left part (maxCanLeftBack 4.04 MPa). Thus, it is mandatory to consider the bone anisotropy during the design studies.
© 2020 ISTE OpenScience – Published by ISTE Ltd. London, UK – openscience.fr Page | 9 Figure 7. Comparison between the maximum von-Mises stresses in the cancellous bone tissue
when considering the bone isotropy and anisotropy
Furthermore, there is a small increase of maximum von-Mises stress values in the metal parts (mini-plates and screws) when considering the anisotropy. This increase will not affect the failure modes in the metal parts since they are far from the metal yield stress values. However, the maximum von-Mises stress values in the cortical bone tissue are lower when considering the anisotropy (Tables 4 and 6).
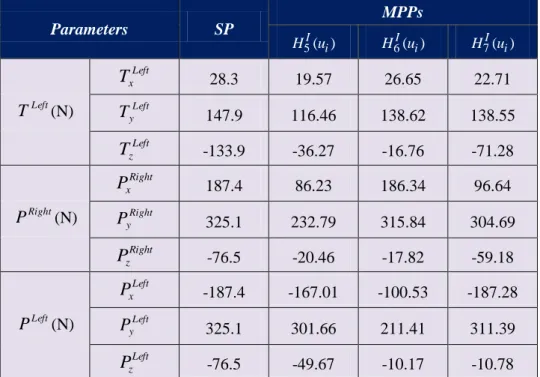
On the other hand, after performing the reliability analysis, it is found that the anisotropy has a very big effect on the reliability measurements which may lead to several failure modes. For Study I, Table 3 presents the different forces values at the starting point (SP) and the three resulting MPPs for the following single failure mode (S.F.M.) cases:H5I(ui), H6I(ui) and H7I(ui). At the MPPs, the bite and muscle force symmetry is broken significantly and it is noted that there is a significant increase of resulting bite force values when reaching the following failure mode: H5I(ui)0.
Parameters SP MPPs 5I( )i H u H6I( )ui H7I( )ui Right F (N) FyRight -104 -145.78 -62.80 -54.91 Left F (N) FyLeft -104 -111.74 -50.75 -53.44 Right M (N) Right x M 26 11.70 23.01 19.68 Right y M 431.6 165.79 419.44 394.73 Right z M 27.7 18.06 26.79 16.39 Left M (N) Left x M -26 -4.87 -2.86 -2.97 Left y M 431.6 344.81 409.22 382.45 Left z M 27.7 9.00 25.79 14.28 Right T (N) Right x T -28.3 -28.28 -7.77 -18.19 Right y T 147.9 111.23 138.53 120.44 Right z T -133.9 -78.10 -61.29 -100.38
© 2020 ISTE OpenScience – Published by ISTE Ltd. London, UK – openscience.fr Page | 10 Parameters SP MPPs 5I( )i H u H6I( )ui H7I( )ui Left T (N) Left x T 28.3 19.57 26.65 22.71 Left y T 147.9 116.46 138.62 138.55 Left z T -133.9 -36.27 -16.76 -71.28 Right P (N) Right x P 187.4 86.23 186.34 96.64 Right y P 325.1 232.79 315.84 304.69 Right z P -76.5 -20.46 -17.82 -59.18 Left P (N) Left x P -187.4 -167.01 -100.53 -187.28 Left y P 325.1 301.66 211.41 311.39 Left z P -76.5 -49.67 -10.17 -10.78
Table 3. The forces values for the SP and the MPPs for Study I.
Parameters SP MPP 5I( )i H u H6I( )ui H7I( )ui Metal RightUpper max 86.80 71.09 81.52 38.62 RightLower max 54.61 59.37 40.79 30.07 Left max 42.47 36.37 22.69 28.92 Cor. Bone ont CorRightFr max 42.53 99.66 58.12 39.98 nt CorLeftFro max 36.27 110.00 51.82 44.09 ck CorRightBa max 74.34 61.15 109.88 81.06 k CorLeftBac max 85.93 56.46 93.43 109.96 Can. Bone ont CanRightFr max 1.69 1.41 1.33 0.97 nt CanLeftFro max 0.81 1.81 1.03 0.91 ck CanRightBa max 0.73 1.63 1.54 0.89 k CanLeftBac max 1.22 1.97 1.05 1.50 --- 4.04 4.25 3.60
Table 4. The maximum von-Mises stress values at the SP and the MPPs for Study I
Table 4 presents the output parameters at the starting point and the three resulting MPPs for the following single failure mode cases: H5I(ui), H6I(ui) and H7I(ui). The resulting component reliability index values for Study I, are: 4.04, 4.25 and 3.60 at the following limit state functions:
0 max Cor y nt CorLeftFro
, maxCorRightBack yCor 0 and maxCorLeftBack Cory 0, respectively. It is noted in this isotropy study that the failure only occurs in the cortical bone tissues and the minimum component reliability index value equals to: 3.60. This resulting value belong to the acceptable interval in
© 2020 ISTE OpenScience – Published by ISTE Ltd. London, UK – openscience.fr Page | 11
structural engineering applications [34.25]. Despite the muscle forces reach their maximum values (90%), the von-Mises stresses do not exceed the corresponding yield stresses in the metal and the cancellous tissues and the algorithm cannot lead to a multiple failure mode (M.S.M.) case.
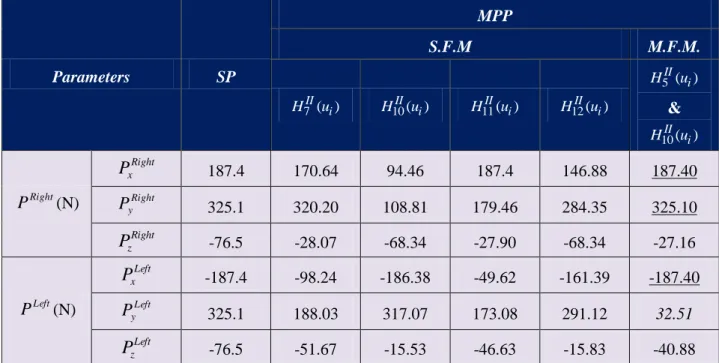
In Kharmanda et al. (2019), the effect of the anisotropy led to a big difference when evaluating the reliability index during the convalescence period and considering only a single failure mode. Here, the objective is to identify the role of the anisotropy at the end of the healing period when considering multiple mandibular fracture and multiple failure mode cases. For Study II (anisotropy), Table 5 presents the different forces values at the starting point (SP) and the five resulting MPPs: four MPPs for the following single failure mode cases: H7II(ui), H10II(ui), H11II(ui) and H12II(ui), and one MPP for a multiple failure mode case where the intersection between the two following limit state functions:
) (
5 i II
u
H & H10II(ui) is occurred. At the MPPs for the single failure mode cases, the bite and muscle force symmetry is broken significantly and it is noted that there is an increase of the resulting values of bite force applied on the right mandible part when reaching the following failure modes: H10II(ui)0 and H12II(ui)0. However, this increase is applied on the left mandible part for the M.F.M. case where the intersection between the two following limit state functions: H5II(ui) & H10II(ui) is occurred. In addition, it is shown that the muscle force components MyLeft and
Left y
P reached their lowest limits and nine muscle forces components (MxRight, Right
y
M , Right
z
M ,MxLeft,TxRight, Right z
T ,PxRight, Right y
P and PxLeft) kept their mean values. Parameters SP MPP S.F.M M.F.M. 7II( )i H u H10II( )ui H11II( )ui H12II( )ui 5II( )i H u & 10II( )i H u Right F (N) FyRight -104 -62.44 -110.75 -87.49 -108.5 -50.00 Left F (N) FyLeft -104 -54.70 -70.35 -90.43 -51.14 -137.01 Right M (N) Right x M 26 18.64 21.50 19.98 21.11 26.00 Right y M 431.6 336.77 377.61 342.59 426.77 431.60 Right z M 27.7 26.88 14.16 18.63 25.43 27.70 Left M (N) Left x M -26 -6.55 -16.41 -12.21 -22.06 -26.00 Left y M 431.6 425.79 263.46 197.14 396.44 43.16 Left z M 27.7 14.85 14.93 14.12 15.04 22.47 Right T (N) Right x T -28.3 -8.94 -25.28 -17.23 -19.96 -28.30 Right y T 147.9 142.48 91.19 97.69 114.83 109.01 Right z T -133.9 -101.44 -128.94 -86.90 -124.70 -133.90 Left T (N) Left x T 28.3 26.12 25.99 15.44 27.07 23.40 Left y T 147.9 84.40 94.70 75.33 107.76 74.45 Left z T -133.9 -105.34 -80.32 -71.71 -77.50 -68.28
© 2020 ISTE OpenScience – Published by ISTE Ltd. London, UK – openscience.fr Page | 12 Parameters SP MPP S.F.M M.F.M. 7II( )i H u H10II( )ui H11II( )ui H12II( )ui 5II( )i H u & 10II( )i H u Right P (N) Right x P 187.4 170.64 94.46 187.4 146.88 187.40 Right y P 325.1 320.20 108.81 179.46 284.35 325.10 Right z P -76.5 -28.07 -68.34 -27.90 -68.34 -27.16 Left P (N) Left x P -187.4 -98.24 -186.38 -49.62 -161.39 -187.40 Left y P 325.1 188.03 317.07 173.08 291.12 32.51 Left z P -76.5 -51.67 -15.53 -46.63 -15.83 -40.88
Table 5. The forces values for the SP and the MPPs for Study II
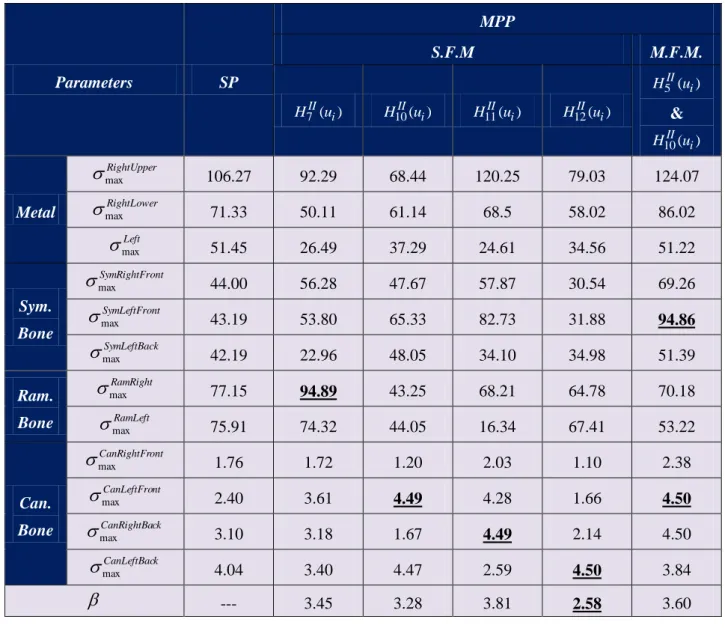
Table 6 presents the output parameters at the starting point and the five resulting MPPs: four MPPs for the following single failure mode cases: H7II(ui), H10II(ui), H11II(ui) and H12II(ui), and one MPP for a multiple failure mode case where the intersection between the two following limit state functions:
) (
5 i II
u
H & H10II(ui) is occurred. The resulting component reliability index values for Study II, are: 45
. 3
, 3.28, 3.81 and 2.85 at the following limit state functions: max 0
Cor y RamRight , 0 max Can y nt CanLeftFro , max 0 Can y ck CanRightBa and max 0 Can y k CanLeftBac
, respectively. However, the resulting system reliability index value for Study II, is: System 3.60 at the intersection of the two following limit state functions: max 0
Cor y nt SymLeftFro & max 0 Can y nt CanLeftFro .
When considering Study I, the resulting reliability index for the considered force variability equals to 3.6 which corresponds to a low failure probability 0.02%. However, when considering Study II, it equals to 2.58 which corresponds to a high failure probability 0.5%. To consider the ramus cortical tissue in Study II, the von-Mises stress distribution in the cortical tissue is much homogeneous than Study I where a single cortical tissue is considered. The significant difference between Study I and Study II is the maximum von-Mises stress values in the cancellous tissues at the starting point. For Study I, its maximum value does not exceed 1.7 MPa, while it exceeds 4 MPa for Study II which is very close to the yield stress of the cancellous tissue. Furthermore, the anisotropy consideration significantly affects the reliability measurements and leads to totally different failure modes. This way the isotropy consideration leads to wrong evaluation of reliability levels. It is mandatory to introduce the bone anisotropy starting from the first simulation.
The main difference between this work and the previous one (Kharmanda et al. 2019) is to study a more complex clinical case of angular and parasymphysis fractures. The reliability index is largely reduced which means that the failure probability is highly increased. The selection of the standard deviations to be proportional to the mean point by 50% increases the confidence level in the study. In order to control the reliability level, it is recommended to use the reliability-based design optimization to find the suitable bite force which corresponds a required (target) reliability level. The resulting bite force should be recommended to the patient since the healed mandible capacity cannot operate as an un-fractured mandible. There are some limitations of the present study. One important limitation is the material law for the bone, which is considered here as time independent. Recently, Kharmanda et al. (2020), proposed new optimized anisotropic bone formulations. The anisotropy is represented by
© 2020 ISTE OpenScience – Published by ISTE Ltd. London, UK – openscience.fr Page | 13
transversal isotropic behavior which can be found in long bones such as tibia and femur where the material properties in both radial and tangential directions are almost similar. So, in the future work, mandibular studies (orthotropic behavior) can be performed to find experimentally the yield stresses in the three directions.
Parameters SP MPP S.F.M M.F.M. 7II( )i H u H10II( )ui H11II( )ui H12II( )ui 5II( )i H u & 10II( )i H u Metal RightUpper max 106.27 92.29 68.44 120.25 79.03 124.07 RightLower max 71.33 50.11 61.14 68.5 58.02 86.02 Left max 51.45 26.49 37.29 24.61 34.56 51.22 Sym. Bone ont SymRightFr max 44.00 56.28 47.67 57.87 30.54 69.26 nt SymLeftFro max 43.19 53.80 65.33 82.73 31.88 94.86 k SymLeftBac max 42.19 22.96 48.05 34.10 34.98 51.39 Ram. Bone RamRight max 77.15 94.89 43.25 68.21 64.78 70.18 RamLeft max 75.91 74.32 44.05 16.34 67.41 53.22 Can. Bone ont CanRightFr max 1.76 1.72 1.20 2.03 1.10 2.38 nt CanLeftFro max 2.40 3.61 4.49 4.28 1.66 4.50 ck CanRightBa max 3.10 3.18 1.67 4.49 2.14 4.50 k CanLeftBac max 4.04 3.40 4.47 2.59 4.50 3.84 --- 3.45 3.28 3.81 2.58 3.60
Table 6. The maximum von-Mises stress values at the SP and the MPPs for Study II
4. Conclusion
Component and system reliability strategies are represented here to evaluate the stability of the mini-plate fixation system used in the human fractured mandibles (considering multiple fracture cases) at the end of the healing period. A clinical case of angular and parasymphysis fractures (a male patient at the age of 35 years) is modeled using 3-dimensional finite element models. Two studies are treated: The first study (Study I), bone tissues are considered isotropic, while in the second study (Study II), they are considered anisotropic (orthotropic). According to the results, at the starting point, a significant difference of maximum von-Mises stresses in the cancellous bone tissues is noted. In addition, the resulting reliability indices are different where failure occurs at totally different locations. This way the bone anisotropy should be considered from the beginning in order to obtain more realistic results.
Conflict of Interests
© 2020 ISTE OpenScience – Published by ISTE Ltd. London, UK – openscience.fr Page | 14
Compliance with Ethical Standards
The patient treatment was done before this research. The research is carried out to evaluate the reliability level of the used mini-plates fixation.
References
Bonnet, A.S.; Postaire, M.; Lipinski, P. (2009): Biomechanical study of mandible bone supporting a four-implant retained bridge: Finite element analysis of the influence of bone anisotropy and foodstuff position, Medical Engineering & Physics, 31, pp 806–815.
Castano, M.C.; Zapata, U.; Pedroza, A.; Jaramillo, J.D.; Roldan, S. (2002): Creation of a three dimensional model of the mandible and the TMJ in vivo by means of the finite element method, Int J Comput Dent,5, pp 87–99.
Colletti, G.; Battista, V.M.A.; Allevi, F.; Giovanditto, F.; Rabbiosi, D.; Biglioli, F. (2014): Extraoral approach to mandibular condylar fractures: our experience with 100 cases. Journal of Cranio-Maxillofacial Surgery, 42(5), e186-e194.
Gross, S.; Abel, E.W. (2001): A finite element analysis of hollow stemmed hip prostheses as a means of reducing stress shielding of the femur, Journal of Biomechanics 34, pp 995–1003.
Hasofer, A.M.; Lind, N.C. (1974): An exact and invariant first order reliability format. J. Eng. Mech, ASCE, EM1, 100, pp 111-121.
Jensen, T.; Jensen, J.; Nørholt, S.E.; Dahl, M.; Lenk-Hansen, L.; Svensson, P. (2006): Open Reduction and Rigid Internal Fixation of Mandibular Condylar Fractures by an Intraoral Approach: A Long-Term Follow-Up Study of 15 Patients, Journal of Oral and Maxillofacial Surgery 64, pp 1771-1779.
Kharmanda, G.; Kharma, M.Y.; Ristinmaa, M.; Wallin, M. (2014): Structural optimization of mini-plates in fixation of human mandible fracture, 27th Nordic Seminar on Computational Mechanics - NSCM-27, (Eds. A. Eriksson, A. Kulachenko, M. Mihaescu and G. Tibert (Eds.) KTH, Stockholm, Sweden; October 22-24, 2014.
Kharmanda G. (2015): Reliability analysis for cementless hip prosthesis using a new optimized formulation of yield stress against elasticity modulus relationship, Materials and Design, 65, pp 496-504.
Kharmanda, G.; Kharma, M.Y. (2016): Evaluating the Effect of Minimizing Screws on Stabilization of Symphysis Mandibular Fracture by 3D Finite Element Analysis, Journal of Maxillofacial and Oral Surgery, 16 (2), pp 205-211. Kharmanda, G.; Ibrahim, M.H.; El-Hami, A. (2016): Reliability analysis of mini-plate stabilization used in human
fractured mandibles, 22d ESB conference, July 10, 2016, Lyon, France.
Kharmanda, G.; Kharma, M.Y.; El-Hami A. (2017a): Integration of reliability concept into orthodontic prosthesis design: Application on mini-plate fixation systems used in fractured mandibles, Journal of Uncertainties and Reliability of Multiphysical Systems, 17-1 (1).
Kharmanda, G.; Shokry, A.; Kharma, M.Y. (2017b): Integration of reliability analysis into mini-plate fixation strategy used in human mandible fractures: Convalescence and healing periods, Acta of Bioengineering and Biomechanics, 19 (4), pp 13-23.
Kharmanda, G.; Kharma, M-Y.; El-Hami, A. (2018): An equivalent isotropic approximation for reliability-based design of mini-plate fixation used in fractured mandibles, Journal of Uncertainties and Reliability of Multiphysical Systems, 18-2 (1).
Kharmanda G.; Kharma, M-Y.; El-Hami, A. (2019): Influence of bone anisotropy on reliability assessment of mini-plate fixation system stabilization in symphysis mandibular fractures: Two studied cases under convalescence period, Journal of Uncertainties and Reliability of Multiphysical Systems, 19-3 (2).
Kharmanda, G.; Gowid, S.; Mahdi, E.; Shokry, A. (2020): Efficient System Reliability-Based Design Optimization Study for Replaced Hip Prosthesis Using New Optimized Anisotropic Bone Formulations, Materials, 13 (2), pp 362.
Korkmaz, H.H. (2007): Evaluation of different mini-plates in fixation of fractured human mandible with the finite element method, Oral Surgery, Oral Medicine, Oral Pathology and Oral Radiology, 103,e1-e13.
Mesnard, M.; Ramos, A.; Ballu, A.; Morlier, J.; Cid, M.; Simoes, J.A. (2011): Biomechanical analysis comparing natural and alloplastic temporomandibular joint replacement using a finite element model, Journal of Oral and Maxillofacial Surgery, 69 (4), pp 1008-1017.
Ogundare, B.O.; Bonnick, A.; Bayley, N. (2003): Pattern of mandibular fractures in an urban major trauma center. Journal of Oral and Maxillofacial Surgery, 61 (6), pp 713–718.
© 2020 ISTE OpenScience – Published by ISTE Ltd. London, UK – openscience.fr Page | 15
Ramos, A.; Marques, H.; Mesnard, M. (2014): The effect of mechanical properties of bone in the mandible, a numerical case study, Advances in Biomechanics and Applications, 1 (1), pp 67-76.
Reina-Romo, E.; Sampietro-Fuentes, A.; Gomez-Benito, M.J.; Dominguez, J.; Doblare, M.; Garcia-Aznar, J.M. (2010): Biomechanical response of a mandible in a patient affected with hemifacial microsomia before and after distraction osteogenesis, Med. Eng. Phys., 32, pp 860-866.
Simsek, S.; Simsek, B.; Abubaker, A.O.; Laskin, D.M. (2007): A comparative study of mandibular fractures in the United States and Turkey. International Journal of Oral and Maxillofacial Surgery, 36 (5), pp 395–397.