HAL Id: hal-02793599
https://hal.inrae.fr/hal-02793599
Submitted on 5 Jun 2020HAL is a multi-disciplinary open access archive for the deposit and dissemination of sci-entific research documents, whether they are pub-lished or not. The documents may come from teaching and research institutions in France or abroad, or from public or private research centers.
L’archive ouverte pluridisciplinaire HAL, est destinée au dépôt et à la diffusion de documents scientifiques de niveau recherche, publiés ou non, émanant des établissements d’enseignement et de recherche français ou étrangers, des laboratoires publics ou privés.
Typologies of pig farming systems in Mai Son district,
Son La province
- Le Thi Thanh Huyen, Nathalie Hostiou, Samir Messad, Sylvie Cournut,
Guillaume Duteurtre
To cite this version:
- Le Thi Thanh Huyen, Nathalie Hostiou, Samir Messad, Sylvie Cournut, Guillaume Duteurtre. Ty-pologies of pig farming systems in Mai Son district, Son La province. [Contract] 2014. �hal-02793599�
The REVALTER Project
“Multi-scale assessment of livestock development pathways in Vietnam”
Typologies of pig farming systems
in Mai Son district, Son La province
Le Thi Thanh Huyen,
Nathalie Hostiou, Samir Messad, Sylvie Cournut, Guillaume Duteurtre
Working Document
Presented at the Scientific Committee of the Revalter Project
Tam Dao, October 13 and 14, 2014
1. Context
Livestock is one of the fastest growing agricultural subsectors in developing countries. It shares 33% of agricultural GDP and is quickly increasing. This growth is driven by the rapidly increasing demand for livestock products because of the growth of population, urbanization and income increase (Delgado 2005). Meeting the increases in food demand has profound implications for livestock production systems (Thornton, 2010).
There are many factors affecting the development of livestock production, they are sources of animal breeds and feed, diseases, investment, management skills, processing equipment, storage, marketing and infrastructure (Thomas et al., 2000). All these factors are confounded with the region and production types. Thornton (2010) states that in the future, the increase in livestock production will be characterized by differences between regions and between highly intensive production systems and smallholder and agropastoral systems. Rosegrant et al. (2009) argue that livestock system evolution in the coming decades will inevitably involve in trade-offs between food security, poverty, equity, environmental sustainability and economic development. How the factors of regions and production systems related to the bio-economic performances of livestock production in Vietnam and how evolution occurs in the livestock sector in Vietnam are in the consideration.
Livestock farming systems are changed rapidly in Vietnam due to some transformations at national and local levels:
- Increase of livestock production: over the last 2 decades, agricultural production has been increasing by 5.8% per annum. Livestock has been growing even faster in the recent years, at an average growth rate of 10 %. Between 2000 and 2010, poultry meat and pig meat production more than doubled, and milk production was multiplied by 6.
- Increase of GDP and livestock products consumption: the Vietnamese economy has been growing rapidly over the last decade, leading to the increase of the people’s living standards and higher consumer demand for animal products such as meat, eggs and milk (Huong et al, 2009; Tisdell, 2010).
- Setting up national and local policies by the government to increase production, and to intensify livestock production: the official “livestock development strategy to 2020” defined in May 2008 aims to encourage the rapid increase of animal production to respond to the growing demand (MARD, 2009). This strategy is to focus on promoting intensification and industrialization of the livestock sub-sector through the development of large farms. The negative impacts of this “livestock revolution” are not clearly identified. For example for pig production, the policy mainly focuses on intensification of pig farms in the Red River Delta and areas surrounding large cities (Decision 166/2001/QD-TTg) (Herold et al, 2010). 15 different subsidies to the pig sector with local application were identified in Mai Son district,
such as direct subsidies for the rearing of breeding stock, direct subsidies for the purchase of breeding stock, artificial insemination (Drucker et al, 2006).
- At farm level changes on farm structure are observed with the development of more market oriented farms and large-scale farms. However, in Vietnam, especially in the north, smallholder farms have great share in pig production. Around 80% of the national pig herd was kept on smallholder farms (FAO, 2005; Lapar et al., 2003). Smallholders with less than 5 pigs accounted 83% of pig production in 2006 (Tisdell, 2009). Estimates from ILRI survey show that the employment in smallholder pig production shared 5.5% of the national GDP in 2007 with the added value of about 0.66 USD per kg live weight of output (ILRI, 2011). Pig production contributes 41% of the income of smallholder farmers in northern Vietnam (Le Coqet al., 2002, signed by Lemke et al. (2007)). Pig production plays an important role with the poor. The data of (FAO-PPLPI 2006) shows high pig densities in the regions with high poverty incidence. In the poor north west mountains, the highest share of household income derived from pigs (Epprecht,2005).
- Better access to market has consequences on livestock practices (more commercial feed, less local breed …). For example in pig production in Mai Son, it was observed an increase of commercial feed in industrial and semi-industrial pig farms. In industrial farms, farmers tend to feed using rations consisting only of commercial feeds. In semi-industrial farms, it is composed by maize, roughage, rice barn, broken rice, cassava + commercial feeds. In subsistence farm, feed is based exclusively on local available feeds (maize, roughage, rice barn, broken rice, cassava) (Huyen et al. 2006). Intensification of pig production leads farmers to purchase more commercial feed. In milk production, as in Ba Vi, farms’ changes are observed in animal health (vaccination), in herd feed (commercial feed), and in market orientation (IDP).
- In Vietnam farms are become more specialized and large scale farms are also developed in different regions of the country. Livestock farming systems are more and more diversified but with there is little knowledge about farms’ types (Pham Duy Khanh, 2010; Lairez, 2012). - The different types of livestock farming systems have not the same consequences on farms’ sustainability (economic, social and environmental). For example for milk production: large scale and specialized farms have to deal with some environmental problems (pollution) and economics problems (production cost is higher than in small farms) (Lairez, 2012). However small farms also deals with some problems: workload, pollution, feed self-sufficiency for animals…) (Nguyen Quoc Toan, 2006; Nguyen Khoa Ly, 2007; Pham Duy Khanh, 2010). A survey was carried out in 14 provinces on the structure, performance, efficiency and organization of beef and pig production by MARD in 2008 (following in the Decision of 2922/QĐ-BNN-CN). The survey’s result shows that in Vietnam, pig production is more developed with different production types and systems than cattle production. Commercial
and industrial pig farms have higher performance and economic return than small scale household farms. However, small household farms are more prevalent in all ecological zones and using adapted local breed resources. Cattle production is mainly on smallholder farms and depends on zones in terms of the availability of feed resources. To extend cattle herds, the zone has to be taken in to account. The evolution occurs more clearly in pig production because of increasing in the demand, in breeding and husbandry management. However, more changes are in increase in the herd size.
The present study is one part of the research that was conducted in the frame of the project « Multi-scale assessment of livestock development path ways in Vietnam » (REVALTER). The REVALTER project aims at promoting a new vision of livestock development in Vietnam, a country faced with extremely rapid intensification and industrialization of the sector. In order to build some sustainable scenarios for the future, the project will review the past and current changes that affect environmental, economic and social relationships between livestock breeding, agriculture and rural territories.
2. Aims of the study
In this study, two main questions are addressed:
-Which is the diversity of livestock farming system due to a better access/integration to the market?
- Are some types of livestock farming systems more sustainable than another?
The study aims at categorizing livestock farming systems, and investigating sustainability of livestock farming systems. This allows identifying farming system critical sustainability issues for change.
In the context of this report, the results catch from a survey in Mai Son district, Son La province, one of three sites in the frame of the project REVALTER. Pig farming systems of the district are described. Typological analysis focuses on the link between sustainability charaterisation systems and specialization of farming activities.
3. Study area
Son La Province is located in northwestern Vietnam. The province has a total area of 1.4 Mill ha with 20% agricultural land (increased by 2% compared to the year 2006), and a total population of 1.13 Mill people (Son La Statistical Year Book, 2013). The population includes 12 ethnic groups: Thai (55%), Kinh (18%), H’mong (12%), Muong (8%) and others (7%) (Son La DARD, 1999). The poverty rate in 2012 is 31.90 %, decreases by 6.24% compared to the year 2010. The major agricultural outputs are from crops (accounts for 71.29%) and livestock production (28.2%). Son La province included 1 city and 10 districts. In the total of 204 communes/wards/ town in the province, 67 units are along the National road 6 (accounts
for 32.8%); 61 units are along the Đà river); and 76 units are in the remote border area (37.3%), (Son La Statistical Year Book, 2012).
The research site is the mountainous district Mai Son, Son La province. It is situated between 20o52’ - 21o20’ N and 103o41’ - 104o16’ E, 30 km away from Son La town and 320 km away from Hanoi. Mai Son district is located at the Na San plateau at an altitude of 700 to 800 m a.s.l.. The climate in Mai Son is divided into the rainy season from April to October and the dry season from November to March. The average annual rainfall is 1414 mm. There are 125 rainy days per year. The annual average temperature is 21oC (max. 38oC, min. -5oC) and the average humidity 81% (years 1980 to 2000, Statistic yearbook of Mai Son district, 2000). Mai Son district has a total area of 143,247 ha, including 27.09 % agricultural land (increase by 8% compared to 2002), 43.87% forest land (increase by 25% compared to 2002) and 24.42 % unused land including bare lands and rocks (reduce by 34.5% compared to the year 2002). Mai Son District includes 21 communes and one town (capital Hat Lot) with a total of 456 villages; and 33,311 households. The 22 communes and town of Mai Son are classified into three regions: 15 units are along National Route No. 6, the major economic region with a good communication system and infrastructure facilities; 3 units are along the bank of Da river, and 4 units are the remote and isolated border highland with special difficulties regarding communication and education. The population is 146.6 thousand people (Son La statisticcal year book, 2012). The population density is higher than in the Province (91 hbts/km²) (wikipédia, 2013). The population consists of 27% Kinh, 54% Thai, and the rest are H’mong, Kho Mu, Xinh Mun and Muong. The annual income in 2013 is 1,115 USD/capita/year. Mai Son has 7,095 poor households, accounts for 20.8% of the total households in the district (Report of Mai Son district Huyện Ủy Mai Sơn, 2013).
Main crops of the district include maize (21,158 ha), rice (6,210 ha), sugar cane (3,737 ha), coffee (3,412 ha), tea (78 ha); industrial cassava (3,000 ha); rubber tree (399 ha); root plans (3,552 ha); vegetables and beans (2,116 ha), and fruit trees (Report of Mai Son district People committee, 2013 - Báo cáo của UBND huyện Mai Sơn, 2013).
Table 1: Herd size of major animal species in Mai Son and Son La in 2012 (in thousand heads)
Parameter Son La province Mai Son district
Herd size (n) Herd size (n) % of province
population Buffaloes 156.35 14.00 8.95 Cattle 188.61 18.35 9.73 Pigs # 543.48 66.06 12.16 Chicken 4387.22 687.38 15.67 Horses 16.91 0.97 5.74 Goats 135.68 20.45 15.05 #
without suckling piglets
Source: Son La Statistical year book, 2012
Pig production in Mai Son District is traditionally based on subsistence farms (oriented to home consumption) in villages away from town (Lemke et al, 2007).
It is observed the development of market-oriented farm (industrial or semi-industrial pig production) in villages with better market access. Some local factors also explain the ongoing changes in livestock pig production. Farmers have better access to infrastructure and markets (national road 6), facilitating commercialization of pig products and purchases (feed,). Improved Mong Cai (sows) is imported to Son La. Near town, Mong Cai is the major line, and large White is the major sire breed. In villages far away the town, Ban breed is the major line. Breeding management is more input-intensive near town (semi-industrial and industrial farms) and remains more traditional away from town (Lemke et al, 2006). Pig production is the main production of the Mai Son district. It is characterized by a relative low per-capita-income. It is one of the regions with the highest share of household income derived from pigs. (Lemke et al 2006). Others farmers buy piglets (fattener system).
4. Methods
The method used in this study is stratified random sampling.
4.1. Selection of communes, villages, and farms
From the secondary data and first results of the preliminary survey in Mai Son, it was found that, pig production systems in Mai Son district includes different farm types as following: (few) company farms, family farms with a large scale as registered farms and mainly concentrated in the zone 1; household farms (large; medium; and small scale). Pig production systems can be different in pig breeds (exotic, cross of breeds, improved Mong Cai pigs and local Bản pigs), or in type of pigs kept (fattener/ sow/ or mix of sow and fattener), or in feeding scheme. Among three different economic zones, some of communes in zone 1 and zone 2 have diversified pig farm types or quite develop in pig production from last 5-7 years.
Further, different zones are different in: The access to the market and other services; Farming systems; Geographical condition (lowland/ intermediate/ remote highland); Market and marketing systems; and (Culture-, Socio-) economic condition.
4.1.1. Selection of communes :
Base on given information, for the selection of 2 or 3 communes to cover this large diversity of farming systems with livestock activity, the criteria for commune selection in this study as following:
- Level of livestock activities: communes with identified zone those have quite developed pig production and with the existing of family farms and/or different scales of smallholder farms during the last 5 years.
- Geographic condition: lowland and intermediate highland or highland.
- Access to the market and other services: Distance from the market (and main road). - Farming system: Agro ecological areas - some areas are more based on coffee or maize. After the discussion with the people of Mai Son DARD and Mai Son Veterinary station, a list of communes with identified zone those have diversity in pig production and with the existing of family farms and/or different scales of smallholder farms during the last 5 years was given. With the given criteria and the consultant of Mai Son DARD and veterinary station, two communes namely Hat Lot (zone 1 – lowland) and Chieng Mai (zone 2 – intermediate highland) and additional Hat Lot town were selected for interviews. Large scale farms were select in the whole district, and particularly, in the near town regions where they are mainly allocated.
4.1.2. Selection of the villages :
With the help of the communal veterinarians, village veterinarians and the communal leader who is responsible for communal agricultures, the lists of pig production of all villages with the information on name and address of pig keepers ; number of pigs, in addition, information on breed and type of pigs were obtained. With the consultant of those contact persons, the villages those have one or some concerned pig production systems were suggested for selecting farms.
4.1.3. Selection of farmers for interviews
Selection of the farms with the help of heads of villages and village veterinarians to obtain diversity of pig production systems as mentioned above.
The number of pig per farm is a good criterion to select the farms in a stratified system (large scale farm; family farm; and smallholder farm of each commune). Base on the clarification and amount of samples in the study site of Dong Nai, the identification of Vietnamese
government for a criteria of the farm, and the real situation of the popular scales, location, the distribution of pig farms, and pig breeds in Mai Son, farms were selected for interviews as presented in Table 2. Lists of farmers raising pigs with scale (and breed, type of pigs – sows, fattener might be available) and address were provided by communal and village veterinarians. From the lists, farmers were randomly selected for interviews.
Selected farms for data collection in Mai Son district.
Farm type Identification Location Randomly
selected samples (n) 1. Large scale farm a contracted farm; a company farm; and family farms (from 20 sows or from 100 fatteners - as large scale farms but did not register).
Whole district: mainly distributed in Hat Lot commune; Hat Lot town; and Chieng Mai commune;
and few in Co Noi, Muong Bon and Chieng Mung communes (zone 1)
30
2.
Household farm
With less than 100 pigs Hat Lot commune (zone 1 –
lowland); Chieng Mai comune (zone 2 – intermediate high land); some from Hat Lot town (zone 1 – lowland)
Total of 130
- large With 50-99 pigs Hat Lot commune ;Chieng Mai
comune; some from Hat Lot town
40
- medium With 25-49 pigs Hat Lot commune; Chieng Mai
comune; some from Hat Lot town
40
- small With < 25 pigs - 15 farms from Hat Lot commune
(sows/ fattenners; mainly crosses of exotic pigs) (zone 1)
- 35 from Chieng Mai commune (Bản pigs/ MC/crossbred/exotic pigs; sows/ fattenners) (zone 2)
50
4.2. Data collection
- Collection of secondary information: Secondary data and information on socio-economic and production conditions and animal husbandry in the study region were gathered from the statistical office of Son La and Mai Son district, veterinary station of Mai Son district and via an extensive literature review from different prior studies in Mai Son.
4.2.1. Description of the questionnaire
A structured questionnaire had been developed after the preliminary field trip and prior to fieldwork. A pre-test of this questionnaire was conducted at the beginning of fieldwork in Dong Nai.
The structured questionnaire was used to interview farmers (see detail the questionnaire in appendix 1). It covered the following topics: general household data and socio-economic parameters (family members, laborers, land resources, education status, income sources), crop production, livestock production systems (species, breeds, input and output of animal production), pig production about resource management, husbandry management including breeding/ feeding/ herd/ health management, stable facilities, animals’ performances, input, output, health care, husbandry-related problems, and environmental aspects of husbandry. The parameters providing information and data to identify the indicators in terms of social, environmental and economic issues for evaluating the sustainability in pig production were especially concerned.
4.2.2. Duration of interviews with farmers
Most interviews were conducted in Vietnamese; in rare individual cases in remote villages in Chieng Mai, explanation by a Thai-proficient was required. Interviews conducted had duration of 75 to 90 minutes. During interviews, the interviewers sometimes added casual questions to cheer up the situation and to avoid farmers becoming inattentive.
4.3. Data entry and analysis
Variables selected to create the typology of farms and to identify farm sustainability:
Group Variable Definition of the variable for pigs in Mai Sơn
Natural capital
Total land Land for 50 years + Land for 20 years + Land for > 50 + hired land + other (m2)
Physical capital
N° of animal species Number of animal species (pig + poultry + …)
Pig herd size (scale of production)
Current pig herd size at time of interviews : Small household (1-24 pigs); Medium household (25-49 pigs); Large household (50-99 pigs); Family farm (from 20 sows or from 100 fatteners - as large scale farms but did not register/no certificate); company farm (a contracted farm of CP; a company farm) but analysed seperately.
Reproductive herd (sow + boar)/ total pig size (%) Investment in pig
production
Value of equipment for pig housing (in million VND)
Human capital
Family size Total number of persons in the family (all members living together)
Family labor Total number of persons of the family ? working on the farm (> 15 years old and < 60 years old)
Number of workers with pig production
Total number of persons working with pig production (> 15 years old and < 60 years old) including hired workers Ration of Hired
workers/laborers
Percentage of hired workers in the total of workers/ labour working on the farm (%)
Ration of labors for pig in total labor on the farm
Ration of labors for pig in total labor on the farm (including hire workers) (%)
Off farm activities for family
Social capital Diversity of activities Number of activities on the farm (crops, livestock, off farm…)
Financial capital
Income structure - Share of livestock income per total income (%) - Share of crop income per total income (%) Total income per
1000m2
Total income per 1000m² total land area (million VND)
Total income per labor Total income of the farm per family labor (> 15 years old and < 60 years old) (million VND)
Pig production
Feed self- sufficiency for pig
Months using own feed for pig Pig productivity average weight gain of fatteners
Pig breed Kind of breed ( exotic or local/ crossbreed)
Economic sustainability
Share of income from pig production in the total income
Pig income / total income (%)
Income from pig production per pig
Income from pig per pig (million VND)
Pig income per 1000m2 Income from pig per 1000 m2 total land (million VND) Pig income per family
labor
Income from pig per family labor (million VND) Economic self
sufficiency
Value of credit (million VND)
Social sustainability
Time spending for a pig per day
Time spending for a pig per day (minute) Percentage of time
spending by women for pig
Number of hours per day by women/ Number of total work per day in pig production (%)
Experience with pig production
Number of year with pig production (year) Number of sources for
the formations
Number of sources for the formations in last years
Participating in training course on pig husbandry
Participation in training courses
Environment al
sustainability
N° of crops Number of crops in the farm
Manure treatment Ways of treating pig manure
Chemical products Use of chemical products in cropping Pig density A space (N° of m2 of stable) for a pig Distance to other farm
raising pigs
Distance to other farm raising pigs (m)
Localisation Ethnicity
Types of ethnic group (major group- Kinh or ethnic group of Thai or Muong)
Zone Location identified as zone 1 - low land or zone 2- intermediate highland according to classification of the province and district
The typology analysis was done by applying multiple factor analysis (MFA) using R software. Quantitative data were processed by applying linear model (GLM); log linear model (GENMOD); and Chi-square test using software SAS version 9.3 for the general description of interviewed samples. The description of different types was expressed via Means and
Standard deviations or percentages and the comparison for significant difference of the value within the class from the value of the total population; those were processed by using SPAD software. Qualitative data were summarized and analyzed by synopsis to obtain interpreted results.
5. Results and discussion
5.1. Short description of the interviewed farms
Large household farms and family farms owned more land than small and medium household farms. No differences were found in family size or family labors between farms types (table 2) (for total land holding: R2 = 0.19; DF model = 3; DF error = 154; F = 11.8; P<0.0001; Linear Model GLM).
Table 2: Socio-economic characteristics of investigated farms, by farm type (lsmean ±s.e.)
Socio-economic parameter Small
household farm Medium household farm Large household farm Family farm and company farm Sample size (n) 50 40 40 30
Land holding (ha farm-1) 0.9 ± 0.1a 0.7 ± 0.1a 1.4 ± 0.1b 1.5 ± 0.2b
Family size (n) 4.6 ± 0.1 4.2 ± 0.1 4.4 ± 0.2 4.6 ± 0.2
Family labor* (n) 3.3 ± 0.2 3.1 ± 0.2 3.1 ± 0.2 3.1 ± 0.2
* Family labor: people > 15 years old
LSM in the row with different superscripts differ significantly at P<0.05 (Linear Model GLM)
Annual incomes from different activities were different between farm types. Total family income and livestock income increased with an increase of farm scale. Small and medium household farms had the lowest income from crops. Further, the off farm income was lowest for smallhousehold farm, while no differences between the other larger farms. Further, there were large differences among farms within a farm type for total income and income from livestock (Table 3).
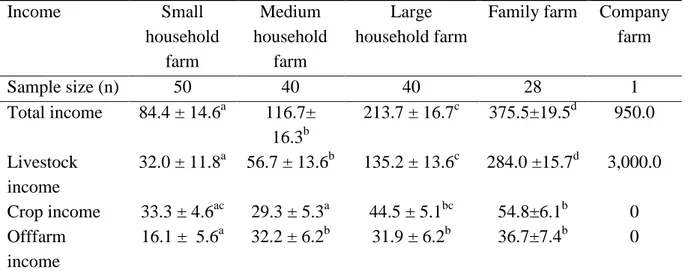
Table 3: Annual income from different activities, by farm type (lsmean ±s.e.) In million VND Income Small household farm Medium household farm Large household farm
Family farm Company
farm Sample size (n) 50 40 40 28 1 Total income 84.4 ± 14.6a 116.7± 16.3b 213.7 ± 16.7c 375.5±19.5d 950.0 Livestock income 32.0 ± 11.8a 56.7 ± 13.6b 135.2 ± 13.6c 284.0 ±15.7d 3,000.0 Crop income 33.3 ± 4.6ac 29.3 ± 5.3a 44.5 ± 5.1bc 54.8±6.1b 0 Offfarm income 16.1 ± 5.6a 32.2 ± 6.2b 31.9 ± 6.2b 36.7±7.4b 0
LSM in the row with different superscripts differ significantly at P<0.05 (Log linear model GENMOD)
The family incomes were different between zones. All kinds of income were higher for farmers in the lowland (table 4).
Table 4: Annual income, by zone (LSM ± s.e.) (in million VND)
Income Lowland Intermediate highland
Sample size (n) 118 40
Total income 210.1 ± 12.6b 74.6 ±21.4a
Livestock income 133.5 ± 10.8b 37.0 ± 7.4a
Crop income 43.8 ± 3.0b 25.0 ± 5.2a
Off farm income 32.8 ± 3.6b 13.3 ± 6.1a
LSM in the row with different superscripts differ significantly at P<0.01 (Log linear model GENMOD)
The ethnicity affects the income from livestock. The Kinh had higher income from animal husbandry than the Thai and Muong (Table 5). This value was similar for the Thai and Muong. There was a high elasticity of income among minority ethnic groups, particularly Muong farmers.
Table 5: Income from livestock production, by ethnic group (LSM ± s.e.) (in million VND)
Income Sample size (n) Income from livestock
Kinh 106 149.9 ±10.5a
Thai 46 21.5 ± 15.9b
Muong 4 19.7 ± 54.1b
Current pig herd size was affected by farm type and ethnicity. It was significant different between farm types for pig herd size. The Kinh owned much larger pig herds than the Thai and Muong. There were large differences among Muong farmers for size of the pig herds (Table 6).
Table 6: Current pig herd, by farm type and by ethnicity (LSM ± s.e.)
Pig herd (n) Sample size (n) Herd size
By farm type
Small household farm 49 8.7±4.2a
Medium household farm 40 28.3±4.6b
Large household farm 40 56.2±4.6c
Family farm 28 103.8±5.5d
By Ethnicity
Kinh 108 57.2±3.8a
Thai 45 11.3±5.8b
Muong 4 5.5±19.6b
LSM of each criteria in the same column with different superscripts differ significantly at P<0.05 (Log linear model GENMOD).
Pig herd size changed after disease outbreak: In the reality, many medium and large household farms and family farms gave up raising pig for sometime after disease outbreak last year. This data compare current herds (after disease outbreak) and annual herd from farms still keep raising pigs: significant different between current pig herd and annual pig herd was found for small household farm (table 7).
Table 7: Pig herd changes after disease outbreak, by farm type (LSM ± s.e.)
Pig herd (n) Annual pig herd (n) Current pig herd (n)
Small household farm 13.2±4.1a 8.6 ± 4.1b
Medium household farm 25.8±4.6 28.3±4.6
Large household farm 56.9±4.6 56.2±4.6
Family farm 117.8±5.5 103.8±5.5
LSM in the row with different superscripts differ significantly at P<0.05 (Log linear model GENMOD)
Frequences of using breeding methods (natural mating or with using AI) were significant different between farm types and zones (Chisquare test). The frequences of applying natural mating decreased with an increase of farm scale; and vice vesur, the use of AI increased with an increase of production scale. Farmers in the lowland mainly used AI method, while those in the intermediate highland applied mainly natural mating for their pigs (Table 8, 9).
Table 8: Frequences of using breeding methods, by farm type
Frequence Small household
farm Medium household farm Large household farm Family farm Sample size (n) 39 35 26 26 Percentage applying only natural mating for pigs (%) 53.9 42.9 11.5 3.9 Percentage applying AI for pigs (%) 46.1 57.1 88.5 96.1 (DF = 3; χ2= 25.0; P<0.0001; Chisquare test)
Table 9: Frequences of using breeding methods, by zone
Frequence Lowland Intermediate highland
Sample size (n) 89 37
Percentage applying only natural mating for pigs (%)
6.7 91.9
Percentage applying AI for pigs (%)
93.3 8.1
(DF = 1; χ2=87.5; P<0.0001; Chisquare test)
Almost pig keepers wanted to increase pig herd or maintain the herd size. Very few farmers wanted to give up pig production. The pig interviewed pig keepers in this study were the people wanted to keep continuously raising pigs. Many farmers who wanted to give up pig production allready let stable empty at time of the interviews (see table 10).
Table 10: Frequencies of the major tendencies in pig production strategies
Strategies Percentage of farms planning (%)
Sample size (n) 154
Maintaining the current system 44.1
Priority of increasing pig production 53.9
Decreasing pig production scale 1.3
Focusing on other activities 0.06
(DF = 3; χ2=66.3; P < 0.0001; Chisquare test).
5.2. The farm typology according to the capital groups
In this part, the description of the two company farms will be presented separately from the household and family farms.
The Typology results for household and family farms based on capital criteria including natural capital, physical capital, human capital, social capital, financial capital and pig production, those are active groups constructing the typologies of the pig farms.
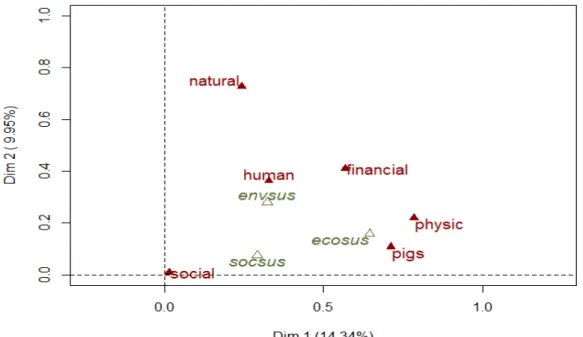
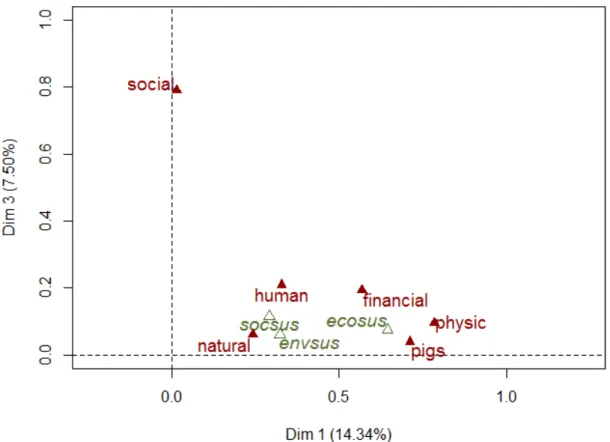
The results show that, there were strong linkage between physical capital, pig production and financial capital and those were significant association with the structure of the farms. The variable group of economical sustainability had a closed relation with the groups of physical capital and pig production. The group of natural capital and social capital also played an important role in the typology of the farm but they were independent from other groups (see figure 1 and 2).
Fig 1. Descriptors’ groups MFA inter-structure (links between capitals; links between ‘capital’ groups and ‘sustainability’ groups (factor 1 & 2).
Fig. 2: Descriptors’ groups MFA inter- structure (links between capitals; links between ‘capital’ groups and ‘sustainability’ groups (factor 1 & 3)
The capital variable groups were strongly affected by the localization variables of zone and ethnicity (see figure 3). There were significant differences on capital variables between the lowland and inter-mediate highland and between the major group of Kinh people and the ethnic group of Thai and Muong. Both company farms located in the lowland and belonged to the Kinh stakeholder.
Fig. 3: MFA factorial map of farmers (Factor 1 & 2). Links between localization and ‘Capital’ typology
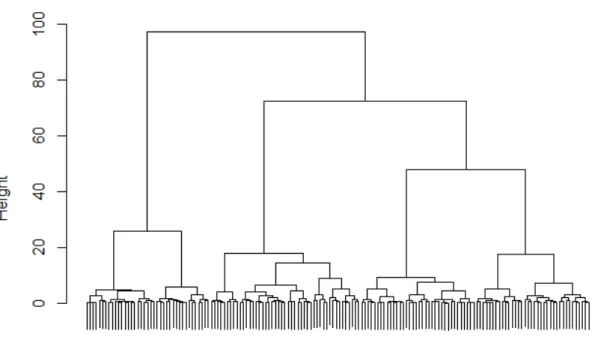
The interviewed farms could be sorted into 4 different types (see figure 4). Type 1(39 farms – small diversified farms with low levels of productivity) is characterized by smallholders with small herd, poorer, mixed farming (several species and crops) but the crop production is more important in the income than pig production of local breed resource, low productivity on land, labor and animals (in link with the breed) and low income, the most autonomous in feed and labor, mainly in the intermediate highlands, belonging to ethnic Thai and Muong. Type 2 (47 farms – small farms with off farm activity, high productivity on land) is characterized by smallholder with medium herd, off farm activity, income from livestock is important, using exotic breed (more intensive), less autonomous in feed, high productivity on land, reduced crop and surface, belonging to Kinh group, both in the lowland and intermediate highland. Tyep 3 (36 farms – specialized farms with large pig herd) is characterized by mainly family farm and medium and large households (large herd size), with a great rate of the pig activity in the income, no off farm activity, high productivity on labor and animal, use of hire workers, using exotic breed, belonging to Kinh people and in the lowland. Type 4 (36 farms – large mixed crop-breed farms) is characterized by mixed crop-breed system, large household farms, investment in equipment for pig breeding, off farm activity, large surface, hire workers, large income, productive on animal, mainly Kinh people in the lowland. The description of these farm types according to capital variables is presented in tables 11 to 14.
Table 11: Description of the typology with ‘capital’ (active variables) criteria
Variables Type 1 Type 2 Type 3 Type 4
n Mean ± sd n Mean ± sd n Mean ± sd n Mean ± sd
Natural capital Total land (m2) 39 9024.4± 2672.3 47 4220.5 ± 3336.0# 36 13472.2 ± 5834.3* 36 17601.7±719 6.8* Physical capital N° of animal species (n) 39 2.7 ±0.9* 47 2.2 ± 0.9 36 2.2±0.7 36 2.2±0.7
Pig herd size (n) 39 9.0 ± 7.7# 47 45.3 ± 51.3 36 60.1 ±53.4* 36 57.5±25.4*
Reproductive herd (%) 39 31.6 ± 34.5* 47 11.7 ± 12.3 36 10.3 ±16.4 36 6.2 ± 6.7#
Investment in pig production (mil.VND) 39 0.2 ± 0.8# 47 19.0 ± 81.9 36 19.1± 42.2 36 18.2±15.2
Human capital
Family size (n) 39 4.9 ± 1.3* 47 4.0 ± 1.2# 36 4.4±0.9 36 4.6±1.1
Family labor (n) 39 3.5 ± 1.2* 47 2.7 ± 1.1# 36 2.8±0.9# 36 3.8±0.9*
Workers with pig production (n) 39 2.1 ± 0.9* 47 1.6 ± 0.7 36 2.0±0.7 36 1.5±0.5#
Ration of Hired workers/labors (%) 39 0.0 ± 0.0# 47 10.0 ± 24.5 36 19.0±23.5* 36 21.4±9.9*
Ration of labors for pig in total labor (%) 39 65.2 ± 29.1* 47 59.3 ± 34.8 36 61.1±29.8 36 34.9±16.7# Social capital
Off farm activities for family (n) 39 0.6 ± 0.6 47 1.0 ± 0.6* 36 0.1±0.3# 36 1.0±0.5*
Diversity of activities (n) 39 2.6 ± 0.5 47 2.7 ± 0.5* 36 2.0±0.2# 36 2.8±0.4*
Financial capital
Total income (million VND) 39 71.4 ± 43.2# 47 169.7±179.1 36 199.4±143.3 36 259.4±119.4*
Share of crop income in total income (%) 39 54.7 ± 17.6* 47 12.3 ± 16.0# 36 25.5±31.9 36 20.4±22.0 Share of livestock income in total income
(%)
39 28.2 ± 17.2# 47 61.1 ± 28.5 36 73.1±32.0* 36 29.0±27.5
Total income per 1000m2 (mil. VND) 39 8.3 ± 5.3# 47 87.2 ±121.5* 36 15.8±11.5 36 17.1±10.8
Total income per labor (mil. VND) 39 21.6 ± 12.3# 47 67.5 ± 73.7 36 80.4±66.4* 36 74.2±39.8
Note: the variables with “*” ; “#” which are statistically different in the class from the whole sample (*: higher; # lower)
Type 1: small diversified farms with low levels of productivity; Type 2: small farms with off farm activity, high productivity on land; Type 3: specialized farms with large pig herd; Type 4: large mixed crop-breed farms
Table 12: Description of the typology with criteria of pig production
Variables type 1 type 2 type 3 type 4
n Mean ± sd n Mean ± sd n Mean ± sd n Mean ± sd
Feed self-
sufficiency for pig (months/year) 34 6.9 ± 4.3* 43 1.1 ± 2.2# 36 1.9±1.7# 33 2.5±1.7 Fattener ration (%) 39 50.4 ± 40.1# 47 78.2 ± 29.2 36 83.1±22.4 36 90.6±11.9* Weight gain (kg/month) 32 10.4 ± 5.8# 46 18.7 ± 4.3 34 20.8±2.6* 36 20.3±2.3* Reproductive sow life (month) 33 59.8 ± 24.3* 39 49.4 ± 17.8 30 43.0±18.1 24 38.7±13.0# Farrowing interval (month) 32 6.5 ± 1.5* 39 5.5 ± 0.5 30 5.5±0.5 24 5.5±0.6 Wean piglet (n/litter) 33 8.7 ± 2.0# 39 10.0 ± 2.0 30 10.2±1.1 24 9.7±1.4 Age at weaning (days) 31 40.3 ± 17.3* 39 28.5 ± 7.4# 29 30.2±5.1 24 28.6±3.9 Weight at weaning (kg) 33 6.0 ± 2.3 39 7.0 ± 1.5 30 9.9±10.5* 24 7.3±1.7
Pig sold (n/year) 39 19.6 ±19.0# 46 101.1 ± 111.5 36 141.8±119.1* 36 132.8±56.5*
Note: the variables with “*” ; “#” which are statistically different in the class from the whole sample (*: higher; # lower)
Type 1: small diversified farms with low levels of productivity; Type 2: small farms with off farm activity, high productivity on land; Type 3: specialized farms with large pig herd; Type 4: large mixed crop-breed farms
Table 13: pig breeds distribution within a type (%)
Breed type 1 type 2 type 3 type 4 Crossbreed 41.0* 4.3 0.0# 0.0# Exotic breed 25.6# 93.6* 100.0* 100.0* Local breed 33.3* 2.1 0.0# 0.0# Note: the variables with “*” or “#” which are statistically different in the class from the whole sample (*: higher; # lower)
Table 14: Description of the typology with localization criteria (%)
Criteria type 1 type 2 type 3 type 4 Zone - Lowland 51.3# 70.2 86.1 94.4* - Intermediate Highland 48.7* 29.8 13.9 5.6# Ethnicity - Kinh 7.7# 80.9* 88.9* 97.2* - Thai or Muong 92.3* 19.1# 11.1# 2.8# Note: the variables with “*” ; “#” which are statistically different in the class from the whole sample (*: higher; # lower)
Type 1: small diversified farms with low levels of productivity; Type 2: small farms with off farm activity, high productivity on land; Type 3: specialized farms with large pig herd; Type 4: large mixed crop-breed farms
The results show that, type 1 with the majority of small household farm had total land area of 6000 to <12000 m2. They keep at least 3 animal species with a small pig herd, average of 9 pigs. Many of them owned sows (and boar), accounts for 32 % of total herd but very high variation between farms. This type does not equip machine for pig house (value of equipment is 0); there are 3-4 family labours; and does not hire labor (hired labor rate of 0). The total income was low, average of 70 million VND/family with low share of livestock income accounting for 28% in the total income; share of income from crop was important accounting for 55 % in the total income. The productivity of this farm type was low with average of 8 million VND/year per 1000m2 and less than 25 million VND/labor/year. Pig production of this type based largely on farm produced feed with time using own feed for pigs was more than 6 months. Pig production using local or cross breeds with low performances: average weight gain of fattener is < 11 kg/month; long time of using sow; late age at weaning piglets; low number of weaned piglets; and long farrowing interval of sows. Nevertheless, the performances of pig production in the current stud are higher than those informed by Hau (2008) in the same study site. Pig commercialization was still low with average of 20 pigs sold per year. The number of marketed pigs in the current study was similar with the average number of pig sold yearly by small scale household farms in Vietnam (6 - 20 slaughter pigs/ year) given by Lapar et al. (2012), but higher than that in the remote Thuan Chau district, Son La province (Huyen et al., forthcoming). These farmers lived mainly in the intermediate highland and belong to ethnic group of Thai or Muong.
Type 2 with mainly medium households had less land compared to others (< 6000m2). They
owned 2 animal species with keeping 25-49 pigs. This type did not equip machine for pig house (0 value). Family size was less than 5 persons and family labours were less than 3 persons; but did not hire labour (0). Labour for pig accounted more than 80% of total labour. There was high diversity of farm and off farm activity. Share of income from livestock was 60 % in the total income. Income from crop was low of 12% of the total income. The productivity was high, with income per 1000m2 average of 87 million vnd, but very high elasticity between farms; income per labour was high with average of 68 million VND/family/ labor/year and also very high variation. Time using own feed was very short about 1 month. Exotic pigs were kept. They were Kinh group and live in both zones.
Type 3 of mainly family farms and numbers of large and medium household farms owned
large land are of ≥ 12000 m2. They owned large pig herds with average of 60 pigs and very
high variation between farms. Labours working for pig production was more than 2 persons; Percentage of hired workers in the total of workers working on the farm was high with 18%. There was no off-farm activity while number of farm activity was more than 2 activities. The share of income from livestock was very high of 73% in the total income and high elasticity between farms. Productivity of production was high for a family labor of 80 million VND/ labor/year with high elasticity between farms. time using own feed for pig was short, about 2
months. Average weight gain of fattener was high with more than 20kg / month. Exotic pigs were kept. This type belonged mainly to Kinh group and located mainly in the lowland. Type 4 with the majority of large household farms owned large land are of more than 12000 m2 ; The average pig herd was about 58 pigs and a bit high variation between farms. They invested equipment for pig houses from1 million up to more than 13 million VND; There were at least 5 family labors. The percentage of hired labor was 21%, and labor for pig accounted less than 40% total labors. There was high diversity of farm and off farm activity. Total income was high and variation between farms (average of about 260 million/family). Income from livestock shared 60% of total income. Share of income from crops was 20% in
the total income. Income per 1000 m2 was 17 million; income per family labor was 74 million
per labor/year. Pig production was mainly fatteners. The level of pig commercialization was high with more than 130 pigs sold per year. Time using own feed for pig was 2,5 months. Average weight gain of fattener was high with more than 20kg/ month. Exotic pigs were mainly kept. This type was mainly Kinh people in the lowland.
Company farms are still quite new and specific in Mai Son town. There were only two company farms in Mai Son district at time of interview. This farm type had closed system with their own boars and sows to produce gilts and piglets for fattening. The current pig herds were 3896 – 5711 heads. These farms kept 11-16 boars; 180 – 350 gilts; and 350 – 1300 sows with 1000 – 2400 piglets. One contracted farms kept 4000 fatteners. Pig productivity was high with 9.8 – 13.8 weaned piglets/litter/sow; 20.8 kg of weight gain per month. Annual pig off-taken was 700 – 30000 pigs; with annual revenue from pig sold was 6600 – 30000 million VND. Total income derived from pig production was 243 – 3000 million VND/year. On company farms, it was mainly run by men. Rent labor for pig production was found mainly on company farm. It can be understood that company could bring opportunity for a number of labor in the society. They used only mainly industrial feed. The total feed purchased was 255,500.0-1,469,930.0 kg, and the total value of 5300.8 million VND, but the contracted farm of CD did not have to pay for feed. The value of credit used for pig production was 5500 – 40000 million VND.
5.3. Description of the types according to sustainable indicators
The figure 5 shows that the association of the sustainability variables was weaker for type 3 and 4 of farms with larger pig herd sizes compared to the types 1 and 2. Type 2 of medium household had close linkage of three sustainability groups (obtaining the same typology if select one of the groups). The economic and environmental sustainability variables have a strong interaction with the typology of type 1 and 3. All three sustainability groups had strong interaction with the type 4.
type 1 type 2
type 3 type 4
Figure 5: Description of four typologies with sustainable criteria
Note: Type 1: small diversified farms with low levels of productivity; Type 2: small farms with off farm activity, high productivity on land; Type 3: specialized farms with large pig herd; Type 4: large mixed crop-breed farms
Tables 15 and 16 describe the different farm types according to the sustainability variables. The economic sustainability was low for type 1 of small households in terms of specialization on pig with low share of income from pig in the total income (average of about 19 %); low pig productivity in pig production of 1.5 million VND/ 1000m2 and only 3.9 million VND/family labor; and little use of credit for pig production. While time spending for a pig during day was long, average of more than 30 minutes. The environmental sustainability was low in terms of more frequently use of chemicals for different crops; high density of pig farms even though low density of pig on the table; and manure treatment was mainly composed or multiple ways but only few farmers applying biogas.
Type 2 of medium households had high productivity in pig production for economic sustainability with high pig income per family labor of more than 50 million VND, but high variation between farms. This type dealt with better environmental issue in terms of less use of chemical for few crops; low density of pig farms and better treatment of manure (applying biogas and a number of compost treatments).
Type 3 of family farm had good economic sustainability variables of large share of income from pig production (nearly 70%, but high variation between farms); high productivity in pig production with average of 57 million VND/family labor/year. The social issue was better in terms of reducing time spending for a pig, i.e. an increase in labor productivity.
Type 4 of large households based on high credit value for pig production. Labor productivity was high with reducing time spending per pig. Farmers of this type participated in more training courses on husbandry compared to other types. This means that the knowledge of farmers was improved and updated and could help them in pig raising practices. However, with high number of crop, many of them use chemical for crops.
Table 15: Description of the typology with sustainable criteria
Variables type 1 type 2 type 3 type 4
n Mean ± sd n Mean ± sd n Mean ± sd n Mean ± sd
Economic sustainability
Share of income from pig production in the total income (%)
39 18.7 ± 14.4# 47 51.3 ± 27.2 36 67.4±34.2* 36 56.2±27.6
Income from pig production per pig (mil. VND)
39 1.0 0.9 46 1.0 ± 0.6 36 0.9±0.6 36 1.1±0.5
Pig income per 1000m2 (mil. VND)
39 1.5 ± 1.6# 47 51.3 ± 98.6* 11.2±10.8 36 9.1±6.9
Pig income per family labor (mil. VND) 39 3.9 ± 3.8# 47 40.8 ± 60.0 36 57.3±58.6* 36 41.4±30.4 Economic self- sufficiency (credit value, mil. VND) 39 16.0 ± 19.1# 47 65.7 ± 125.8 36 83.4±147.1 36 108.3±187.2* Social sustainability
Time spending for a pig per day (minute)
39 31.6 ± 31.6* 46 8.4 ± 7.0 36 5.8± 4.2# 36 4.5±2.5#
Percentage of time spending by women for pig (%)
39 61.7 ± 33.3 46 66.7 ± 48.7 36 56.9±27.2 36 52.9±40.7
Experience with pig production (year)
39 18.9 ± 10.8 47 13.9 ± 9.5 36 13.8±10.8 36 18.4±9.9
Participating in training course on pig husbandry
(course/year)
39 0.7 ± 0.9 47 0.8 ±1.0 36 1.1±1.1 36 1.3±2.3*
N° of crops 39 2.5 ± 0.9* 47 1.4 ± 1.1# 36 2.1±1.1 36 2.5±1.2*
Pig density (m2/pig) 39 5.3 ± 6.1* 47 3.1 ± 2.5 36 3.2±2.5 35 2.5±1.9
Distance to other farm raising pigs (m)
39 28.7 ± 30.2# 47 107.9 ±
113.4*
36 111.3±152.0 36 72.2±90.8
Note: the variables with “*” ; “#” which are statistically different in the class from the whole sample (*: higher; # lower)
Type 1: small diversified farms with low levels of productivity; Type 2: small farms with off farm activity, high productivity on land; Type 3: specialized farms with large pig herd; Type 4: large mixed crop-breed farms
Table 16: Description of the typology with sustainable qualitative variables (%)
Criteria type 1 type 2 type 3 type 4 Number of sources for the formations
- 1 source (%) 15.8 24.4 19.4 13.9 - 2 sources (%) 55.3 37.8 41.7 38.9 - ≥ 3 sources (%) 28.9 37.8 38.9 47.2 Participating in training courses (%) 46.2 42.6 58.3 58.3 Manure treatment - Biogas 2.6 45.7* 30.6 25.0 - Compost 81.6* 41.3 30.6# 44.4 - Multiple ways 15.8# 13.0# 38.8* 30.6* Use of chemical
products for crops
82.1* 42.6# 55.6 66.7
Note: the variables with “*” ; “#” which are statistically different in the class from the whole sample (*: higher; # lower)
Type 1: small diversified farms with low levels of productivity; Type 2: small farms with off farm activity, high productivity on land; Type3: specialized farms with large pig herd; Type 4: large mixed crop-breed farms
6. The conclusions
Pig production in the study site can be sorted into 4 major types and a new company farm type. There is strong association of localization in terms of zones and ethnicity to the typologies of farms. Pig production is more specialized in the lowland zone. Financial capital, physical capital and economic sustainability closely link with pig production. Natural and Social capital had strong effects to the typologies of farms but quite independent from other factors.
The ethnic smallholder farms with diversified activities and based mainly on the available resources in the intermediate highland had low productivity and relied mainly on cropping. Pig production of these farms was at low level of sustainability and quite susceptibility. Farmers with reduced land and crops were more specialized on livestock production with medium pig herd and with off-farm jobs. Even though the social issue of this farm type was not so clear but it was less dependent on credit or location, and better reduced in the
environmental issue than the two other types of larger farms. This farm type might be better adapted to their living conditions for improving their livelihood. The specialized farms with large pig herd seem more sustainable in economic and social issues than the other types but still bear an opening question related to the environmental sustainability. The large mixed crop-breed farms obtained high income but were more dependent on credit than the other types. The environmental issue is also an opening question for this farm type.
7. Next study
In order to actualize the farmer trajectories data in Maison collected in 2013 by Sylvain Haurat in collaboration with CIRAD, INRA and NIAS, and to help their interpretation, a short field study will be conducted by Sylvie Cournut researcher from VetAgroSup (UMR Métafort) and Le Thi Thanh Huyen, researcher from NIAS in beginning of November 2014 focusing on the farm types (2), 3 and 4.
8. References
Delgado, C. 2005 rising demand for meat and milk in developing countries: implications for grasslands-based livestock production. In Grassland: a global resource (ed.D. A. McGilloway), pp. 29–39. The Netherlands: Wageningen Academic Publishers.
Drucker, A.G., Bergeron, E., Lemke, U., Thuy, L.T., Valle Zárate, A., 2006. Identification and qualification of subsidies relevant to the production of local and imported pig breeds in Vietnam. Tropical Animal Health and Production 38, 305-322.
Epprecht, M., 2005. Geographic dimensions of livestock holdings in Vietnam. Spatial relationships among poverty, infrastructure and the environment, (PPLPI Working Paper No. 24; FAO, Rome).
FAO (2005). Livestock Sector Brief: Vietnam, electronic version.http://www.
fao.org/ag/againfo/resources/en/publications/sector_briefs/lsb_VNM. Pdf (retrieved
30/08/2014).
Hau, N.V. (2008). On Farm Performance of Vietnamese Pig Breeds and Its Relation to Candidate Genes. Cuvillier Verlag, Goettingen, Germany.
Herold, P., Roessler, R., Willam, A., Momm, H., Valle Zárate, A., 2010. Breeding and supply chain systems incorporating local pig breeds for small-scale pig producers in Northwest Vietnam. Livestock Science 129, 63-72.
Huong, P.T.M., Hau, N.V., Kaufman, B., Valle Zárate, A., Mergenthaler, M., 2009. Emerging supply chains of indigenous pork and their impacts on smallscale farmers in upland areas of Vietnam. International Association of Agricultural Economists Conference, Beijing, China, p. 19 p.
Huyen, Le Thi Thanh Philipp C. Muth, André Markemann, Kerstin Schöll, Anne Valle Zárate (forth coming) Can a local pig production cooperative group of Thai ethnic farmers in Son La – a mountainous province of Viet Nam – have a stable market for its products?
Huyen Le Thi Thanh, Lemke, U., Thuy, L.T., Valle Zárate, A., 2006. Analysis of animal production systems in H’mong villages of Northern Vietnam. Verlag Ulrich E. Grauer Beuren Stuttgart
International Livestock Research Institute (ILRI). (2011). Pig meat value chain in Vietnam: Background proposals for the CGIAR Research Program on Livestock and Fish. Retrieved on 2 August 2014 at http://cgspace.cgiar.org/handle/10568/3248Lapar, M. L., Binh, V.T. and Ehui, S. (2003). Identifying barriers to entry to livestock input and output markets in South-East Asia. The case of Vietnam, (ILRI, Nairobi, Kenya).
Lemke, U., Kaufman, B., Thuy, L.T., Emrich, K., Valle Zárate, A., 2007. Evaluation of biological and economic efficiency of smallholder pig production systems in North Vietnam. Tropical Animal Health and Production 39, 237-254.
Lemke, U., Kaufman, B., Thuy, L.T., Emrich, K., Valle Zárate, A., 2006. Evaluation of smallholder pig production systems in North Vietnam: pig production management and pig performances. Livestock Science 105, 229-243.
Report of Mai Son district, 2013
Rosegrant, M.W. et al. 2009 Looking into the future for agriculture and AKST (Agricultural Knowledge Science and Technology). In Agriculture at a crossroads (eds B. D. McIntyre, H. R. Herren, J. Wakhungu & R. T. Watson), pp. 307–376. Washington, DC: Island Press.
Son La statistical Year Book, 2012.
Thomas, M; D.X.Tung; L.T.Nho; D.N.Lam; N.T.Thuy and L.T.K.Lan. 2000. Agro-Economic Farm Household and Animal Health Baseline survey in Phu Cat/Tan Phu commune, Quoc Oai district, Ha Tay province. Strengthening of Veterinary Serices in Vietnam, (ALA/96/20). Thornton, P. K. 2010. Livestock production: recent trends, future prospects. Review. Phil. Trans. R. Soc. 365, pp. 2853–2867. doi:10.1098/rstb.2010.0134
Tisdell, C., 2010. An Economic Study of Small Pigholders in Vietnam: Some Insights Gained and the Scope for Further Research. University of Queensland, p. 36.
Tisdell, C. (2009). The survival of small-scale agricultural producers in Asia, particularly Vietnam: general issues illustrated by Vietnam’s agricultural sector, especially its pig production. EconomicTheory, Applications and Issues Working Paper No. 56. The University of Queensland. 21 pp.