HAL Id: hal-01190519
https://hal.archives-ouvertes.fr/hal-01190519
Submitted on 1 Sep 2015
HAL is a multi-disciplinary open access
archive for the deposit and dissemination of
sci-entific research documents, whether they are
pub-lished or not. The documents may come from
teaching and research institutions in France or
abroad, or from public or private research centers.
L’archive ouverte pluridisciplinaire HAL, est
destinée au dépôt et à la diffusion de documents
scientifiques de niveau recherche, publiés ou non,
émanant des établissements d’enseignement et de
recherche français ou étrangers, des laboratoires
publics ou privés.
architecture of host-plant adaptation in two closely
related lepidopteran species
Hermine Alexandre, Sergine Ponsard, Denis Bourguet, Renaud Vitalis,
Philippe Audiot, Sandrine Cros-Arteil, Rejane Streiff
To cite this version:
Hermine Alexandre, Sergine Ponsard, Denis Bourguet, Renaud Vitalis, Philippe Audiot, et al.. When
history repeats itself: Exploring the genetic architecture of host-plant adaptation in two closely
related lepidopteran species. PLoS ONE, Public Library of Science, 2013, 8 (7),
�10.1371/jour-nal.pone.0069211�. �hal-01190519�
Architecture of Host-Plant Adaptation in Two Closely
Related Lepidopteran Species
Hermine Alexandre1,2,3¤a, Sergine Ponsard2,3, Denis Bourguet1, Renaud Vitalis1, Philippe Audiot1,
Sandrine Cros-Arteil1¤b, Re´jane Streiff1*
1 INRA, UMR CBGP (INRA, IRD, CIRAD, Montpellier SupAgro), Montferrier-sur-Lez, France, 2 Universite´ de Toulouse, ENFA, UMR5174 EDB (Laboratoire E´volution & Diversite´ Biologique), Toulouse, France,3 CNRS, Universite´ Paul Sabatier, UMR5174 EDB, Toulouse, France
Abstract
The genus Ostrinia includes two allopatric maize pests across Eurasia, namely the European corn borer (ECB, O. nubilalis) and the Asian corn borer (ACB, O. furnacalis). A third species, the Adzuki bean borer (ABB, O. scapulalis), occurs in sympatry with both the ECB and the ACB. The ABB mostly feeds on native dicots, which probably correspond to the ancestral host plant type for the genus Ostrinia. This situation offers the opportunity to characterize the two presumably independent adaptations or preadaptations to maize that occurred in the ECB and ACB. In the present study, we aimed at deciphering the genetic architecture of these two adaptations to maize, a monocot host plant recently introduced into Eurasia. To this end, we performed a genome scan analysis based on 684 AFLP markers in 12 populations of ECB, ACB and ABB. We detected 2 outlier AFLP loci when comparing French populations of the ECB and ABB, and 9 outliers when comparing Chinese populations of the ACB and ABB. These outliers were different in both countries, and we found no evidence of linkage disequilibrium between any two of them. These results suggest that adaptation or preadaptation to maize relies on a different genetic architecture in the ECB and ACB. However, this conclusion must be considered in light of the constraints inherent to genome scan approaches and of the intricate evolution of adaptation and reproductive isolation in the Ostrinia spp. complex.
Citation: Alexandre H, Ponsard S, Bourguet D, Vitalis R, Audiot P, et al. (2013) When History Repeats Itself: Exploring the Genetic Architecture of Host-Plant Adaptation in Two Closely Related Lepidopteran Species. PLoS ONE 8(7): e69211. doi:10.1371/journal.pone.0069211
Editor: Casper Breuker, Oxford Brookes University, United Kingdom
Received October 29, 2012; Accepted June 11, 2013; Published July 12, 2013
Copyright: ß 2013 Alexandre et al. This is an open-access article distributed under the terms of the Creative Commons Attribution License, which permits unrestricted use, distribution, and reproduction in any medium, provided the original author and source are credited.
Funding: RV acknowledges partial funding from the ANR programme ‘‘EMILE’’ 09-BLAN-0145-01. This work was financially supported by an Action Ponctuelle de Coope´ration grant from Universite´ Toulouse III and an INRA-CIRAD grant ’’SDIPS"" (Mechanisms of Speciation and Molecular Diagnosis of Insect Pest Species Complexes). The Laboratoire Evolution & Diversite´ Biologique is partly supported by project TULIP (ANR -10-LABX-41). The funders had no role in study design, data collection and analysis, decision to publish, or preparation of the manuscript.
Competing Interests: The authors have declared that no competing interests exist. * E-mail: streiff@supagro.inra.fr
¤a Current address: Institut de recherche en biologie ve´ge´tale, De´partement de sciences biologiques, Universite´ de Montre´al, Montre´al, Que´bec, Canada ¤b Current address: INRA, UMR BGPI (INRA, CIRAD), Montpellier, France
Introduction
An intriguing yet unresolved question in evolutionary biology is the degree to which evolution is canalized by intrinsic develop-mental properties [1]. Because we can usually only observe the outcome of evolution and not its path, it is difficult to tell whether independent evolution of the same phenotype reflects historical contingencies or intrinsic constraints [2]. Gould’s metaphor [3] to ‘‘rewind the tape of life’’ illustrates this difficulty: what if, starting from the same initial conditions, we could let evolution happen all over again? Could adaptations to a given ecological change have occurred differently from what they actually did?
‘‘Rerunning the tape of life’’ being… somewhat difficult, an alternative approach is to study naturally occurring cases of repeated adaptations, i.e. adaptations that occurred independently as a response to similar ecological changes. For a long time, evolutionary biologists considered that a trait evolving in closely related lineages (‘parallel evolution’) is likely to rely on the same genetic architecture, whereas a trait evolving in already distant lineages (‘convergent evolution’) is more likely to involve different
genetic architectures. However, recent reviews and discussions [1,4–7] suggest that the phylogenetic distance between two taxa is not necessarily a good predictor of the similarity of the genetic architecture of a trait evolving independently in these taxa. Some case studies showed that the same gene can be involved in similar adaptations in phylogenetically distant taxa (e.g., the MC1R gene involved in color variation in lizards, birds, felids, mice and black bears [5]). In contrast, some populations within species repeatedly adapted to the same environment through changes in different genes or pathways (see, e.g., the various mechanisms involved in the pelvic reduction in ninespine sticklebacks [8]). With the advent of next-generation sequencing technologies, it is now possible to get insight into the genetic architecture of repeated adaptations, regardless of their occurrence in closely or more distantly related taxa.
The evolution of food preference within the large and diverse group of phytophagous insects is an outstanding source of case studies to analyze repeated adaptations. Phytophagous insects evolve in close interaction with their host-plants, and some authors consider the use of a particular host-plant type as a homoplasic
character. For example, in Nymphalini butterflies, different species feed on different plant families, and some specific associations have evolved independently several times [9]. Such repeated adapta-tions are also known in the coleopteran genus Trirhabda, in which four independent host-plant shifts from Asteraceae to Anthemi-deae have been documented [10].
Here, we conducted a comparative analysis of repeated adaptation in phytophagous moths of the genus Ostrinia (Lepidop-tera, Crambidae). Two Ostrinia species have been particularly studied over the last decades because they are major pests of maize (Zea mays L.): Ostrinia nubilalis Hu¨bner sensu [10], the European corn borer (ECB), and Ostrinia furnacalis Gue´ne´e, the Asian corn borer (ACB). These two species are mostly allopatric at Eurasian scale, the ECB occurring in Europe and the ACB in Asia [12]. A third species, Ostrinia scapulalis Walker sensu [12], the Adzuki bean borer (ABB), is largely found in sympatry with both maize-feeding species [11,12]. The major known host plants of the ABB are mugwort (Artemisia vulgaris L.: Asteraceae), hop (Humulus lupulus L.: Cannabaceae) and hemp (Cannabis sativa L.: Cannabaceae), which are all dicots and native to Eurasia, unlike maize.
At least in France, the ECB and ABB do not only differ in host plant use. A large number of behavioral and ecological differences have indeed been documented between these species, most of which can be related either to differences in host plant use and/or to reproductive isolation: oviposition preferences for different host-plants [13–15], better larval survival and growth rates on different host-plants [16], contrasted parasitoid communities [17–19], local differences in sex pheromone blends produced by females and recognized by males [19–21], possibly different sex pheromone blends produced by males and recognized by females [22], slightly shifted phenologies [19,23], and strong assortative mating [13,21,23]. These differences documented in France essentially hold across the former Soviet Union [24]. Although available evidence is scarcer, phenotypic differences related to host plant use and/or reproductive isolation also exist between the ACB and ABB in Asia [25]. Both species are differentiated for oviposition preferences [26–28], larval growth and survival rates on maize-like artificial diet [29], female sex pheromones [25,30] and morpho-logical shape of the male genitalia [12]. Both the ECB and ACB, which have better larval survival and growth rates on maize, as compared to alternative plants, massively infest this crop. Moreover, they are rarely if ever found on the three major ABB host plants, even where the host plants occur in sympatry.
Maize has been domesticated ca. 8,700 years ago in the highlands of Mexico. It then spread across the Americas during the next millennia, and was introduced very recently (ca. 500 years ago) into Europe [31] and almost simultaneously into Asia [32]. The ability to feed on maize most likely evolved twice, independently in the ECB (in Europe) and the ACB (in Asia) from a common dicot feeding ancestor of the ACB, ECB and ABB (see Figure S1–A). This ability to feed on maize is either the direct consequence of an adaptive shift during maize introduction, or the result of a preadaptation in ECB and ACB. Here, we aimed at determining whether this ability to feed on maize of the ACB and ECB relies on the same or different genetic architecture(s) in both species. By genetic architecture, we mean (in the absence of an assembled reference genome) the number of genomic regions presumably involved in the expression of a trait (namely the ability to use maize as a host-plant) and the extent of linkage disequilibrium between them. In the ECB, adaptation to maize seemingly relies on few independent genomic regions [33]. To determine whether the adaptation of the ACB to maize relies on the same or different genetic architecture(s), we used a ‘genome scan’ approach which has been successfully applied in several
organisms to detect signatures of selection on various traits [33– 42]. We analyzed three pairs of sympatric ECB and ABB populations in France (which were previously screened for divergent selection in [33]), and three pairs of sympatric ACB and ABB populations in China. We expected to find the same (or linked) outlier loci in the ECB-ABB and ACB-ABB comparison if the same evolutionary pathway accounts for adaptation to maize or different (and unlinked) outlier loci if two different pathways account for adaptation to the respective host plants.
Since the Ostrinia spp. genome is not sequenced yet, we used non-targeted amplified fragment length polymorphisms (AFLPs). From a total of 684 marker loci, we identified those markers that displayed a pattern of adaptive divergence between pairs of ECB and ABB populations in France, as well as between pairs of ACB and ABB populations in China.
Materials and Methods Ethics statement
No specific permits were required for the described field studies.
Insect samples
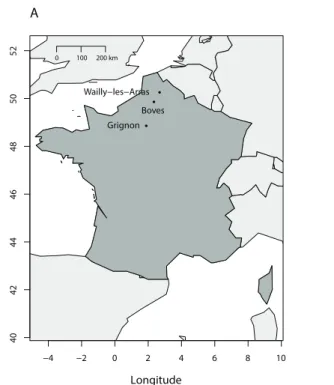
Diapausing Ostrinia spp. larvae were collected from three locations in France (Boves, Grignon and Wailly-les-Arras) and three locations in China (Shanghai, Wuhan and Beijing Academy, Figure 1). In each location, we sampled two populations: one from maize, and one from either hop or mugwort. A total of six pairs of populations were therefore analyzed. Further details are given in Table 1.
AFLP genotyping
The French samples of the present study have already been analyzed in Midamegbe et al. [33]. However, because we used a different molecular ladder in the present study, we could not match with enough confidence the AFLP markers from Mid-amegbe et al.’s [33] study with those from the Chinese populations analyzed here. We therefore produced an entirely new dataset for both Chinese and French populations for the purpose of the present study.
The genomic DNA of each individual was isolated from a piece of the larval body, using either the Qiagen DNEasy Blood and Tissue extraction kit or a standard phenol-chloroform procedure [43]. We then followed the AFLP protocol described in [33] with slight modifications concerning initial DNA amount and PCR characteristics. For each individual, a total of ca. 250 ng DNA was digested. The number of cycles (denaturation, annealing, elonga-tion) was increased to 30 for preselective PCRs. The selective PCRs consisted in a 5-min denaturation at 95uC, followed by 13 cycles of a 30-s denaturation at 94uC, a 1-min hybridization starting at 65uC with a 0.7uC decrement per cycle, and a 2-min elongation at 72uC. These 13 cycles were followed by 27 cycles similar to those of preselective PCRs, and by a final 10-min extension at 72uC. To generate AFLP fragments, we used the same set of 13 primer pairs as in [33].
AFLP products were electrophoresed on an ABI 3130XL (Applied Biosystems) sequencer, together with the Internal Lane Standard 600 ladder (Applied Biosystems). Raw data were analyzed with GENEMAPPERß software version 4.0. Samples were first scored for the presence or absence of any given AFLP band (between 80 and 450 bp) on the basis of the automatic procedure in GENEMAPPERß, with intensity threshold set to 20. Then, all samples were visually corrected for, e.g., overlapping bands, unusual peak shape, or dubious peaks. AFLP loci were chosen and scored on the whole data set without considering the
origin of the samples (host-plant and country), in order to avoid any ascertainment bias in the definition of the final set of AFLP markers.
Genetic diversity and population structure
If any two independent AFLP fragments (corresponding to distinct DNA sequences) have exactly the same length, they may be analyzed as a single locus. Since a typical signature for such homoplasy is a negative correlation between fragment size and frequency, we evaluated the level of homoplasy in our dataset by means of the Pearson’s correlation test implemented in the software AFLP-SURV 1.0 [44]. Allele frequencies were estimated
using Zhivotovsky’s [45] Bayesian method, as implemented in
AFLP-SURV, assuming Hardy-Weinberg equilibrium within each
population and for each locus. Nei’s [46] gene diversity (He) was
computed from these allele frequency estimates, and we used Lynch & Milligan’s method [47] implemented in AFLP-SURV to
measure genetic differentiation between populations (FST).
Clustering analyses based on multilocus genotypes were performed with the Bayesian method implemented in the software packageSTRUCTURE [48]. We used version 2.3.1, which handles
dominant markers such as AFLPs [49]. We varied K, the number of putative clusters, from 1 to 20, and performed 20 independent runs for each value of K. We used the admixture model, with the
Figure 1. Geographic location of samples in France (A) and China (B). doi:10.1371/journal.pone.0069211.g001
Table 1. Details on the Ostrinia spp. samples collected on maize and dicots in France and China.
Host plant type Host species Country Locality Population name Year N PL %PL He(s.e)
Maize Zea mays L. France Boves BOV-M 2006 24 528 77.2 0.260 (0.007)
Grignon GRI-M 2006 24 482 70.5 0.245 (0.006) Wailly-les-Arras WLA-M 2006 24 472 69.0 0.248 (0.007) China Shanghai SHG-M 2006 21 478 69.9 0.238 (0.007) Wuhan WUH-M 2009 23 501 73.2 0.235 (0.007) Beijing Academy ACA-M 2006 19 470 68.7 0.231 (0.007) Dicots Artemisia vulgaris L. France Boves BOV-mu 2006 24 486 71.1 0.248 (0.006) Wailly-les-Arras WLA-mu 2006 24 478 69.9 0.249 (0.007) China Wuhan WUH-mu 2009 21 539 78.8 0.255 (0.006) Humulus lupulus L. France Grignon GRI-ho 2006 24 455 66.5 0.240 (0.007) China Shanghai SHG-ho 2006 22 537 78.5 0.252 (0.006) Beijing Academy ACA-ho 2006 21 521 76.2 0.241 (0.006) N is the number of sampled individuals. PL and % PL indicate the number and percentage of polymorphic loci, respectively. He(s.e.) is the expected heterozygozity and
its standard error (s.e.).
default initial value for a, the hyperparameter of the symmetric Dirichlet distribution for the admixture proportions, and assumed that allele frequencies were correlated across populations, using default priors for the Fkparameters. Each Markov chain was run
for 500,000 steps, after 50,000 steps of burn-in. We characterized the uppermost hierarchical level of clustering using Evanno et al.’s statistic DK [50], which is based on the rate of change in the log probability of the data between successive values of K. We further checked the occurrence of multimodal solutions for a given value of K using the greedy algorithm implemented in the softwareCLUMPP
[51].
Identifying markers involved in host-plant shift and/or in reproductive isolation
We used the software package BAYESCAN[52] to detect AFLP markers that might be involved (or linked to genes involved) in adaptive divergence between host-affiliated Ostrinia species. BAYESCANis based on the Multinomial-Dirichlet model for allele frequencies in an island model of population structure. At each locus, the variance of allele frequency between each subpopulation and the common pool of migrants is given by a subpopulation-specific FSTparameter. In BAYESCAN, as in Beaumont & Balding’s
[53] model, FSTis decomposed into a locus-specific component (ai)
shared by all populations, and a population-specific component (bj)
shared by all loci. Positive or negative values of ai are taken as
evidence for selection. BAYESCAN is based on a reversible-jump Markov chain Monte Carlo (MCMC) algorithm, which provides estimates of the posterior probabilities of two alternative models: one purely neutral (ai= 0) and one including selection (ai?0). For
each locus, Q-values are computed from the posterior probability that the locus is under selection, allowing for the control of false discovery rate (FDR).
We ran BAYESCANversion 2.1 (using default parameter values
and a minimum allelic frequency equal to 0.05) for all possible pairs of populations, within a country, that involved samples collected from distinct host-plant types (inter-host comparisons) as well as for all possible pairs of populations, within a country, that involved the same host-plant type (intra-host comparisons). Following Nosil et al. [37], we considered loci as possible candidates for host-plant adaptation when they were detected as ‘outliers’ – at a given FDR threshold – in at least one inter-host comparison but in none of the intra-host comparisons. This procedure is expected to maximize the chances of detecting selection involved in divergent adaptation to different host-plants, and to minimize those of detecting signatures of selection due to other factors, independent from host-plant adaptation. We examined aiestimates for all outlier loci, and for each inter-host
comparison, as a proxy for the nature and strength of selection: positive aivalues indeed suggest divergent selection while negative
values suggest balancing selection.
Comparison of outlier loci and presumably neutral markers
We performed a hierarchical analysis of molecular variance using the programGDA[54], separately for French and Chinese
samples. We defined three hierarchical levels: (i) among individuals within population, (ii) among populations within host-plant type and (iii) between host-plant types. For comparison, we performed separate analyses on outliers and on presumably neutral markers (i.e., all markers but the outliers).
Linkage disequilibrium analyses
We tested for a possible clustering of outlier loci, as different AFLP markers may be located in the same genomic region. To this end, we calculated the level of linkage disequilibrium (LD): (i) within each French population, between pairs of outlier loci detected in French populations; (ii) within each Chinese population, between pairs of outlier loci detected in Chinese populations; (iii) within each population (Chinese or French), between all pairs of loci consisting in one outlier locus detected in French populations and one outlier locus detected in Chinese populations. The latter analyses were aimed at identifying a potential association between the genomic regions under selection in the ACB and ECB. Since AFLPs are dominant markers, we used Hill’s [55] eq. (17) to compute the maximum likelihood estimate of the pairwise gametic disequilibrium coefficient DAB
between any given pair of loci A and B within each population. The pairwise gametic correlation coefficient between pairs of loci was estimated following Dasmahapatra et al. [56] as: RAB~DAB
. ffiffiffiffiffiffiffiffiffiffiffiffiffiffiffiffiffiffiffiffiffiffiffiffiffiffiffiffiffiffiffiffiffiffiffiffiffiffiffiffiffiffi pApB(1{pA)(1{pB)
p
, where pA and pB are the
frequencies of the dominant alleles at locus A and locus B, respectively, estimated using Zhivotovsky’s [45] Bayesian method.
We developed an original method to test for the significance of gametic correlation coefficients for dominant markers. Hereafter, we refer to the dominant allele (which corresponds to the amplification of one AFLP fragment) by ‘‘+’’ and to the recessive allele (which corresponds to the non-amplification of the AFLP fragment) by ‘‘2’’. With dominant markers, randomizing the ‘‘band absence’’ and ‘‘band presence’’ phenotypes across individ-uals at two loci is not an appropriate way of characterizing the distribution of LD under the null hypothesis of linkage equilib-rium, since the ‘‘band presence’’ phenotype may correspond either to the ‘‘+/+’’ or to the ‘‘+/2’’ genotype. An appropriate test must therefore be based on the randomization of the underlying genotype frequencies. To this end, we used Zhivotovsky’s [45] Bayesian model, but instead of computing the Bayesian estimate of the null-allele (‘‘2’’) frequency analytically from his equation (5), we developed an MCMC strategy to sample from the posterior distribution of the null-allele frequency. The rationale was to account for the unknown distribution of allele frequencies, conditionally to the observed distribution of the ‘‘band absence’’ and ‘‘band presence’’ phenotypes, to compute the distribution of LD under the null hypothesis of random association of genes across loci. For each pair of loci, starting from the null-allele (‘‘2’’) frequencies calculated from Zhivotovsky’s [45] equation (5), each step of the Markov chain consisted in drawing new allele frequencies from a uniform distribution around the current frequencies, within a window of width = 0.15 and with reflecting boundaries at the edges of the interval [0,1]. Each updated allele frequency was accepted according to the appropriate Metropolis ratio derived from the posterior probability given by Zhivotovsky’s [50] equation (2). Then, pseudo allele counts of the ‘‘+’’ and ‘‘2’’ alleles were drawn from a binomial distribution, given the allele frequency and the sample size at each locus. Alleles ‘‘+’’ and ‘‘2’’ were randomly assembled as diploid genotypes, and translated into ‘‘band absence’’ and ‘‘band presence’’ phenotypes. The gametic correlation coefficient was computed as above, following Dasma-hapatra et al. [56], after randomization of the pseudo phenotypes across individuals within a population, for each pair of loci. Each Markov chain was run for 10,000 steps, in order to get the posterior distribution of the pairwise gametic correlation coeffi-cient between pairs of loci under the null hypothesis of random association of genotypes (linkage equilibrium). A P-value for each locus pair within each population was then computed as the
probability of getting values as large or larger than the one observed.
Finally, LD P-values were combined for each of the following categories: populations collected (i) in France on dicots, (ii) in France on maize, (iii) in China on dicots and (iv) in China on maize. To this end, we used the Z-transform method, as advocated by Whitlock [57], implemented in the packageSURVCOMP[58] for
R [59]. The combined P-values were then corrected for the FDR due to multiple testing [60], using the software SGOF+ [61]. Results
Population structure
We analyzed 684 AFLP loci in 271 individuals sampled from 12 Ostrinia spp. populations (6 pairs of populations). The number of AFLP loci per pair of AFLP primers ranged from 35 to 82, with an average of 53. We did not detect any significant correlation between AFLP fragment size and frequency (Pearson r = 20.034, P = 0.392).
A total of 558 markers out of 684 were polymorphic using a minimum allele frequency of 0.05 across the whole dataset (i.e., pooling Chinese and French populations). Among them, 92% were shared between French and Chinese samples. Only 1% of the loci were private to pooled French samples and 7% to pooled Chinese samples (private loci were defined as being nearly fixed in one group, i.e. with the ‘‘+’’ allele frequency being larger than 0.99 or smaller than 0.01, but polymorphic in the other group, i.e. with the both allele frequencies comprised between 0.01 and 0.99). Furthermore, most loci were also shared between host-plants within countries, with only 6%, 7%, 5% and 1.5% of the loci being private to French samples on maize, French samples on dicots, Chinese samples on maize and Chinese samples on dicots, respectively. Nei’s [46] genetic diversity (He) per population
ranged from 0.231 to 0.260 with an average of 0.245 and was homogeneous across populations (ANOVA: F11, 259= 1.268,
P = 0.260).
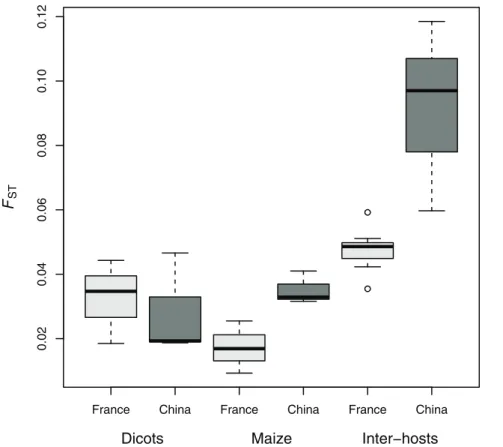
All pairs of populations were significantly differentiated, regardless of host-plant and country (see pairwise FST estimates
provided in Table 2 and represented in Figure 2). The lowest FST
values were observed between populations collected on maize in France (FST ranging from 0.009 to 0.026), while the intra-host
differentiation was a little higher on dicots in France, on dicots in China and on maize in China (Figure 2). The highest differen-tiation levels were observed between samples collected on different host-plant types (inter-host differentiation) in China (FSTranging
from 0.060 to 0.119) and to a lesser extent in France (FSTranging
from 0.036 to 0.059, see Figure 2). The differentiation between Chinese and French populations collected on dicots (inter-countries/intra-host differentiation) ranged from FST= 0.069 to
0.108, and was therefore of the same order of magnitude as the intra-country/host differentiation. As expected, the inter-hosts/inter-countries population pairs were the most differentiat-ed, with FSTestimates ranging from 0.056 to 0.179.
The clustering analysis implemented inSTRUCTUREprovided the
highest average posterior probability of the data (across 20 runs) for K = 7 putative clusters, and the highest value of Evanno et al.’s [50] criterion (DK) for K = 2. For K = 2, one cluster (in blue, Figure 3) included all French samples collected on maize and dicots, and one cluster (in red, Figure 3) corresponded to samples collected on maize in China. All Chinese samples collected on dicots were admixed, with intermediate membership coefficients in these two clusters. This is consistent with the strong divergence between the ACB and ECB, since Pritchard et al. [48] and Fontaine et al. [62] showed that the most divergent groups are
expected to separate first when increasing the number of clusters. For K.2, we observed different clustering results across replicates (Figures 3 and S2), typical of a genuine multimodality [51]. For each value of K.2, we found at least oneSTRUCTUREsolution with
a cluster consisting of all French populations (Figures 3 and S2). This pattern is consistent with the stronger differentiation observed among maize- and among dicot-feeding populations in China as compared to France. For K $ 5, we further found some
STRUCTURE solutions with dicot-feeding individuals clustered in
distinct groups (Figures 3 and S2). This suggests that some dicot-feeding populations are differentiated from one another. In contrast, we did not find any evidence of such structure among samples collected on maize neither in France nor in China, regardless of the putative number of clusters.
In general, most individuals sampled from the same population were assigned to the same cluster (Figure 3), although there were two notable exceptions to this pattern: (i) we found some presumably F0 migrants, i.e. individuals that were collected on a given host-plant type, and assigned to the cluster consisting of individuals collected on the other host-plant type in the same location (e.g., in BOV-M and BOV-mu for K = 7 in Figure 3 and for all values of K in Figure S2 except for K = 5c and K = 7b). These putative migrants were nevertheless kept assigned to the popula-tions they were sampled from, in all subsequent analyses, including BAYESCAN; (ii) some individuals were assigned to a cluster that was
not representative of any of the populations in our data set (green cluster, Figure 3). We compared these results with those obtained using 8 microsatellite loci (data not shown). Four individuals (originating from the WUH-mu Chinese population) showed distinctive genotypes for both the AFLP and the 8 microsatellite loci. Their distinctive genotypes at these independent loci suggested that they might belong to another Ostrinia species, different from the ECB, ACB or ABB. These individuals were therefore discarded from the BAYESCANanalyses. We did not have
such clear distinctive patterns for the individuals with mixed assignation probabilities (green cluster/non-green cluster, Figure 3) in BOV-M, GRI-M, SHG-M and SHG-hop, so that these samples were not discarded.
Identification of markers involved in host-plant shift and/ or in reproductive isolation
Following Foll & Gaggiotti’s [52] recommendations, we identified outlier loci using different FDR threshold values. In France (ECB vs. ABB comparisons), we found 2 outlier loci at the FDR thresholds 0.05 and 0.10. In China (ACB vs. ABB comparisons), we found 6 outlier loci at the 0.05 FDR threshold and 9 at the 0.10 FDR threshold. These outlier loci correspond to markers that were outliers in at least one inter-host comparison, and in none of the intra-host comparisons. All the outlier loci corresponded to polymorphisms shared between countries (i.e., they were not private, according to the above definition). Yet, none of the outliers detected in France were detected as outliers in China, and vice versa. The ai estimates for these 11 loci (2 in
France and 9 in China) were positive in all within-country inter-host comparisons where they were significantly detected as outliers (Table 3). This suggests that these outliers are under divergent selection between maize- and dicot-feeding Ostrinia spp. The average of these aiestimates ranged from 1.14 to 1.79 for the 9
outliers in China, and equalled 1.60 and 1.69 for the 2 outliers in France.
Among French samples, the FST estimates were 0.704 for the
French outliers, and 0.045 for the presumably neutral markers; among Chinese samples, the FSTestimates for the Chinese set of 6
(resp. 9) outliers were 0.678 (resp. 0.631), and 0.102 (resp. 0.098) for the presumably neutral markers. Both in France and China, the largest component of genetic variance was between host-plant types for outlier loci, and between individuals within populations for presumably neutral loci (see Table 4).
We did not find any significant LD (FDR-corrected P-values.0.05), neither between the 2 outliers detected in France, nor between the 36 possible pairs of outliers detected in China. Likewise, we did not find any significant LD between the 18
possible pairs consisting of one outlier detected in France and one detected in China.
Discussion
Comparative analyses of independent occurrences of similar adaptations in closely related taxa can help in disentangling the role of historical contingencies from that of intrinsic constraints in evolution. The genus Ostrinia offers an outstanding situation, because the ability to feed on maize most likely evolved twice
Figure 2. Boxplot of multi-locusFSTestimates for pairwise intra- and inter-host comparisons among French (light grey) and Chinese
(dark grey) populations.
doi:10.1371/journal.pone.0069211.g002
Table 2. Pairwise FSTestimates. Population codes are defined in Table 1.
BOV-M GRI-M WLA-M BOV-mu GRI-ho WLA-mu SHG-M WUH-M ACA-M SHG-ho WUH-mu GRI-M 0.017*** WLA-M 0.009*** 0.026*** BOV-mu 0.036*** 0.050*** 0.049*** GRI-ho 0.051*** 0.049*** 0.059*** 0.044*** WLA-mu 0.042*** 0.045*** 0.047*** 0.019*** 0.035*** SHG-M 0.132*** 0.128*** 0.136*** 0.145*** 0.154*** 0.143*** WUH-M 0.137*** 0.137*** 0.146*** 0.152*** 0.165*** 0.152*** 0.033*** ACA-M 0.068*** 0.151*** 0.165 *** 0.170*** 0.179*** 0.172*** 0.041*** 0.032*** SHG-ho 0.068*** 0.056 *** 0.071*** 0.070*** 0.081*** 0.069*** 0.070*** 0.097*** 0.108*** WUH-mu 0.081*** 0.084*** 0.084*** 0.088*** 0.108*** 0.094*** 0.060*** 0.097*** 0.119*** 0.019* ACA-ho 0.079*** 0.057*** 0.087*** 0.083*** 0.088*** 0.080*** 0.078*** 0.105*** 0.107*** 0.019*** 0.047*** *0.01,P,0.05 and *** P,0.001. doi:10.1371/journal.pone.0069211.t002
independently in the ECB (in Europe) and the ACB (in Asia) (see Figure S1). Whether this ability evolved on maize itself during the colonization of this new host plant, or prior to its introduction into Eurasia (e.g., as an adaptation to another, yet unknown, maize-like host plant) is, to date, unresolved. Indeed, the divergence between the studied taxa most likely preceded the introduction of maize [63,64], which suggests that the genetic changes involved in the initial divergence may have been caused by local adaptation on other host plants. Hence, what we call ‘adaptation’ or ‘preadap-tation’ to maize is the evolution of one or several traits that, compared to the ABB, increase the performance of the ACB and ECB when feeding on maize and/or reduce their performance when developing on the major host plants of the ABB (mugwort,
hemp and hop). Therefore, we do not make any assumption as to the timing or the cause of this adaptation in the present study.
A small number of outlier loci
We detected a small proportion of the genome to be involved in the adaptive divergence between the dicot-feeding and the maize-feeding taxa both in France and in China. This result is in line with those compiled by Matsubayashi et al. [65], who found that the genetic architecture of host preference and performance (two major traits involved in host-plant adaptation) can involve few loci with major effect in various species and orders of phytophagous insects, including Lepidoptera. While Matsubayashi et al.’s review referred to quantitative genetics studies, recent molecular studies on host shifts in Drosophila and aphids carried on this
character-Figure 3. Estimated clustering fromSTRUCTUREanalyses forK= 2 toK= 7. Each individual is represented by a vertical line, divided into up to K coloured segments representing the individual’s estimated fraction of membership of each of the K clusters. Vertical black lines separate samples from different localities and host-plants, as labelled at the bottom of the figure. Host-plant and country are indicated at the top. For each value of K, the most supported clustering solutions, in terms of number of runs out of 20 (number given to the right of the plot) is represented, whereas alternate solutions are given in Figure S2.
Table 3. Estimates of locus-specific effects ai , from B AYE S CAN analyses, for each outlier locus in all the inter-host comparisons where it was detected as an outlier (in China and in
France). China marker
name SHG-M/SHG-ho SHG-M/WUH-mu SHG-M/ WUH-M/SHG-ho WUH-M/WUH-mu WUH-M/ACA-ho ACA-M/ ACA-M/WUH-mu ACA-M/ ACA-ho SGH-ho ACA-ho mean 149 1.35 1 .35 156 1.63 1.54 1.59 208 1.65 1.53 1.59 245 1.62 1.95 1.79 306 1.14 1.14 364 1.68 1.39 1.54 401 1.44 1.47 1 .46 476 1.64 1.64 606 1.45 1.45 France marker name BOV-M/BOV-mu BOV-M/GRI-ho BOV-M/WLA-mu GRI-M/BOV-mu GRI-M/GRI-ho GRI-M/WLA-mu WLA-M/BOV-mu WLA-M/GRI-ho W LA-M/WLA-m u mean 307 1 .65 1 .63 1.67 1.74 1.81 1.65 1.69 554 1.58 1.61 1.60 The average o f ai over all these pairwise comparisons is also provided. T hese values are a p roxy for the nature and strength o f selection: positive ai values suggest d ivergent selection while negative values suggest balancing selection. Population codes are defined in Tableo ˆ1. Marker names are underlined (not underlined) for outliers detected at a 5 % FDR (10%) threshold. doi:10.1371/jo urnal.pone.0069211.t003
ization by identifying two major classes of gene functions underlying host plant adaptation. The first class refer to chemoreceptor genes such as odorant, gustatory receptor genes and genes encoding salivary proteins in the pea aphid, Acyrthosiphon pisum [66,67] or odorant binding protein in Drosophila sechellia [68]. The second class of functions encompasses genes involved in detoxification and metabolism, as shown by population transcriptomics in D. mojavensis [69] and D. sechellia [68]. In Ostrinia, the association between AFLP outliers detected in our study and candidate genes remains to be established. Yet, chemoreceptor genes would appear as relevant candidates since a recent flight tunnel study showed that ECB adults discriminate volatile organic compounds emitted by host plants [70]. In the larval stage, UDP-glucosyltransferase or other UDP-glucose-dependent enzymes might also be good candidates for host plant adaptation since these enzymes are probably involved in the capacity of the ACB to feed on plants, like maize, that contain cyclic hydroxamic acids (cHx) [29].
Different genomic regions under selection in the ACB and ECB?
We found that different and unlinked outliers differentiated ECB from ABB in France, and ACB from ABB in China. Detecting different genomic regions under selection in the ACB and ECB has two major implications. First, it strengthens the hypothesis of two independent adaptation events to maize. Indeed, if there had been only one adaptation event to a maize-like plant followed by a reversion to the ancestral host plant(s) in the ABB (see scenario B in Figure S1), we would expect genes involved in adaptation to be the same in the ECB and ACB, and to find either the same or different, yet linked, outlier loci in the ECB and ACB. Second, it suggests that host plant adaptation in the ECB and ACB have different genetic architectures, and that the ancestral species of the ABB, ACB, and ECB had at least two (and possibly more) potential ways of becoming adapted to maize. Although prelim-inary, this result also opens a series of questions about the underlying mechanisms. If truly independent, did mutations arise on different genes belonging to the same metabolic pathway, or through different mutations/rearrangements of the same target genes? Do the genetic changes conferring adaptation correspond to regulatory or structural mutations? Did adaptation involve duplication events followed by neofunctionalization on different copies in both species? However, alternative interpretations of these results must also be considered, as detailed below.
The limits of genome-scan approaches
Stringency of the statistical methods. As compared with other genome scan studies (which typically report 5–10% of outliers: see [71]), the proportion of outlier loci found in the present study is rather low, both in France (0.29% of outlier loci in ABB vs. ECB comparisons) and in China (0.9% or 1.3% in ABB vs. ACB comparisons, depending on the FDR threshold). In particular, we found fewer outlier loci than in a previous analysis of the same ABB and ECB samples in France (2.3% of outliers using a different set of AFLP markers, see: [33]). One reason for this difference could be that our approach was more stringent in two respects. First, we used BAYESCAN [52] in the present study,
which has been shown to provide a lower false-positive rate (at least in certain conditions, see [72]) than the methods used in Midamegbe et al. [33]: DETSEL[73–75] and FDIST2/DFDIST[76].
Second, we used the FDR correction for multiple testing implemented in BAYESCAN 2.1, which was not applied in Midamegbe et al. [33]. Applying the same methods as in Midamegbe et al. [33] to the French dataset of the present study, we found similar proportions of outliers in both studies (see Table
Table 4. AMOVA results for outlier and neutral markers, with FDR fixed at 5 and 10%, in French and Chinese populations. France (FDR 5% and 10%) China (FDR 5%) China (FDR 10%) outliers (2) neutral (682) outliers (6) neutral (678) outliers (9) neutral (675) Source of variation variance components coancestry coefficients variance components coancestry coefficients variance components coancestry coefficients variance components coancestry coefficients variance components coancestry coefficients variance components coancestry coefficients Between host-types 1.092 0 .704 (0.489–0.869) 8.501 0.045 (0.036– 0.054) 3.072 0.678 (0.521– 0.803) 20.937 0.102 (0.085– 0.119) 4.147 0.631 (0.507– 0.747) 1 9.861 0 .098 (0.081–0.114)
Among populations within
host-types 0.032 0 .720 (0.528–0.866) 8.970 0.092 (0.083– 0.102) 0.153 0.712 (0.599– 0.806) 8.267 0.142 (0.126– 0.159) 0.282 0.674 (0.585– 0.763) 8.137 0 .138 (0.122–0.154) Among individuals within populations 0.435 1 72.185 1.305 175.996 2.142 1 75.158 Coancestry coefficients are computed according to [54]. doi:10.1371/journal.pone. 0069211.t004
S1). This suggests that the more conservative approach adopted in the present study accounts, at least in part, for the lower number of outliers found here, as compared to Midamegbe et al.’s [33] study, and perhaps more generally to the studies reported in Nosil et al. [71].
Finally, our strategy consisted in comparing all possible pairs of populations involving samples collected from distinct host-plant types within one country. However, replicates of inter-host comparison cannot be truly considered as independent. Indeed, since individuals are clustered by host-plant type rather than by geography, based on genome-wide data (see Figure 3), these replicates involve populations that share a common history and/or are connected by gene flow. Therefore, we refrained from giving more weight on outliers detected in multiple inter-host compar-isons. On the opposite, we were very stringent in discarding all the outliers detected in any of the intra-host comparisons. An alternative would have been to compare the pools of all individuals collected on the same host within one country, regardless of population. The limited sample size in each pairwise test is likely to decrease the power of our analyses. However, ignoring the hierarchical structure of the data (geographical structure within host-plant affiliated species) may lead to a high number of false positives [77]. Unfortunately, no method accounting for hierar-chical structure is available to date for biallelic dominant markers such as AFLPs (but see [77,78] for codominant markers).
Limited genome coverage. Hitchhiking reduces variability and enhances differentiation over regions linked to genes under divergent selection, leading to genome-wide variation in the course of divergence, which has been referred to as the ‘‘genetic mosaic of speciation’’ [79]. In non-model organisms, before the advent of next-generation sequencing technologies, most genome scans have been, and often still are, performed with hundreds to thousands of markers, including AFLPs [33,38,40,80,81]. In Ostrinia spp., the genome size is estimated to be ca. 500 Mb [82], covering a haploid number of 31 chromosomes [83]. Under the assumption that the 684 AFLP markers used here are randomly distributed across the genome, we therefore expect that, on average, our markers are separated by ca. 730 Kb. While some studies support the notion that adaptive divergence results from selection acting on small and localized genomic regions (see [84,85] and [86] for an empirical illustration in Heliconius butterflies), others tend to show that genetic signatures of selection can spread over long genomic regions (e.g., in aphids [87], lake whitefish [88] and sticklebacks [89]). Since the limited genome coverage of the present study may have impeded the detection of localized and/or weakly selected regions, we acknowledge that the low number of outliers found here may only represent a small fraction of the genes actually involved in host plant adaptation.
Different levels of shared polymorphism. A third reason why the number of outliers found in the present study might not accurately reflect the number of genes under selection has recently been suggested by Via [87]. Her argument is that, although reduced recombination around a gene targeted by divergent selection may very well spread over genomic blocks as large as several megabases, not every marker locus within a block is expected to be an FST-outlier. Non FST-outliers within these blocks
may indeed correspond to ancestral polymorphism that has not yet significantly diverged in spite of hitchhiking. If Via’s [87] argument holds, we would expect the proportion of detectable outliers to depend on the level of shared ancestral polymorphism. In Ostrinia spp., previous studies have shown that the ABB and ECB diverged recently [64] – more recently than the ABB and ACB [63,90]. This implies that the ABB and ECB may share more ancestral polymorphism than the ABB and ACB. In this case, for a
given number of loci under divergent selection, we would expect the number of detectable outliers to be smaller in the former than in the latter comparison, although it is difficult to quantify the magnitude of the difference to be expected. Hence, the lower number of outliers in the ECB/ABB as compared to the ACB/ ABB comparison (2 versus 9 outliers at the 0.10 FDR threshold) may reveal a genuinely smaller number of loci under selection, but may also result from the higher shared ancestral polymorphism in the ECB/ABB.
Our results further suggest that the genome-wide variability in divergence differs between species pairs, as illustrated by the distribution of FSTestimates (Figure 4). The smaller variance and
higher kurtosis of the ABB vs. ECB FSTdistribution as compared
to the ABB vs. ACB FST distribution may result from the more
recent divergence between the former pair of species. In the earliest stages of divergence, we expect only a limited number of localized regions of the genome to be differentiated, with most of the genomic differentiation distributed around the mean (see, e.g., Figure l in [91]). This would result in a skewed distribution such as that observed in Figure 4 for the ECB vs. ABB comparison. In later stages of divergence, we expect differentiation to spread around the initial localized regions, and eventually to form islands of isolation, which would result in a more scattered distribution, like the one observed in Figure 4 for the ACB vs. ABB comparison. Both the higher ancestral polymorphism shared by the ECB and ABB and their narrower regions of divergence may therefore account for the lower number of outliers detected in this species pair. Importantly, this pattern is expected regardless of the fact that the genes targeted by selection for the adaptation to maize are the same in the ECB and ACB.
Outliers may be related to reproductive isolation rather than adaptation to host plant. We have implicitly assumed so far that adaptation to maize or to an intermediate ‘‘maize-like’’ host plant was the main force driving differentiation between species in each pair. We also implicitly assumed that this adaptation has occurred earlier in the ACB than in the ECB, as suggested (but not demonstrated) by the fact that the ACB and ABB are more differentiated than the ECB and ABB. However, more complex scenarios are possible. For example, in one or both species pairs, divergence may have been initially triggered – and possibly driven for some time – by other factors than host-plant use. If so, adaptation to a new host could have occurred much later. We must therefore keep in mind that, as pointed out by Bierne et al. [92], FST-outliers found in genome scans may result
from reproductive isolation rather than from host plant adapta-tion. In fact, outliers can be involved both in reproductive isolation and in host plant adaptation if ECB and/or ACB diverged trough ecological speciation events [93]. Indeed, in such kind of speciation, divergent selection for host plant adaptation may directly cause reproductive isolation – e.g., genetic differences in the time of emergence timing that ensure a good match with host plant phenology can in turn ensure strong assortative mating. There are numerous candidate mechanisms for reproductive isolation in Ostrinia spp. Roelofs et al. [94] conjectured a plausible scenario of divergence between the ACB and the common ancestor of the ECB and ABB: their scenario assumes that the evolution of a different female sex pheromone in the ACB, coupled with a pre-existing polymorphism in male reception system, enabled certain males to detect and respond to the new pheromone. Differences in sexual communication signals by means of ultrasounds [95] may also be involved. Female pheromone polymorphism also exists within the ECB/ABB species pair, although it is present both within the ECB and within the ABB [20,25,30,82,96], which challenges its possible contribution
to reproductive isolation between the ECB and ABB [21]. Other hypothetical contributors to reproductive isolation include a still elusive ‘‘assortative mating’’ (Am) trait [21], a male pheromone distinct from the female one [22] and temporal isolation [96–98]. Although these traits are unlikely to be directly involved in host plant adaptation, their evolution may have been triggered by reinforcement.
If genome scans were exhaustive, we should therefore detect loci involved in reproductive isolation together with loci involved in host-plant adaptation. However, there is no a priori reason to expect the former to be identical in both species pairs. Hence, shared outliers in both species pairs are better candidates for adaptation to the host-plant than to reproductive isolation – unless reproductive isolation and adaptation to host plant are ensured by the same or tightly linked loci/genomic regions (see above). As genome scans are not exhaustive though, and since none of the outliers we detected was shared between the two pairs of species, we cannot exclude that most, if not all, outlier loci are involved in reproductive isolation.
Conclusion and perspectives
Overall, our results suggest that adaptation to maize has a different genetic architecture in the ACB and ECB. Sequencing the outliers between the ECB and ABB identified in Midamegbe et al. [33], and the new set of outliers identified here, will therefore offer the opportunity to perform a comparative analysis between these two taxa. Analyzing new populations and/or increasing genome coverage in future genome scan studies may also help refining the genetic architecture underlying host-plant adaptation by revealing additional outlier loci and ruling out false positives. Mapping outlier loci along a genome draft could complement our approach based on linkage disequilibrium measures by telling whether some sets of outlier loci are clustered in localized genomic regions. Moreover, such an approach could help identifying
candidate genes, which would inform us on the enzymes or other proteins involved in adaptation to maize. Comparing the divergence of these candidate genes with non-coding regions in different Ostrinia spp. may also help deciphering the putative historical scenarios (Figure S1), and lay the foundations for a better understanding of the evolutionary history of the repeated encounters between maize and its pests-to-be in Asia and Europe.
Supporting Information
Figure S1 Alternative scenarios for the evolution of adaptation or preadaptation to maize in the ECB and ACB, starting from an ancestral species common to the ACB, ECB and ABB.
(PDF)
Figure S2 Estimated clustering from STRUCTURE analyses for
K = 2 to K = 7. Each individual is represented by a vertical line, divided into up to K coloured segments representing the individual’s estimated fraction of membership of each of the K clusters. Vertical black lines separate samples from different localities and host-plants, as labelled at the bottom of the figure. Host-plant and country are indicated at the top. For each value of K, the less supported clustering solutions, in terms of number of runs out of 20 (number given to the right of the plot) are represented, whereas the most supported solution is given in Figure 3.
(EPS)
Table S1 Number of outlier markers detected using methods alternative to BayeScan.
(DOC)
Acknowledgments
We warmly thank Wang Z.-Y. (Chinese Academy of Agricultural Sciences, Beijing, China), Huang Y.-P. (Institute for Ecology and Plant Physiology, Figure 4. Distributions ofFSTestimates between populations sampled on different host plants, across all AFLP markers in France
(A, including all pairs of ECB and ABB populations) and in China (B, including all pairs of ACB and ABB populations). Mean values of the distribution are 0.042 and 0.063, respectively, as indicated by the vertical dashed lines. Both distributions are highly leptokurtic (i.e. with kurtosis.3) and significantly different from one another (Kolmogorov-Smirnov test, D = 0.089, P,1025). Higher kurtosis is observed for the ECB/ABB FSTdistribution (kurtosis = 12.16) than for the ACB/ABB FSTdistribution (kurtosis = 11.46).
Shanghai, China) and Wang Y.-Z. (Botanical Garden Institute, Wuhan, China) for assistance with the sampling in China, and Chaval Y. (CBGP, Montpellier, France) and Malausa T. (IBSV, Sophia Antipolis, France) for assistance with the sampling in France. AFLP data used in this work were (partly) produced through the technical facilities of the Centre Me´diter-rane´en Environnement Biodiversite´.
Author Contributions
Conceived and designed the experiments: SP DB RS. Performed the experiments: HA PA SCA. Analyzed the data: HA RV RS. Contributed reagents/materials/analysis tools: RV. Wrote the paper: HA SP DB RV RS.
References
1. Pearce T (2012) Convergence and parallelism in evolution: a neo-Gouldian account. British Journal for the Philosophy of Science 63: 429–448. 2. Blount ZD, Borland CZ, Lenski RE (2008) Historical contingency and the
evolution of a key innovation in an experimental population of Escherichia coli. Proceedings of the National Academy of Sciences of the United States of America 105: 7899–7906.
3. Gould SJ (1989) Wonderful life. New York: W.W. Norton & Co.
4. Arendt J, Reznick D (2008) Moving beyond phylogenetic assumptions about evolutionary convergence: response to Leander. Trends in Ecology & Evolution 23: 483–484.
5. Arendt J, Reznick D (2008) Convergence and parallelism reconsidered: what have we learned about the genetics of adaptation? Trends in Ecology & Evolution 23: 26–32.
6. Elmer KR, Meyer A (2011) Adaptation in the age of ecological genomics: insights from parallelism and convergence. Trends in Ecology & Evolution 26: 298–306.
7. Leander BS (2008) Different modes of convergent evolution reflect phylogenetic distances: a reply to Arendt and Reznick. Trends in Ecology & Evolution 23: 481–482.
8. Stringham SA, Aldenhoven JT, Tampio AJ, Miller AL, Lunsford AR, et al. (2011) Diverse genetic mechanisms underlie pelvic reduction in ninespine sticklebacks (Pungitius pungitius). Integrative and Comparative Biology 51: E134– E134.
9. Janz N, Nyblom K, Nylin S (2001) Evolutionary dynamics of host-plant specialization: a case study of the tribe Nymphalini. Evolution Int J Org Evolution 55: 783–796.
10. Swigonova Z, Kjer KM (2004) Phylogeny and host-plant association in the leaf beetle genus Trirhabda LeConte (Coleoptera: Chrysomelidae). Molecular Phylogenetics and Evolution 32: 358–374.
11. Frolov AN, Bourguet D, Ponsard S (2007) Reconsidering the taxomony of several Ostrinia species in the light of reproductive isolation: a tale for Ernst Mayr. Biological Journal of the Linnean Society 91: 49–72.
12. Mutuura A, Monroe E (1970) Taxonomy and distribution of the European corn borer and allied species: genus Ostrinia (Lepidoptera: Pyralidae). Memoirs of the Entomological Society of America 71: 1–112.
13. Bethenod MT, Thomas Y, Rousset F, Fre´rot B, Pe´lozuelo L, et al. (2005) Genetic isolation between two sympatric host plant races of the European corn borer, Ostrinia nubilalis Hu¨bner. II: assortative mating and host-plant preferences for oviposition. Heredity 94: 264–270.
14. Bontemps A, Bourguet D, Pe´lozuelo L, Bethenod MT, Ponsard S (2004) Managing evolution of Bacillus thuringiensis resistance in natural populations of the European corn borer, Ostrinia nubilalis: host plant, host race and pherotype of adult males at aggregation sites. Proceedings of the Royal Society Biological Sciences 271: 2179–2185.
15. Malausa T, Pe´lissie´ B, Piveteau V, Pelissier C, Bourguet D, et al. (2008) Differences in oviposition behaviour of two sympatric sibling species of the genus Ostrinia. Bulletin of Entomological Research 98: 193–201.
16. Calcagno V, Thomas Y, Bourguet D (2007) Sympatric host races of the European corn borer: adaptation to host plants and hybrid performance. Journal of Evolutionary Biology 20: 1720–1729.
17. Folcher L, Bourguet D, Thiery D, Pe´lozuelo L, Phalip M, et al. (2011) Changes in parasitoid communities over time and space: a historical case study of the maize pest Ostrinia nubilalis. PLoS ONE 6: e25374.
18. Pe´lissie´ B, Ponsard S, Tokarev YS, Audiot P, Pe´lissier C, et al. (2010) Did the introduction of maize into Europe provide enemy-free space to Ostrinia nubilalis? Parasitism differences between two sibling species of the genus Ostrinia. Journal of Evolutionary Biology 23: 350–361.
19. Thomas Y, Bethenod MT, Pe´lozuelo L, Fre´rot B, Bourguet D (2003) Genetic isolation between two sympatric host-plant races of the European corn borer, Ostrinia nubilalis Hu¨bner. I. sex pheromone, moth emergence timing, and parasitism. Evolution 57: 261–273.
20. Pe´lozuelo L, Malosse C, Genestier G, Guenego H, Fre´rot B (2004) Host-plant specialization in pheromone strains of the European corn borer Ostrinia nubilalis in France. Journal of Chemical Ecology 30: 335–352.
21. Pe´lozuelo L, Meusnier S, Audiot P, Bourguet D, Ponsard S (2007) Assortative mating between European corn borer pheromone races: beyond assortative meeting. PLoS ONE 2: e555.
22. Lassance JM, Lo¨fstedt C (2009) Concerted evolution of male and female display traits in the European corn borer, Ostrinia nubilalis. BMC Biology 7: 10. 23. Malausa T, Bethenod MT, Bontemps A, Bourguet D, Cornuet JM, et al. (2005)
Assortative mating in sympatric host races of the European corn borer. Science 308: 258–260.
24. Frolov AN, Audiot P, Bourguet D, Kononchuk AG, Malysh JM, et al. (2012) "From Russia with lobe": genetic differentiation in trilobed uncus Ostrinia spp. follows food plant, not hairy legs. Heredity 108: 147–156.
25. Ishikawa Y, Takanashi T, Kim C, Hoshizaki S, Tatsuki S, et al. (1999) Ostrinia spp. in Japan: their host plants and sex pheromones. Entomologia Experi-mentalis et Applicata 91: 237–244.
26. Alpuerto VV (1985) Corn borer (Ostrinia furnacalis Guenee) (Lepidoptera:pyr-austidae) damage to different varieties of cotton (Gossypium hirsutum L.) and its ovipositional and feeding preference: University of the Philippines at Los Banos, College, Laguna. 92 p.
27. Lu ZX, Yang ZF, Hu C (1996) Effects of host plants on feeding, development and reproduction of Asian corn borer. Acta Phytophylacica Sinica 23: 126–130. 28. Talekar NS, Chih PL, Yii FY, Ming YL, Yi DW, et al. (1991) Characteristics of infestation by Ostrinia furnacalis (Lepidoptera, Pyralidae) in mungbean. Journal of Economic Entomology 84: 1499–1502.
29. Kojima W, Fujii T, Suwa M, Miyazawa M, Ishikawa Y (2010) Physiological adaptation of the Asian corn borer Ostrinia furnacalis to chemical defenses of its host plant, maize. Journal of Insect Physiology 56: 1349–1355.
30. Ando T, Saito O, Arai K, Takahashi N (1980) (Z)- and (E)-12-tetradecenyl acetates: sex pheromone components of oriental corn borer (Lepidoptera: Pyralidae). Agricultural and Biological Chemistry 44: 2643–2649.
31. Tenaillon MI, Charcosset A (2011) A European perspective on maize history. Comptes Rendus Biologies 334: 221–228.
32. Gay JP (1999) Maı¨s. Biarritz: Atlantica (In French). 619 p.
33. Midamegbe A, Vitalis R, Malausa T, Delava E, Cros-Arteil S, et al. (2011) Scanning the European corn borer (Ostrinia spp.) genome for adaptive divergence between host-affiliated sibling species. Molecular Ecology 20: 1414–1430.
34. Cox K, Broeck AV, Van Calster H, Mergeay J (2011) Temperature-related natural selection in a wind-pollinated tree across regional and continental scales. Molecular Ecology 20: 2724–2738.
35. Fischer MC, Foll M, Excoffier L, Heckel G (2011) Enhanced AFLP genome scans detect local adaptation in high-altitude populations of a small rodent (Microtus arvalis). Molecular Ecology 20: 1450–1462.
36. Holt BG, Coˆte´ IM, Emerson BC (2011) Searching for speciation genes: molecular evidence for selection associated with colour morphotypes in the Caribbean reef fish genus Hypoplectrus. PLoS ONE 6.
37. Nosil P, Egan SR, Funk DJ (2008) Heterogeneous genomic differentiation between walking-stick ecotypes: "Isolation by adaptation" and multiple roles for divergent selection. Evolution 62: 316–336.
38. Nunes VL, Beaumont MA, Butlin RK, Paulo OS (2011) Multiple approaches to detect outliers in a genome scan for selection in ocellated lizards (Lacerta lepida) along an environmental gradient. Molecular Ecology 20: 193–205.
39. Oetjen K, Reusch TBH (2007) Genome scans detect consistent divergent selection among subtidal vs. intertidal populations of the marine angiosperm Zostera marina. Molecular Ecology 16: 5156–5157.
40. Poncet BN, Herrmann D, Gugerli F, Taberlet P, Holderegger R, et al. (2010) Tracking genes of ecological relevance using a genome scan in two independent regional population samples of Arabis alpina. Molecular Ecology 19: 2896–2907. 41. Storz JF (2005) Using genome scans of DNA polymorphism to infer adaptive
population divergence. Molecular Ecology 14: 671–688.
42. Xia HUI, Camus-Kulandaivelu L, Stephan W, Tellier A, Zhang Z (2010) Nucleotide diversity patterns of local adaptation at drought-related candidate genes in wild tomatoes. Molecular Ecology 19: 4144–4154.
43. Sambrook J, Fritsch E, Maniatis T (1989) Molecular Cloning: a Laboratory Manual. New York: Cold Spring Harbor Laboratory Press.
44. Vekemans X, Beauwens T, Lemaire M, Roldan-Ruiz I (2002) Data from amplified fragment length polymorphism (AFLP) markers show indication of size homoplasy and of a relationship between degree of homoplasy and fragment size. Molecular Ecology 11: 139–151.
45. Zhivotovsky LA (1999) Estimating population structure in diploids with multilocus dominant DNA markers. Molecular Ecology 8: 907–913. 46. Nei M (1987) Molecular evolutionary genetics. New, York: Columbia University
Press.
47. Lynch M, Milligan BG (1994) Analysis of population genetic structure with RAPD markers. Molecular Ecology 3: 91–99.
48. Pritchard JK, Stephens M, Donnelly P (2000) Inference of population structure using multilocus genotype data. Genetics 155: 945–959.
49. Falush D, Stephens M, Pritchard JK (2007) Inference of population structure using multilocus genotype data: dominant markers and null alleles. Molecular Ecology Notes 7: 574–578.
50. Evanno G, Regnaut S, Goudet J (2005) Detecting the number of clusters of individuals using the software structure: a simulation study. Molecular Ecology 14: 2611–2620.
51. Jakobsson M, Rosenberg NA (2007) CLUMPP: a cluster matching and permutation program for dealing with label switching and multimodality in analysis of population structure. Bioinformatics 23: 1801–1806.
52. Foll M, Gaggiotti O (2008) A genome scan method to identify selected loci appropriate for both dominant and codominant markers: a bayesian perspective. Genetics 180: 977–993.
53. Beaumont MA (2004) Recent developments in genetic data analysis: what can they tell us about human demographic history? Heredity 92: 365–379. 54. Lewis PO, Zaykin D (2002) Genetic Data Analysis: Computer Program for the
Analysis of Allelic Data. In: http://hydrodictyon.eeb.uconn.edu/people/plewis/ software.php aa, editor.1.1. ed.
55. Hill WG (1974) Estimation of linkage disequilibrium in randomly mating populations. Heredity 33: 229–239.
56. Dasmahapatra KK, Blum MJ, Aiello A, Hackwell S, Davies N, et al. (2002) Inferences from a rapidly moving hybrid zone. Evolution 56: 741–753. 57. Whitlock MC (2005) Combining probability from independent tests: the
weighted Z-method is superior to Fisher’s approach. Journal of Evolutionary Biology 18: 1368–1373.
58. Schroder MS, Culhane AC, Quackenbush J, Haibe-Kains B (2011) survcomp: an R/Bioconductor package for performance assessment and comparison of survival models. Bioinformatics 27: 3206–3208.
59. R Development Core Team (2009) R: A Language and Environment for Statistical Computing; Computing RFfS, editor. Vienna, Austria.
60. Benjamini Y, Hochberg Y (1995) Controlling the false discovery rate - a practical and powerful approach to multiple testing. Journal of the Royal Statistical Society Series B - Methodological 57: 289–300.
61. Carvajal-Rodriguez A, de Una-Alvarez J, Rolan-Alvarez E (2009) A new multitest correction (SGoF) that increases its statistical power when increasing the number of tests. BMC Bioinformatics 10.
62. Fontaine MC, Baird SJE, Piry S, Ray N, Tolley KA, et al. (2007) Rise of oceanographic barriers in continuous populations of a cetacean: the genetic structure of harbour porpoises in Old World waters. Bmc Biology 5. 63. Kim CG, Hoshizaki S, Huang YP, Tatsuki S, Ishikawa Y (1999) Usefulness of
mitochondrial COII gene sequences in examining phylogenetic relationships in the Asian corn borer, Ostrinia furnacalis, and allied species (Lepidoptera : Pyralidae). Applied Entomology and Zoology 34: 405–412.
64. Malausa T, Leniaud L, Martin JF, Audiot P, Bourguet D, et al. (2007) Molecular differentiation at nuclear loci in French host races of the European corn borer (Ostrinia nubilalis). Genetics 176: 2343–2355.
65. Matsubayashi KW, Ohshima I, Nosil P (2010) Ecological speciation in phytophagous insects. Entomologia Experimentalis et Applicata 134: 1–27. 66. Jaquie´ry J, Stoeckel S, Nouhaud P, Mieuzet L, Mahe´o F, et al. (2012) Genome
scans reveal candidate regions involved in the adaptation to host plant in the pea aphid complex. Molecular Ecology 21: 5251–5264.
67. Smadja CM, Canback B, Vitalis R, Gautier M, Ferrari J, et al. (2012) Large-scale candidate gene scan reveals the role of chemoreceptor genes in host plant specialization and speciation in the pea aphid. Evolution 66: 2723–2738. 68. Dworkin I, Jones CD (2009) Genetic changes accompanying the evolution of
host specialization in Drosophila sechellia. Genetics 181: 721–736.
69. Matzkin LM (2012) Population transcriptomics of cactus host shifts in Drosophila mojavensis. Molecular Ecology 21: 2428–2439.
70. Leppik E, Fre´rot B (2012) Volatile organic compounds and host-plant specialization in European corn borer E and Z pheromone races. Chemoecology
22: 119–129.
71. Nosil P, Funk DJ, Ortiz-Barrientos D (2009) Divergent selection and heterogeneous genomic divergence. Molecular Ecology 18: 375–402. 72. Perez-Figueroa A, Garcia-Pereira MJ, Saura M, Rolan-Alvarez E, Caballero A
(2010) Comparing three different methods to detect selective loci using dominant markers. Journal of Evolutionary Biology 23: 2267–2276.
73. Vitalis R (2012) DETSEL: a R-package to detect marker loci responding to selection. Data Production and Analysis in Population Genomics.
74. Vitalis R, Dawson K, Boursot P (2001) Interpretation of variation across marker loci as evidence of selection. Genetics 158: 1811–1823.
75. Vitalis R, Dawson K, Boursot P, Belkhir K (2003) DetSel 1.0: a computer program to detect markers responding to selection. Journal of Heredity 94: 429– 431.
76. Beaumont MA, Nichols RA (1996) Evaluating loci for use in the genetic analysis of population structure. Proceedings of the Royal Society Biological Sciences Series B 263: 1619–1626.
77. Excoffier L, Hofer T, Foll M (2009) Detecting loci under selection in a hierarchically structured population. Heredity 103: 285–298.
78. Gompert Z, Buerkle CA (2011) A hierarchical Bayesian model for next-generation population genomics. Genetics 187: 903–917.
79. Via S, West J (2008) The genetic mosaic suggests a new role for hitchhiking in ecological speciation. Molecular Ecology 17: 4334–4345.
80. Apple JL, Grace T, Joern A, Amand PS, Wisely SM (2010) Comparative genome scan detects host-related divergent selection in the grasshopper Hesperotettix viridis. Molecular Ecology 19: 4012–4028.
81. Scotti-Saintagne C, Mariette S, Porth I, Goicoechea PG, Barreneche T, et al. (2004) Genome scanning for interspecific differentiation between two closely related oak species Quercus robur L. and Q petraea (Matt.) Liebl. Genetics 168: 1615–1626.
82. Dopman EB, Bogdanowicz SM, Harrison RG (2004) Genetic mapping of sexual isolation between E and Z pheromone strains of the European corn borer (Ostrinia nubilalis). Genetics 167: 301–309.
83. Guthrie WD, Dollinger EJ, Stetson JF (1965) Chromosome studies of the European corn borer, smartweed borer, and lotus borer (Pyralidae). Annals of the Entomological Society of America 58: 100–105.
84. Nosil P, Feder JL (2011) Genomic divergence during speciation: causes and consequences. Philosophical Transactions of the Royal Society B: Biological Sciences 367: 332–342.
85. Strasburg JL, Sherman NA, Wright KM, Moyle LC, Willis JH, et al. (2012) What can patterns of differentiation across plant genomes tell us about adaptation and speciation? Philosophical Transactions of the Royal Society B-Biological Sciences 367: 364–373.
86. Nadeau NJ, Whibley A, Jones RT, Davey JW, Dasmahapatra KK, et al. (2011) Genomic islands of divergence in hybridizing Heliconius butterflies identified by large-scale targeted sequencing. Philosophical Transactions of the Royal Society B: Biological Sciences 367: 343–353.
87. Via S (2012) Divergence hitchhiking and the spread of genomic isolation during ecological speciation-with-gene-flow. Philosophical Transactions of the Royal Society B-Biological Sciences 367: 451–460.
88. Renaut S, Maillet N, Normandeau E, Sauvage C, Derome N, et al. (2012) Genome-wide patterns of divergence during speciation: the lake whitefish case study. Philosophical Transactions of the Royal Society B: Biological Sciences 367: 354–363.
89. Hohenlohe PA, Bassham S, Currey M, Cresko WA (2012) Extensive linkage disequilibrium and parallel adaptive divergence across threespine stickleback genomes. Philosophical Transactions of the Royal Society B: Biological Sciences 367: 395–408.
90. Coates BS, Sumerford DV, Hellmich RL, Lewis LC (2005) Partial mitochon-drial genome sequences of Ostrinia nubilalis and Ostrinia furnicalis. International Journal of Biological Sciences 1: 13–18.
91. Wu C-I (2001) The genic view of the process of speciation. Journal of Evolutionary Biology 14: 851–865.
92. Bierne N, Welch J, Loire E, Bonhomme F, David P (2011) The coupling hypothesis: why genome scans may fail to map local adaptation genes. Molecular Ecology 20: 2044–2072.
93. Rundle HD, Nosil P (2005) Ecological speciation. Ecology Letters 8: 336–352. 94. Roelofs WL, Liu W, Hao G, Jiao H, Rooney AP, et al. (2002) Evolution of moth sex pheromones via ancestral genes. Proceedings of the National Academy of Sciences of the United States of America 99: 13621–13626.
95. Takanashi T, Huang YP, Takahasi KR, Hoshizaki S, Tatsuki S, et al. (2005) Genetic analysis and population survey of sex pheromone variation in the adzuki bean borer moth, Ostrinia scapulalis. Biological Journal of the Linnean Society 84: 143–160.
96. Dopman EB, Robbins PS, Seaman A (2009) Components of reproductive isolation between North American pheromone strains of the European corn borer. Evolution 64: 881–902.
97. Karpati Z, Molnar B, Szocs G (2007) Pheromone titer and mating frequency of E- and Z-strains of the European corn borer, Ostrinia nubilalis: fluctuations during scotophase and age dependence. Acta Phytopathologica Entomologica Hungar-ica 10: 331–341.
98. Liebherr J, Roelofs W (1975) Laboratory hybridization and mating period studies using 2 pheromone strains of Ostrinia nubilalis. Annals of the Entomological Society of America 68: 305–309.