HAL Id: hal-02049538
https://hal.archives-ouvertes.fr/hal-02049538
Submitted on 8 Jun 2021
HAL is a multi-disciplinary open access
archive for the deposit and dissemination of
sci-entific research documents, whether they are
pub-lished or not. The documents may come from
teaching and research institutions in France or
abroad, or from public or private research centers.
L’archive ouverte pluridisciplinaire HAL, est
destinée au dépôt et à la diffusion de documents
scientifiques de niveau recherche, publiés ou non,
émanant des établissements d’enseignement et de
recherche français ou étrangers, des laboratoires
publics ou privés.
Distributed under a Creative Commons Attribution - NonCommercial - ShareAlike| 4.0
Phylogenic Assignments using Aeromonas as Test Case
S. Colston, M. Fullmer, L. Beka, B. Lamy, J.P. Gogarten, J. Graf
To cite this version:
S. Colston, M. Fullmer, L. Beka, B. Lamy, J.P. Gogarten, et al.. Bioinformatic Genome Comparisons
for Taxonomic and Phylogenic Assignments using Aeromonas as Test Case. mBio, American Society
for Microbiology, 2014, 18 (5), pp.e02136. �10.1128/mBio.02136-14�. �hal-02049538�
Bioinformatic Genome Comparisons for Taxonomic and Phylogenetic
Assignments Using Aeromonas as a Test Case
Sophie M. Colston,aMatthew S. Fullmer,aLidia Beka,aBrigitte Lamy,b,cJ. Peter Gogarten,aJoerg Grafa
Department of Molecular and Cell Biology, University of Connecticut, Storrs, Connecticut, USAa; Laboratoire de Bactériologie-Virologie, UMR 5119, Equipe Pathogènes et
Environnements, Université Montpellier, Montpellier, Franceb; Laboratoire de Bactériologie, Centre Hospitalier Universitaire de Montpellier, Montpellier, Francec
S.M.C. and M.S.F. contributed equally to this article.
ABSTRACT Prokaryotic taxonomy is the underpinning of microbiology, as it provides a framework for the proper identification and naming of organisms. The “gold standard” of bacterial species delineation is the overall genome similarity determined by DNA-DNA hybridization (DDH), a technically rigorous yet sometimes variable method that may produce inconsistent results. Improvements in next-generation sequencing have resulted in an upsurge of bacterial genome sequences and bioinformatic tools that compare genomic data, such as average nucleotide identity (ANI), correlation of tetranucleotide frequencies, and the genome-to-genome distance calculator, or in silico DDH (isDDH). Here, we evaluate ANI and isDDH in combination with phy-logenetic studies using Aeromonas, a taxonomically challenging genus with many described species and several strains that were reassigned to different species as a test case. We generated improved, high-quality draft genome sequences for 33 Aeromonas strains and combined them with 23 publicly available genomes. ANI and isDDH distances were determined and compared to phylogenies from multilocus sequence analysis of housekeeping genes, ribosomal proteins, and expanded core genes. The ex-panded core phylogenetic analysis suggested relationships between distant Aeromonas clades that were inconsistent with studies using fewer genes. ANI values of >96% and isDDH values of >70% consistently grouped genomes originating from strains of the same species together. Our study confirmed known misidentifications, validated the recent revisions in the nomenclature, and revealed that a number of genomes deposited in GenBank are misnamed. In addition, two strains were identified that may represent novel Aeromonas species.
IMPORTANCEImprovements in DNA sequencing technologies have resulted in the ability to generate large numbers of high-quality draft genomes and led to a dramatic increase in the number of publically available genomes. This has allowed researchers to characterize microorganisms using genome data. Advantages of genome sequence-based classification include data and com-puting programs that can be readily shared, facilitating the standardization of taxonomic methodology and resolving conflicting identifications by providing greater uniformity in an overall analysis. Using Aeromonas as a test case, we compared and validated different approaches. Based on our analyses, we recommend cutoff values for distance measures for identifying species. Accurate species classification is critical not only to obviate the perpetuation of errors in public databases but also to ensure the validity of inferences made on the relationships among species within a genus and proper identification in clinical and veterinary diagnos-tic laboratories.
Received 13 October 2014 Accepted 17 October 2014 Published 18 November 2014
Citation Colston SM, Fullmer M, Beka L, Lamy B, Gogarten JP, Graf J. 2014. Bioinformatic genome comparisons for taxonomic and phylogenetic assignments using Aeromonas
as a test case. mBio 5(6):e02136-14. doi:10.1128/mBio.02136-14.
Editor Edward G. Ruby, University of Wisconsin Madison
Copyright © 2014 Colston et al. This is an open-access article distributed under the terms of theCreative Commons Attribution-Noncommercial-ShareAlike 3.0 Unported
license, which permits unrestricted noncommercial use, distribution, and reproduction in any medium, provided the original author and source are credited.
Address correspondence to J. Peter Gogarten, gogarten@uconn.edu, or Joerg Graf, joerg.graf@uconn.edu. This article is a direct contribution from a Fellow of the American Academy of Microbiology.
R
apid improvements in DNA sequencing technologies are provid-ing new approaches to address prevailprovid-ing questions in the field of microbiology (1–3). For example, next-generation sequencing greatly enhanced the discovery of virulence factors through compar-ative genomics (4), enabled epidemiological studies of recent disease outbreaks (5), led to the discovery of the rare biosphere (6), and pro-vided insights into the physiology of uncultured microbes through metatranscriptomics (7). The increasing amounts of data also brought challenges in ensuring the accuracy of annotations in data-bases (8). Since many analyses are based on comparisons to known sequences, errors in a database can be easily propagated in otherda-tabases and affect subsequent studies. Microbial taxonomy is one area in which the advances in next-generation sequencing have yet to be implemented to their full potential, even though several applications have shown great promise (9, 10). Prokaryotic taxonomy has been traditionally regarded as consisting of three interrelated components: classification, nomenclature, and characterization (11). Only no-menclature is strictly regulated in the International Code of Nomen-clature of Bacteria (12). It is important to reconcile nomenNomen-clature when rigorous classification and characterization methods reveal an inconsistency in the composition of a particular named species.
related organisms together that are distinct from other groups. DNA-DNA hybridization (DDH) is the traditional “gold stan-dard” of circumscribing a bacterial species, as this method pro-vides an assessment of the overall similarity of the heritable mate-rial, with phylogenetic data providing information about neighboring organisms. The current DDH standard for strains to be considered belonging to the same species is thatⱖ70% of the DNA from the two strains reassociates with aⱕ5°C difference in melting temperatures (13). However, laboratory-based DDH measurements are not without challenges, given that DDH values can be difficult to reproduce and therefore may vary, depending on the reannealing temperature used or a laboratory’s particular method employed (14). In addition, the data cannot be archived, nor are they portable between laboratories, and as such the data cannot be readily built upon when describing a new species (15). In contrast to DDH, DNA sequence information can be easily archived and readily transferred between laboratories. Standard-ized bioinformatic analyses on the same data set can be performed by different laboratories, which facilitates collaborations and, po-tentially, the resolution of disagreements (16). Examples of such molecular methods include multilocus sequence analysis (MLSA), which provides important information about the evolu-tionary relationships of bacteria and allows grouping of related strains (14). MLSA has emerged as a powerful tool for classifying bacterial strains, as it relies on the allelic differences among mul-tiple conserved housekeeping genes (17). In MLSA, the sequences are typically concatenated to overcome the lack of resolution seen in the topology of single-gene trees, but this method may mask the different evolutionary processes underlying the individual genes (18, 19). In addition, there is no consensus as to what degree of sequence variation correlates with species boundaries, which is partly due to different genes evolving at different rates and also that a few selected genes represent only a fraction of the vast amount of information contained within an entire genome.
The field of microbiology is undergoing dramatic changes, with more genomes becoming available due to the rapidly im-proving technology and declining cost of sequencing. In addition to closed or finished genomes, “improved” high-quality draft ge-nomes for which the annotations have been validated have been deemed suitable for comparative genomic studies (20). The rela-tive ease of producing such genomes provides new opportunities for assessing taxonomic relationships, discovering new taxa, and sharing data between researchers. As a result, new tools are being developed to make use of these data, including a bioinformatic approach for calculating the DDH. One of these, the genome-to-genome distance calculator, referred to here as in silico DDH (is-DDH), produces values that compare closely with experimentally derived DDH values (9, 21). Another method calculates the aver-age nucleotide identity (ANI) among conserved and shared genes. The use of ANI has been proposed as a new standard for defining microbial species, and it is gaining wide acceptance (16, 22). The most current proposal recommends use of an ANI threshold of 95 to 96% along with support from tetranucleotide frequency corre-lation coefficient values (23, 24). Recently, a few studies combined either MLSA or the analysis of genes common to all members of a genus (core genome) with the overall similarity of the genome by using ANI for species identification (15, 25). We wanted to com-pare isDDH and ANI for species identification combined with phylogenetic approaches, using a genus with a complicated but relatively well-described phylogeny.
The genus Aeromonas makes for an ideal test case, because it contains a large number of species, biovars, and subspecies and its taxonomy has been the subject of much debate (26). Collectively,
Aeromonas members are found in a number of habitats and in
association with various animals, ranging from beneficial symbi-onts of leeches and zebrafish to pathogens of amphibians, fish, and humans (26, 27). Fourteen species of Aeromonas were recognized in the latest addition of Bergey’s Manual of Systematic Bacteriology in 2005 (28). Since then, over a dozen have been propose, while the statuses of five species and two subspecies have been called into question. An accurate taxonomy for this genus is not only critical as a tool to differentiate benign from potentially virulent species, but it is also essential as the foundation for ecological studies.
A number of taxonomic controversies exist within the
Aeromo-nas genus, namely, the synonymity of the following groups: the
proposed novel species A. culicicola and A. ichthiosmia with A.
ve-ronii (29–31), A. enteropelogenes with A. trota (31–34), A. allosac-charophila with A. veronii (30), A. hydrophila subsp. anaerogenes
with A. caviae (28, 35), and A. hydrophila subsp. dhakensis with
A. aquariorum, which ultimately led to a proposal of a new species, A. dhakensis (36–38), All of these controversies are likely due, at
least in part, to the limitations of past and current methods to consistently distinguish to the species level. Some of these contro-versies (e.g., whether the taxon A. allosaccharophila reaches the species level) could not even be unambiguously clarified with the most recent methods, with several MLSA schemes with partial sequences of up to seven housekeeping genes (33, 34, 39–41). A finding of some of these studies and of a study investigating dis-crepancies in the analysis of 16S rRNA genes (42, 43) was that recombination occur frequently between members of this genus, which renders phylogenies with single or a few genes challenging. The use of whole genome sequences has been regarded as a promising avenue for the future of Aeromonas taxonomic and phylogenetic studies (41). In the present study, we generated im-proved, high-quality draft genome sequences from 27 type strains and 6 additional strains. These genomes were supplemented by 23 additional genomes of Aeromonas strains available in public data-bases. Our approach was to determine the phylogeny in three ways, by using (i) 16 housekeeping genes that were used in four recent MLSA classifications (HK), (ii) ribosomal protein coding gene (RG), and (iii) the expanded core (EC), which are the genes present in at least 90% of the 56 strains. In addition, we performed ANI analysis and isDDH (9, 16, 21, 22) to determine the overall similarity of the genomes. We examined our data with regard to the above-mentioned taxonomic controversies, as these provided the means to validate our approach. We also investigated the re-lationships of deeper phylogenetic branches in the Aeromonas ge-nus. This approach led to the identification of candidate novel species and is presented as a methodology that may be applied to other genera as well.
RESULTS
Genome sequences. A total of 56 Aeromonas genomes were used
in this study, representing type strains of 29 currently recognized or proposed species, of which 27 were sequenced in-house and 2 were available in GenBank. The additional 23 genomes were non-type strains and auxiliary strains of interest. For seven of the
Aero-monas species, multiple strains were used in this study, and strain
designations were employed to distinguish among them (A.
A. salmonicida, and A. veronii); for the remainder of the species,
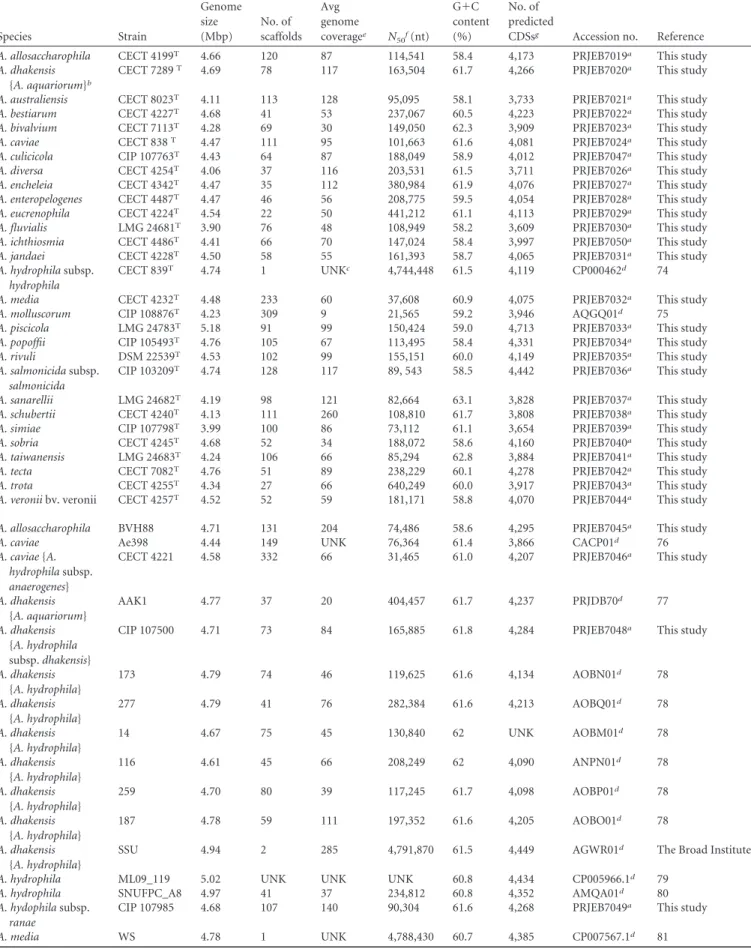
only the type strain was used, which is indicated by a superscript T. For the 33 genomes obtained for this study, the average genome coverage ranged from 30- to 260-fold and the number of scaffolds ranged from 22 to 332 with an average of 88 (Table 1). The com-pleteness of the genomes was assessed by screening the genomes for 16 housekeeping genes and 47 ribosomal protein-coding genes. All 63 genes were present in the 56 genomes. The genome sizes estimated from the draft genomes generated for this study ranged from 3.90 Mbp (A. fluvialisT) to 5.18 Mbp (A. piscicolaT),
with an average of 4.51 Mbp. The average G⫹C content of the aeromonads ranged from 58.1% (A. australiensisT) to 62.8%
(A. taiwanensisT), with a mean of 60.2%. Based on the quality of
the genomes and verification of the automated annotation, we consider these genomes to be improved, high-quality draft ge-nomes (20).
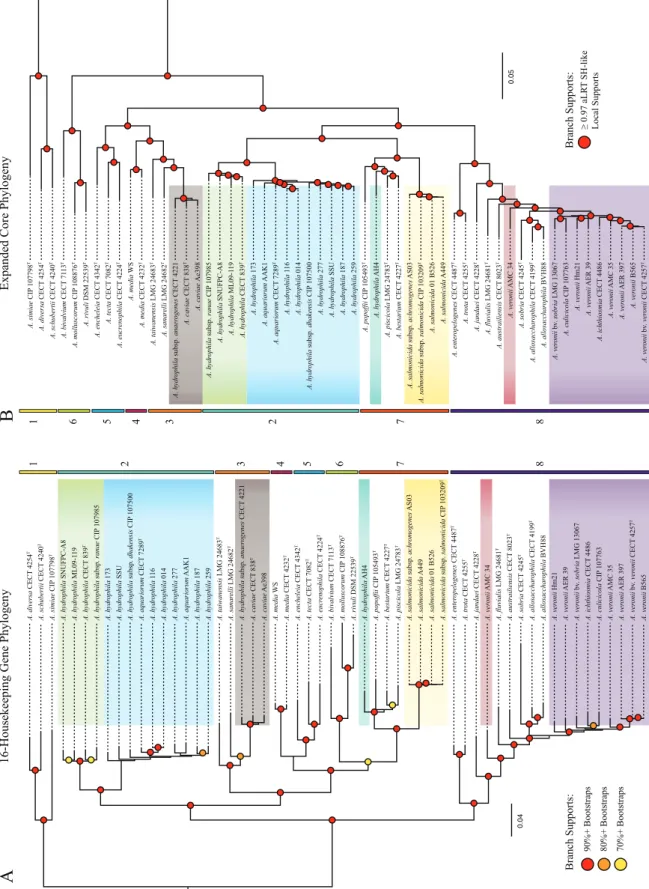
Phylogenetic analysis. One goal of our study was to
reeval-uate the phylogenetic relationships of the Aeromonas species by using three phylogenies, HK, RP, and EC, derived from differ-ent sets of genes: 16 housekeeping genes, 47 ribosomal protein-coding genes, and the expanded core, which included 2,710 ortholog groups (OG), respectively. Due to the differences in the number of informative sites, the EC phylogeny had the strongest support values for all of the nodes, although both the HK and EC phylogenies provided new insights into the rela-tionships of distant clades (Fig. 1). The RP phylogeny had the lowest support values, as these genes are more conserved (see Fig. S1 in the supplemental material). In both the HK and EC phylogenies, we found the same eight major monophyletic groups, or clades, which are defined as groups of taxa in a phylogeny that each share an ancestor, to the exclusion of all other taxa included in the analysis (Fig. 1). Interestingly, we found several differences between the HK and EC phylogenies. In the HK phylogeny, clades 6 and 7 represent shallow branches that are nested within larger groups formed by clades 2 to 7, 3 to 7, and 4 to 7; however, in the EC phylogeny, clade 6 is basal to the large clade containing clades 2 to 5, 7, and 8. Moreover, in the EC phylogeny, clades 2 and 7 form one clade, while clades 3 to 5 form another clade, which is also inconsistent with the HK phylogeny where clade 7 forms a clade with 6 that is nested within a large grouping containing clades 3 to 7. As the ex-panded core did not require each ortholog group (i.e., ho-mologs that appear to have evolved from the same ancestral gene in the organismal most recent ancestor of the group) to be present in every genome, we repeated the analysis using the strict core with only those ortholog groups that were present in all genomes. The strict core phylogeny was consistent with the EC phylogeny (see Fig. S2 in the supplemental material), indi-cating that the ortholog groups present in all genomes did not represent variations in the topology observed between the strict versus expanded core.
Most of the general relationships observed in our study were consistent with those reported in the published literature. The recently proposed species, A. dhakensis, which was determined to be synonymous with A. aquariorum (44), was originally a subspe-cies of A. hydrophila. All three phylogenies support that these strains form one well-supported clade that is distinct from A.
hy-drophila. Interestingly, six A. hydrophila genomes that we
ob-tained from GenBank clearly clustered within A. dhakensis. Our study also grouped the strain SSU with A. dhakensis, which
sup-ports its recent reclassification from A. hydrophila to A. dhakensis (45). Misnamed genomes in GenBank should be corrected and resolved with thorough classification data to prevent further mis-identifications.
Our comprehensive analysis revealed an important difference compared to the previous MLSA by Murcia-Martinez et al., which was based on partial sequences of seven genes (34). In that study, the A. trota isolates (which included A. enteropelogenesT) grouped
with A. hydrophila and A. aquariorum, whereas in the HK and EC phylogenies of our study, A. enteropelogenesTand A. trotaTformed
a clade with a group that included the A. veronii group, or AVG (A. veronii bv. sobria, A. veronii bv. veronii, and A.
allosacchar-ophila), and A. jandaeiT. This finding is in agreement with those of
the study by Roger et al. (33). Examination of individual gene trees suggests that the varied placement was due to the use of different housekeeping genes in these two studies (see Fig. S3 to S6 in the supplemental material) and underscores the limitations of MLSA approaches that use shorter fragments of fewer genes, compared to studies using the expanded core or a large set of full-length housekeeping genes. Our study also confirmed the synonymity of
A. trota and A. enteropelogenes (31, 32).
The AVG itself is a controversial collection of species, which includes A. culicicolaTand A. ichthiosmiaT, both initially described
as new species but subsequently reclassified as A. veronii based on DNA relatedness and biochemical characterization (29–31). Our data support the synonymity of A. culicicolaTand A. ichthiosmiaT
with A. veronii, as the two strains grouped together with the A.
ve-ronii strains in one well-supported clade (Fig. 1A and B). An
in-teresting aspect of this species is that there are two reported A.
ve-ronii biovars, which differ phenotypically in that A. veve-ronii bv.
veronii is positive (100%) for esculin hydrolysis and ornithine decarboxylation while A. veronii bv. sobria is negative for both reactions (46). In our analysis, the three strains of A. veronii bv. veronii (CECT 4257T, AMC35, AER397) grouped together with
A. veronii B565 in a strongly supported clade within the larger A. veronii clade, which supports A. veronii bv. veronii as a bona
fide biovar. Comparisons of the A. veronii genomes revealed that members of A. veronii bv. veronii encode a-glucosidase (EC 3.2.1.21; 793 aa) and an ornithine decarboxylase (EC 4.1.1.17; 745 aa) not found among members of A. veronii bv. sobria, sug-gesting that these two enzymes may facilitate the reactions involv-ing esculin and ornithine, respectively. Based on this data, A.
ve-ronii B565, whose genome contains both genes, is a presumptive
member of the A. veronii bv. veronii. The two A. allosaccharophila strains (CECT 4199T and BVH88) also formed a strongly
sup-ported clade that was near but distinct from A. veronii, which suggests that A. allosaccharophila is a separate species. In our anal-ysis, we also included the newest proposed Aeromonas species,
A. australiensisT, which is monophyletic with A. fluvialisT and
A. sobriaTand the AVG.
The other phylogenetic relationships supported the relation-ships described in previously published reports, such as the well-supported clade formed by A. simiaeT, A. diversaT, and A.
schuber-tiiTthat is distinct from all the other Aeromonas species (Fig. 1)
and observed in all three phylogenies. The close relatedness be-tween A. piscicola and A. bestiarum (47) was also recovered in our analyses. Our results also support that strain CECT 4221, de-scribed as A. hydrophila subsp. anaerogenes, clusters within the
TABLE 1 General features of the Aeromonas genomes Species Strain Genome size (Mbp) No. of scaffolds Avg genome coveragee N 50f(nt) G⫹C content (%) No. of predicted
CDSsg Accession no. Reference
A. allosaccharophila CECT 4199T 4.66 120 87 114,541 58.4 4,173 PRJEB7019a This study
A. dhakensis
{A. aquariorum}b
CECT 7289T 4.69 78 117 163,504 61.7 4,266 PRJEB7020a This study
A. australiensis CECT 8023T 4.11 113 128 95,095 58.1 3,733 PRJEB7021a This study
A. bestiarum CECT 4227T 4.68 41 53 237,067 60.5 4,223 PRJEB7022a This study
A. bivalvium CECT 7113T 4.28 69 30 149,050 62.3 3,909 PRJEB7023a This study
A. caviae CECT 838T 4.47 111 95 101,663 61.6 4,081 PRJEB7024a This study
A. culicicola CIP 107763T 4.43 64 87 188,049 58.9 4,012 PRJEB7047a This study
A. diversa CECT 4254T 4.06 37 116 203,531 61.5 3,711 PRJEB7026a This study
A. encheleia CECT 4342T 4.47 35 112 380,984 61.9 4,076 PRJEB7027a This study
A. enteropelogenes CECT 4487T 4.47 46 56 208,775 59.5 4,054 PRJEB7028a This study
A. eucrenophila CECT 4224T 4.54 22 50 441,212 61.1 4,113 PRJEB7029a This study
A. fluvialis LMG 24681T 3.90 76 48 108,949 58.2 3,609 PRJEB7030a This study
A. ichthiosmia CECT 4486T 4.41 66 70 147,024 58.4 3,997 PRJEB7050a This study
A. jandaei CECT 4228T 4.50 58 55 161,393 58.7 4,065 PRJEB7031a This study
A. hydrophila subsp. hydrophila
CECT 839T 4.74 1 UNKc 4,744,448 61.5 4,119 CP000462d 74
A. media CECT 4232T 4.48 233 60 37,608 60.9 4,075 PRJEB7032a This study
A. molluscorum CIP 108876T 4.23 309 9 21,565 59.2 3,946 AQGQ01d 75
A. piscicola LMG 24783T 5.18 91 99 150,424 59.0 4,713 PRJEB7033a This study
A. popoffii CIP 105493T 4.76 105 67 113,495 58.4 4,331 PRJEB7034a This study
A. rivuli DSM 22539T 4.53 102 99 155,151 60.0 4,149 PRJEB7035a This study
A. salmonicida subsp. salmonicida
CIP 103209T 4.74 128 117 89, 543 58.5 4,442 PRJEB7036a This study
A. sanarellii LMG 24682T 4.19 98 121 82,664 63.1 3,828 PRJEB7037a This study
A. schubertii CECT 4240T 4.13 111 260 108,810 61.7 3,808 PRJEB7038a This study
A. simiae CIP 107798T 3.99 100 86 73,112 61.1 3,654 PRJEB7039a This study
A. sobria CECT 4245T 4.68 52 34 188,072 58.6 4,160 PRJEB7040a This study
A. taiwanensis LMG 24683T 4.24 106 66 85,294 62.8 3,884 PRJEB7041a This study
A. tecta CECT 7082T 4.76 51 89 238,229 60.1 4,278 PRJEB7042a This study
A. trota CECT 4255T 4.34 27 66 640,249 60.0 3,917 PRJEB7043a This study
A. veronii bv. veronii CECT 4257T 4.52 52 59 181,171 58.8 4,070 PRJEB7044a This study
A. allosaccharophila BVH88 4.71 131 204 74,486 58.6 4,295 PRJEB7045a This study
A. caviae Ae398 4.44 149 UNK 76,364 61.4 3,866 CACP01d 76
A. caviae {A. hydrophila subsp. anaerogenes}
CECT 4221 4.58 332 66 31,465 61.0 4,207 PRJEB7046a This study
A. dhakensis {A. aquariorum} AAK1 4.77 37 20 404,457 61.7 4,237 PRJDB70d 77 A. dhakensis {A. hydrophila subsp. dhakensis}
CIP 107500 4.71 73 84 165,885 61.8 4,284 PRJEB7048a This study
A. dhakensis {A. hydrophila} 173 4.79 74 46 119,625 61.6 4,134 AOBN01d 78 A. dhakensis {A. hydrophila} 277 4.79 41 76 282,384 61.6 4,213 AOBQ01d 78 A. dhakensis {A. hydrophila} 14 4.67 75 45 130,840 62 UNK AOBM01d 78 A. dhakensis {A. hydrophila} 116 4.61 45 66 208,249 62 4,090 ANPN01d 78 A. dhakensis {A. hydrophila} 259 4.70 80 39 117,245 61.7 4,098 AOBP01d 78 A. dhakensis {A. hydrophila} 187 4.78 59 111 197,352 61.6 4,205 AOBO01d 78 A. dhakensis {A. hydrophila}
SSU 4.94 2 285 4,791,870 61.5 4,449 AGWR01d The Broad Institute
A. hydrophila ML09_119 5.02 UNK UNK UNK 60.8 4,434 CP005966.1d 79
A. hydrophila SNUFPC_A8 4.97 41 37 234,812 60.8 4,352 AMQA01d 80
A. hydophila subsp. ranae
CIP 107985 4.68 107 140 90,304 61.6 4,268 PRJEB7049a This study
A. media WS 4.78 1 UNK 4,788,430 60.7 4,385 CP007567.1d 81
Assessment of genome similarity using isDDH and ANI. The
information gained from the phylogenetic analyses provides an important depiction of the evolutionary relationships of different strains but does not translate directly into the overall similarity of the genomes, which was determined through DDH. We used two different in silico or bioinformatics approaches, isDDH and ANI, that have been proposed to overcome the challenges of conven-tional laboratory-based DDH to evaluate the genomic similarity of bacteria, and we evaluated the congruence of these methods (Fig. 2) (9, 16, 21, 22).
Two excellent examples for validating this approach are A.
cu-licicolaT and A. ichthiosmiaT, which were initially proposed as
novel species and later reclassified as A. veronii based in part on DDH values that exceeded 70%. The predicted point estimates of the isDDH values we obtained for these two strains were all slightly below 70% (69.1 to 69.6% and 67.4 to 68.2, respectively) com-pared to all other named A. veronii strains (see Fig. S7 in the sup-plemental material). However, when taking into consideration the 95% confidence interval (CI) for every comparison of these two strains, all CIs encompassed the 70% threshold (upper CI borders, 70.6 to 71.8%), affirming that they are indeed A. veronii. While these isDDH values were lower than what we observed for other pairwise A. veronii strain comparisons, the median hybrid-ization value for A. culicicolaTand A. ichthiosmiaTto A. veronii was
only 2.2% below that of the A. veronii comparisons (71.6% versus 73.8%). Additionally, both strains also had ANI values at or above the 96% level, compared to the other named A. veronii strains, which supports that A. culicicolaTand A. ichthiosmiaTare part of
the A. veronii species, albeit near the periphery. The isDDH and ANI values were consistent with previously published results (29, 30).
The taxonomic status of A. allosaccharophila has been contro-versial, and it has been suggested that it is a member of A. veronii
(30). The upper borders of the 95% CI for the isDDH values for
A. allosaccharophila are below 70% compared to the A. veronii
strains. Additionally, the ANI values are all ~94%. These data support the status of A. allosaccharophila as a bona fide species that is closely related to A. veronii. Interestingly, while the HK, RP, and EC phylogenies all grouped the two A. allosaccharophila genomes (CECT 4199Tand BVH88) together and separate from A. veronii,
the ANI and the upper 95% CI isDDH values between the two
A. allosaccharophila genomes were both just under the species
cut-off boundary, at 95.8% and 68.7%, respectively. These data sug-gest that BVH88 may not be a member of the A. allosaccharophila species, but a greater number of strains in this clade will need to be evaluated to clarify their relationships. Two other species, A.
flu-vialis (ANI, ~92%) and A. australiensis (ANI, ~93%), also group
near A. veronii. Their isDDH estimates register ~52% compared to
A. veronii.
Another group of species that has recently attracted attention is
A. aquariorum, A. hydrophila subsp. dhakensi, and A. hydrophila.
The partition of the group comprised of A. aquariorum/A.
hydro-phila subsp. dhakensis strains from the A. hydrohydro-phila group, which
includes the type strain (CECT 839), was recovered conclusively by every method we used in our study. The branch lengths of the HK phylogeny between A. dhakensis and A. hydrophila (~0.075 substitutions/site) were similar to those separating many named species in the HK reconstruction, such as those between A.
eu-crenophilaTand A. tectaT(~1.0 substitutions/site), A. schubertiiT
and A. diversaT(~0.09 substitutions/site), A. rivuliTand A.
mol-luscorumT(~0.06 substitutions/site), and A. piscicolaTand A.
bes-tiarumT(~0.04 substitutions/site). Similar relationships were
ob-served in the RP and EC phylogenies. Further evidence comes from the ANI data, which showed only 93% similarity between the two different clades. This is well below the 96% species cutoff recommended by Richter (23). This conclusion was further
sup-TABLE 1 (Continued) Species Strain Genome size (Mbp) No. of scaffolds Avg genome coveragee N 50f(nt) G⫹C content (%) No. of predicted
CDSsg Accession no. Reference
A. salmonicida subsp. achromogenes
AS03 4.96 69 21 124,543 58.3 UNK AMQG02d 82
A. salmonicida subsp. salmonicida A449 5.04 1 UNK 5,040,536 58.2 4,436 CP000644.1d 83 A. salmonicida subsp. salmonicida 01-B526 4.92 604 40 83,743 58.4 4,529 AGVO01d 84 Aeromonas sp. {A. hydrophila}
AH4 4.87 41 90 258,555 59.6 4,453 PRJEB6940a This study
Aeromonas sp.
{A. veronii}
AMC 34 4.58 1 288 4,578,728 58.5 4,117 AGWU01d The Broad Institute
A. veronii B565 4.55 1 UNK 4,551,783 58.7 4,073 CP002607d 85
A. veronii bv. sobria AER 39 4.42 4 283 1,516,045 58.9 3,948 AGWT01d The Broad Institute
A. veronii bv. sobria Hm21 4.68 50 200 179,631 58.7 4,245 ATFB01d 62
A. veronii bv. sobria LMG 13067 4.74 72 46 147,470 58.3 4,171 PRJEB7051a This study
A. veronii bv. veronii AER 397 4.50 5 378 3,260,625 58.9 3,986 AGWV01d The Broad Institute
A. veronii bv. veronii AMC 35 4.57 2 285 4,172,420 58.6 4,036 AGWW01d The Broad Institute
aObtained from the EMBL Nucleotide Sequence Database. bPreviously published names are indicated inside braces. cUNK, unknown.
dObtained from GenBank, National Center for Biotechnology Information. eThe average genome coverage is expressed in bp sequenced divided by genome size. fThe N
50(reported in nucleotides) represents the smallest of the largest contigs covering 50% of the total size of all contigs.
0.04 A. ichthiosmia CECT 4486 A. ver onii AER 397 A. bestarium CECT 4227 T A. sobria CECT 4245 T A. hydr ophila subsp. dhakensis CIP 107500 A. enter opelogenes CECT 4487 T A. austrailiensis CECT 8023 T A. ver onii AER 39 A. ver onii AMC 34 A. schubertii CECT 4240 T A. tecta CECT 7082 T A. hydr ophila subsp. anaer ogenes CECT 4221 A. caviae Ae398 A. ver onii bv . sobria LMG 13067 A. ver onii Hm21 A. ver onii B565 A. hydr ophila SNUFPC-A8 A. salmonicida 01 B526 A. taiwanensis LMG 24683 T A. hydr ophila 173 A. simiae CIP 107798 T A. popoffii CIP 105493 T A. media CECT 4232 T A. tr ota CECT 4255 T A. jandaei CECT 4228 T A. hydr ophila ML09-1 1 9 A. culicicola CIP 107763 A. molluscorum CIP 108876 T A. salmonicida subsp. salmonicida CIP 103209 T A. aquariorum AAK1 A. salmonicida A449 A. hydr ophila 259 A. hydr ophila 277 A. diversa CECT 4254 T A. hydr ophila 187 A. salmonicida subsp. achr omogenes AS03 A. hydr ophila SSU A. hydr ophila subsp. ranae CIP 107985 A. hydr ophila 11 6 A. caviae CECT 838 T A. hydr ophila CECT 839 T A. rivuli DSM 22539 T A. ver onii bv . ver onii CECT 4257 T A. media WS A. fluvialis LMG 24681 T A. bivalvium CECT 71 13 T A. allosacchar ophila CECT 4199 T A. encheleia CECT 4342 T A. piscicola LMG 24783 T A. sanar elli LMG 24682 T A. eucr enophila CECT 4224 T A. aquariorum CECT 7289 T A. allosacchar ophila BVH88 A. hydr ophila 014 A. ver onii AMC 35 A. hydr ophila AH4
16-Housekeeping Gene Phyloge
ny
Expanded Core Phylogeny
0.05 A. taiwanensis LMG 24683 T A. salmonicida 01 B526 A. hydr ophila 187 A. ver onii Hm21 A. eucr enophila CECT 4224 T A. salmonicida A449 A. ver onii B565 A. encheleia CECT 4342 T A. popoffii CIP 105493 T A. piscicola LMG 24783 T A. hydr ophila 173 A. media WS A. hydr ophila subsp. ranae CIP 107985 A. bivalvium CECT 71 13 T A. hydr ophila 11 6 A. caviae Ae398 A. allosacchar ophila BVH88 A. caviae CECT 838 T A. simiae CIP 107798 T A. tr ota CECT 4255 T A. schubertii CECT 4240 T A. austrailiensis CECT 8023 T A. ver onii AMC 35 A. ver onii bv . sobria LMG 13067 A. aquariorum AAK1 A. sanar elli LMG 24682 T A. diversa CECT 4254 T A. media CECT 4232 T A. hydr ophila SNUFPC-A8 A. ver onii bv . ver onii CECT 4257 T A. hydr ophila CECT 839 T A. hydr ophila subsp. dhakensis CIP 107500 A. fluvialis LMG 24681 T A. ver onii AER 397 A. molluscorum CIP 108876 T A. bestarium CECT 4227 T A. ver onii AER 39 A. sobria CECT 4245 T A. hydr ophila ML09-1 1 9 A. hydr ophila AH4 A. allosacchar ophila CECT 4199 T A. hydr ophila 277 A. enter opelogenes CECT 4487 T A. salmonicida subsp. salmonicida CIP 103209 T A. salmonicida subsp. achr omogenes AS03 A. hydr ophila 014 A. rivuli DSM 22539 T A. aquariorum CECT 7289 T A. hydr ophila subsp. anaer ogenes CECT 4221 A. hydr ophila 259 A. hydr ophila SSU A. culicicola CIP 107763 A. ichthiosmia CECT 4486 A. tecta CECT 7082 T A. jandaei CECT 4228 T A. ver onii AMC 34
90%+ Bootstraps 80%+ Bootstraps 70%+ Bootstraps
Branch Supports: ≥ 0.97 aLR T SH-like Local Supports Branch Supports: 1 1 2 3 4 5 6 7 8 2 3 4 5 6 7 8
AB
FIG 1 (A) Maximum likelihood reconstruction of 16 single-copy housekeeping genes. Support values are represented by dots: red (90%⫹ bootstraps), orange
(80%⫹), yellow (70%⫹). (B) Approximate maximum likelihood reconstruction of 2,710 orthologous groups found in 90% or more of the taxa. aLRT SH-like
support values equal to or greater than 0.97 are represented by red dots. The species A. veronii, A. hydrophila, A. dhakensis, A. salmonicida, and A. caviae are color-coded in both trees. Additionally, two previously misidentified taxa, A. veronii AMC 34 and A. hydrophila AH4, are shown in red and teal, respectively. Eight well-supported clades were shared between the two reconstructions. They are shown by the colored bars and are numbered 1 through 8.
= ANI ≥ 96% or is DDH + C.I. ≥ 69.5% = ANI ≥ 94% = ANI ≥ 95%
FIG 2 ANI and isDDH values. The lower triangle displays ANI values, and the upper triangle shows the isDDH values. ANI values are colored according to three
historical species cutoff values: 94% (yellow), 95% (orange), and 96%⫹ (red). The isDDH values displayed are the upper limits of the 95% confidence intervals
and are colored red if the met the laboratory DDH species cutoff of 70% hybridization. ANI of 96% correlates well with 70% isDDH values, with only the A.
ported by isDDH data, in which A. dhakensis and A. hydrophila strains all scored below 60% between species when using the up-per border of the 95% CI, while within each partition all values were well above 70%. These data confirm that these two clades represent two discrete species rather than constituents of one, as was originally proposed (48).
A. piscicolaTand A. bestiarumTgrouped together and formed
one clade with A. popoffiiT. The ANI between A. piscicolaTand
A. bestiarumTwas 95.2%, which is near the 96% suggested species
cutoff (23). However, while their isDDH values were higher than most between-species comparisons (61.1% point estimate, 64.4% at the upper 95% CI), they still fell short of what one would expect for members of the same species. It will be important to add more strains of these two groups in future analyses to gain better insight into the relationships between these taxa. Based on the current data, a 96% cutoff for the ANI value seems appropriate for
Aero-monas species delineations.
Discovery of novel species. We also included two strains in
our analysis that seemed unusual based either on previous studies or preliminary data. AMC 34, a clinical isolate described as A.
ve-ronii bv. veve-ronii, had a long branch length and clustered away
from other A. veronii bv. veronii strains in a previous study (41). Strain AH4 was published as A. hydrophila by investigators that had obtained this isolate from the water of a storage container for medicinal leeches (49). In the HK phylogeny, AMC 34 clustered well outside the A. veronii clade, near A. jandaeiTand A. fluvialisT,
with bootstrap support values in excess of 90% (Fig. 1A). Simi-larly, the EC phylogeny placed AMC 34 outside of A. veronii with high support (Fig. 1B). The ANI between AMC 34 and the AVG was ~94%, while the isDDH was only ~58% compared to the same taxa (Fig. 2). Taken together, the data strongly support AMC 34 as a new species.
The other strain, AH4, was identified by a clinical diagnostic laboratory as A. hydrophila (49). In all of our phylogenetic analy-ses, AH4 grouped with A. piscicolaTand A. bestiarumTwith high
support. This placement and its distance from A. hydrophila were strongly supported by the ANI and isDDH data (Fig. 2). AH4 registered only ~89% to both the A. hydrophila and A. dhakensis groups but much higher values to A. bestiarumT(~94%) and A.
pi-scicolaT(~93%). isDDH also supported the conclusion that AH4 is
not likely a member of A. bestiarum (~55%) or A. piscicola (~52%) and is distinct from the A. hydrophila (~38%) and A. dhakensis (37%) groups.
All of our bioinformatics analyses indicated that the strains AMC 34 and AH4 represent two new species; however, we were restricted to a single isolate of each, which precluded the assess-ment of the variabilities of biochemical tests (see Table S1 in the supplemental material). In addition, we were unable to include one recently published type strain, A. cavernicola CCM7641T(50)
or one proposed new species, A. lusitana (34), which has not yet been officially described. Using the available MLSA data, we were able to show that AMC 34 and AH4 did not cluster near these two species and are thus not likely members of either A. cavernicola or
A. lusitana (see Fig. S8 in the supplemental material). The
acces-sibility of the genomes published for this study will provide other researchers with the opportunity to determine the probable taxo-nomic position of candidate novel species, an important capabil-ity in light of the number of taxonomic problems described for
Aeromonas.
Comparison of phylogenetic and genetic distance measures.
The delineation of organisms into taxonomic groups is based on their evolutionary histories and genetic distances. In this study, we utilized five different approaches, of which two were phylogeny independent (isDDH and ANI) and three had a phylogenetic component (HK, RP, and EC phylogenies). To guide subsequent studies, we wanted to evaluate whether these approaches were in agreement with one another and whether some were more infor-mative than others. Even though isDDH and ANI use different algorithms for the calculations, e.g., ANI evaluates the similarity of shared elements between two genomes, while isDDH estimates the overall similarity of two genomes, the results were very con-sistent (Fig. 3). The r2value was 0.957 for the entire data set, and
when restricted to comparisons of more closely related strains (isDDH ofⱖ55%), the r2was 0.996. These values demonstrated
that at least for this data set, either method can be used for deter-mining overall genome similarities. When isDDH (upper 95% CI) and ANI results were compared to the P-distance of the entire EC data set, the r2values were low for both approaches, 0.599 and
0.713, respectively. When the data set was restricted to compari-sons of genomes that had at least a similarity ofⱖ50% based on
isDDH, the correlation coefficients were 0.943 and 0.965for
is-DDH and ANI, respectively (see Fig. S9 in the supplemental ma-terial). This indicated that either approach works well at separat-ing closely related genomes but not for determinseparat-ing more distant relationships.
Most researchers characterize strains by analyzing the se-quences of only one or two genes. We wanted to ascertain whether there are particular genes that are better suited than others for an initial analysis. One important concern is that horizontal gene transfer of gene fragments and not just entire genes can occur among aeromonads and result in conflicting phylogenies (41). Thus, relying on any one gene can produce erroneous results. On the other hand, including a preponderance of genes that represent a highway of gene sharing in a concatenation may result in phy-logenies that reflect neither organismal evolution nor any individ-ual gene history (51). The individindivid-ual gene trees (see Fig. S3 to 6 in the supplemental material) for the 16 housekeeping genes were compared to the phylogeny derived from the consensus tree using
FIG 3 Comparison of isDDH and ANI results. The pairwise percent similar-ities of 56 genomes were determined using either isDDH or ANI. The two
approaches revealed a significant correlation, with an r2of 0.957. When testing
the approximately unbiased (AU) test (52). The set of maximum likelihood (ML) trees generated from bootstrap samples of the MLSA data were significantly different from the best gene tree for each gene. When maximum likelihood trees from bootstrap sam-ples of the 16 housekeeping genes were compared to the MLSA tree, 15 of the gene tree sets were significantly different from the MLSA best tree. Only one of the bootstrap samples for recA had a
P value ofⱖ0.05 (P ⫽ 0.93). These results reveal that no individual
gene tree properly reflects or is even compatible with the phylog-eny of the MLSA tree.
DISCUSSION
Our polyphasic genome comparison utilizing both phylogenetic and genetic distance metrics was by and large consistent with the current understanding of the phylogenetic relationships of the species contained within the genus Aeromonas, which had been hitherto based on laboratory-determined DDH values, biochem-ical tests, and multilocus sequence typing. Importantly, we were able to gain new insights into the overall relationships of the
Aero-monas species with the phylogeny generated from the expanded
core and the HK genes. There were eight major clades from the EC that were largely consistent with the HK phylogeny (Fig. 1). One major difference between the two phylogenies was the placement of A. salmonicida (clade 7) and A. hydrophila and A. dhakensis (clade 2). In the EC phylogeny, they form one strongly supported clade, but in the HK phylogeny they are separated by two well-supported nodes (Fig. 1). This suggests that other components of the genome are forcing A. hydrophila and A. salmonicida together in the expanded core phylogeny. Due to the limited resolution, the RP phylogeny did not provide additional support. A strict core phylogeny using only ortholog groups present in all 56 taxa shared the topology of the EC tree, suggesting that the conflict with the HK method was due to genes present in 100% of the genomes (see Fig. S2 in the supplemental material). One should consider, how-ever, that the EC phylogeny may have inherent biases which might lead to an inaccurate depiction of organismal phylogeny. At this point, we cannot establish which topology is correct, since gene transfer between divergent groups has the potential to lead to trees from concatenated data sets that do not reflect the vertical inher-itance (19). Gene transfer frequency is usually biased toward close relatives, thus reinforcing the signal due to shared ancestry (53, 54). In contrast, highways of gene sharing between more distant species can obscure the vertical phylogenetic signal due to shared ancestry (51, 55). For phylogenetic relationships within each of the clades 1 through 7, the HK and EC phylogenies appear to approximate organismal phylogeny (Fig. 1). On the other hand, relationships between these clades remain ambiguous. Differences in substitution rates and saturation with substitutions make it difficult to apply ANI and isDDH to higher taxonomic levels. Fu-ture work will need to include the evaluation of the 2,710 individ-ual trees from the EC analysis in a combined analysis, such as the one described by Bansal, Alm, and Kellis (56), to determine the major conflicting phylogenetic signals retained in these genomes. Even so, both the HK and EC phylogenies provided more infor-mation regarding the relationships of different Aeromonas species than previous MLSA studies.
The psychrophilic aeromonads have been differentiated from the mesophilic strains based on growth physiology, biochemical properties, and virulence characteristics. Although there certainly are important differences among these characteristics,
whole-genome information groups them clearly among the mesophilic species, near A. hydrophila and A. dhakensis. One interesting dis-tinction of the A. salmonicida clade is that there is much less ge-netic diversity, indicated by the isDDH values for strains of the same species. The four A. salmonicida genomes had isDDH values ⱖ98.5%, in comparison to A. hydrophila (ⱖ75.7%), A. dhakensis (ⱖ78.3%), and A. veronii (ⱖ70.4%). This was consistent with a study that suggested a clonal distribution of A. salmonicida subsp.
salmonicida based on identical pulse electrophoresis DNA
finger-prints, which showed identical banding patterns from strains iso-lated from different geographical regions (57). This difference in genetic diversity could reflect different evolutionary driving forces for A. salmonicida strains. One conjecture is that perhaps they are adapted for a virulent lifestyle in fish, where clonal outbreaks are more likely to occur. It is also possible that there is a sampling bias, which future studies employing more strains should help to re-solve.
One of our goals was to assess the utility of bioinformatics approaches to replace traditional taxonomic approaches for spe-cies identification. Despite the shortcomings and challenges of laboratory DDH, whole-genome content comparisons collec-tively represent the most valuable criterion for demarcation of bacterial species. As more bacterial genomes are sequenced and the information is made accessible, the use of whole genome se-quences in the characterization of bacterial species provides op-portunities that should not be ignored. This approach has been used in clarifying the taxonomic positions in some cases, e.g., for
Acinetobacter using ANI and core gene phylogeny (15) and for Vibrio using MLSA based on genome information (58). To our
knowledge, however, an approach utilizing isDDH and ANI com-bined with HK, RG, and EC phylogenies has not yet been done for a genus characterized by a complicated taxonomy and using a plurality of its members.
Aeromonas is an interesting test case for a number of reasons.
This genus is comprised of a large number of species capable of diverse associations depending on the species. The spectrum en-compasses benign and virulent species, a range that can also exist within a single species. A. hydrophila, A. caviae, and A. veronii have long been associated with human disease (26). Recently, A.
dhak-ensis was recognized as a new virulent species (59), a distinction
obfuscated in part due to A. dhakensis strains initially regarded as
A. hydrophila. Of the numerous Aeromonas species that have been
proposed and characterized, many of those species have been re-defined and renamed as new information has been presented. This shifting nomenclature is a manifestation of the inefficiencies in-herent in current taxonomic methods for Aeromonas. While the number of publically available Aeromonas genomes has increased dramatically in the last few years, most of the type strains are yet to be fully sequenced. We produced improved, high-quality draft genomes for these type strains and for some non-type strains of interest. Our results recapitulated known phylogenetic relation-ships and provided further insights into several others. This study also identified the breakpoints between species, indicating that this approach can be used to identify new species. For demarcating species boundaries, isDDH and ANI produced similar results, as reflected in the correlation of the values observed when using the upper 95% CI bound to the isDDH estimates (Fig. 3). The current version of isDDH is only available in a Web-based interface that requires manually uploading the sequence information, while ANI can be easily run on local servers. Consequently, we found
ANI to be more time-effective when dealing with a large number of strains. For smaller studies, isDDH would be equally fast for computing and would also have the benefit of confidence intervals and probability statistics.
Apart from the fact that our approach could confidently and consistently resolve recent taxonomic controversies, our analysis also revealed that two strains, AMC 34 and AH4, represent new
Aeromonas species. This conclusion is based on the distance in the
genome content according to ANI and isDDH values, as well as the phylogenetic distances of the strains. These finding highlights two important advantages of bioinformatic assessment of genome similarity: (i) the expensive generation of the raw data does not have to be repeated by other research groups, and (ii) interlabo-ratory variations in DDH determinations can be overcome by agreeing to a cutoff value with standardized parameters in bioin-formatic analyses. To facilitate the progress of other research groups in the Aeromonas field, we have set up a website (http:// aeromonasgenomes.uconn.edu) that allows users to query and download all of the available Aeromonas genomes, contains the scripts we used in our analysis, and provides a summary of our current distance measures.
Another important finding from our analysis was that, out of the 23 publically available Aeromonas genomes that we analyzed, 8 (34.8%) are inconsistenly named. In large part this was due to the recent reclassification of A. hydrophila subsp. dhakensis as A.
dhak-ensis and the reclassification of A. aquariorum as A. dhakdhak-ensis.
While the initial misclassifications are understandable, efforts should be taken to correct and update the nomenclature to curtail the promulgation of inaccurate information. NCBI currently al-lows only the original submitter to request the name change (http://www.ncbi.nlm.nih.gov/books/NBK51157/). One possibil-ity would be to involve the communpossibil-ity at large to provide input on such discrepancies.
The ability to generate improved, high-quality draft genome sequences rapidly and inexpensively, and of a sufficient quality for robust phylogenetic analyses (20), is changing the landscape of how one can investigate microbial taxonomy and should lead to a change in the requirements of performing laboratory-based DDH for species descriptions. An additional benefit of genome sequenc-ing is that it offers a comprehensive resource to explore the myriad of potential metabolic capabilities, physiology, virulence factors, and antibiotic resistance profiles for the strains studied. The ad-vantages of in silico DDH or ANI have been elegantly stated before (9, 16, 21, 22), and we have provided strong support for imple-menting these approaches in today’s microbial taxonomic studies. However, we recognize that the procedure of officially naming and describing new organisms is understandably a conservative and carefully regulated process; the effects on many different con-stituents have to be considered, since any amendments will result in broad effects for the scientific community at large. In this study, we provided data from a genus with a complex and controversial taxonomy and demonstrated the accuracy of the bioinformatics approach to identify new species and to correct erroneous identi-fications from previous studies. Utilizing the same software, code, and parameters for the data analysis, one can readily compare findings of other groups, thus supplanting arguments concerning laboratory methodologies with practical discussions on appropri-ate cutoff levels. For this test case study with Aeromonas, an isDDH ofⱖ70% at the upper 95% confidence interval or an ANI value of ⱖ96% was consistent for genomes belonging to the same species.
Distance in the EC phylogeny is another metric that can be useful in species identification; in our study, a distance ofⱕ0.026 indi-cated that the genomes belong to the same species. It is likely that these types of values will also be applicable to other genera.
MATERIALS AND METHODS
Strains, growth conditions, and biochemical tests. For the genome data set, we included all of the type strains for Aeromonas with the exception
A. cavernicola (50), as well as all other Aeromonas genomes deposited into
public databases as of 17 July 2013. For the type strains, 2 were publically available and 27 were sequenced in-house. For additional strains, 21 were available publically and 6 were sequenced in-house. The bacteria were grown at the optimal growth temperature for the strain in LB broth or on LB agar (1.5%) plates for 16 to 18 h (60). For biochemical tests, API 20NE strips (bioMérieux, Marcy l’Etoile, France) were used in accordance with the manufacturer’s instructions. Separate tests for ornithine decarboxyl-ase (ODC) activity and esculin hydrolysis were assessed using ODC broth and bile esculin agar (Sigma-Aldrich, St. Louis, MO). Tests were per-formed in triplicate.
Library preparation and genome sequencing. Genomic DNA was extracted using the MasterPure DNA purification kit (Epicenter, Madi-son, WI) and quantified using a Qubit 2.0 fluorometer (Life Technologies, Carlsbad, CA). DNA was also checked for quality by using a NanoDrop instrument (NanoDrop Products, Wilmington, DE) as well as on an aga-rose gel. Libraries were prepared from the genomic DNA using a Nextera or Nextera XT DNA sample preparation kit (Illumina, Inc., San Diego, CA). Library concentrations were determined by using the Qubit fluo-rometer and bioanalyzer (Agilent Technologies, Santa Clara, CA) prior to sequencing on a MiSeq benchtop sequencer (Illumina, Inc.) at the Micro-bial Analysis Resources and Services facility at the University of Connect-icut (Storrs, CT).
Assembly and annotation. Paired Illumina reads were trimmed and assembled into scaffolded contigs by using the de novo assembler of CLC Genomics Workbench versions 6.0.04 to 7.0.04 (CLC-bio, Aarhus, Den-mark). Annotation of the contigs was accomplished using the Rapid Au-tomated Annotation using Subsystem Technology (RAST) server (61). All
Aeromonas completed and draft annotated assemblies from the NCBI ftp
repository that were used in this study were downloaded, back-engineered into contigs, and submitted to RAST for reannotation to mitigate any biases in the RAST annotation algorithms by applying them equally to each genome. The completeness of the genomes was initially assessed by screening for 17 housekeeping genes and 47 ribosomal proteins. We failed to detected ppsA (phosphoenolpyruvate synthase) in A. fluvialis. A thor-ough investigation employing mapping of reads to reference sequences and examining the region containing ppsA in the other strains suggested that this gene may not be present in this organism, and thus we excluded
ppsA from the analysis.
MLSA reference tree and individual gene tree generation. Sixteen housekeeping genes (atpD, dnaJ, dnaK, dnaX, gltA, groL, gyrA, gyrB, metG,
mdh, radA, recA, rpoC, rpoD, tsf, and zipA) were used for MLSA (33, 34,
39). The DNA-directed RNA polymerase subunit beta= (rpoC) was used in the MLSA dataset. Adding rpoB to the dataset or switching it for rpoC did not change the phylogeny resulting from the MLSA analysis depicted in Fig. 1. These genes were initially chosen in three separate MLSA studies for their conservation among all aeromonads, ease of PCR primer design, broad distribution, and single copy number in the chromosome. The full-length sequence of each gene was initially derived from the previously published genome of A. veronii Hm21 (62), and these sequences served as queries for BLAST searches against the annotated proteins of all 56 ge-nomes. Multiple sequence alignments (MSAs) were generated by trans-lating the genes to protein sequences in SeaView (63), aligning the pro-teins using MUSCLE (v.3.8.31) (64) and then back-translating to the nucleotide sequences prior to the phylogenetic analysis. Each MSA was manually evaluated, and any sequences showing poor alignment were examined further, including comparison against the nonredundant
data-base using BLAST and excluded if not found to be the correct protein. In-house scripts created a concatenated alignment of all 16 genes. A model of evolution was determined by using the Akaike information criterion with correction for small sample size (AICc), as implemented in jMod-elTest 2.1.4. An ML phylogeny was generated from the concatenated MSA, and individual gene phylogenies from the individual gene MSAs were determined by using PhyML (v 3.0_360-500M) (65). PhyML param-eters consisted of a GTR model, estimated p-invar, 4 substitution rate categories, estimated gamma distribution, and subtree pruning and re-grafting enabled with 100 bootstrap replicates. Using the same approach, phylogenies were determined for each of the 16 housekeeping genes.
Ribosomal reference tree generation. Forty-seven ribosomal pro-teins were obtained from the BioCyc website (66). These served as queries for BLAST searches against the annotated proteins of all 56 genomes. Multiple sequence alignments were generated as described above for the MLSA tree. The AICc reported the best-fitting model to be GTR plus gamma estimation plus invariable site estimation.
Core genome comparison. To define a core genome, the annotated protein open reading frames (ORFs) from each genome were used as BLAST queries against the protein ORFs of each other genome in the study, using in-house Perl scripting. The BLAST outputs were processed into OGs with MCL-edge v14-137 (67, 68) (http://micans.org/mcl/). The inflation value was set to 10 in order to break the OGs down into smaller clusters that more closely resembled individual genes rather than families. A relaxed core was defined by extracting OGs present in at least 90% of the taxa used in this study. Where a taxon had multiple entries in a single OG, the first entry reported by MCL was arbitrarily included and the others were excluded. Each OG was aligned using MUSCLE v 3.8.31 (64). In-house Perl scripting concatenated the OGs into a single alignment. Owing to the scale of the concatenated alignment, FastTreeMP (69) was used to perform the phylogenetic reconstruction. The substitution model used was WAG.
Pairwise sequence distance calculations and identity calculations. Sequence distances were calculated using the SaveDist function in PAUP* v4.0b10 (70). The distance type calculated was the P-distance.
Average nucleotide identity/tetramer analysis. Assembled contigs were reconstituted from the RAST-generated GenBank files for all ge-nomes by using the seqret function of the EMBOSS package (71). All genomes were treated in the same manner to ensure that any biases were consistent across the entire data set. JSpecies1.2.1 (23) was used to analyze these contig sets for the ANI and tetramer usage patterns, using default parameters. We report here the averages of the reciprocal comparisons.
Tree comparisons using the approximately unbiased test. Per site log likelihoods were generated in RAxML v 7.3.5 (72). The AU tests (52) were carried out in the CONSEL v 1.20 package (73). Comparisons were made with HK tree against the 100 bootstrap replicates from each individual gene. Likewise, each best individual gene tree was compared against 100 bootstrap replicates of the HK tree.
In silico DNA-DNA hybridization. Estimates of isDDH were made
using the Genome-to-Genome Distance Calculator (GGDC) (9, 21). The contig files were uploaded to the GGDC 2.0 Web server (http://ggd-c.dsmz.de/distcalc2.php), where isDDH calculations were performed. Formula 2 alone was used for analysis, since it calculates isDDH estimates independent of genome lengths and is recommended by the authors of GGDC for use with any incomplete genomes (9, 21). The point estimate plus the 95% model-based confidence intervals were used for analysis. SUPPLEMENTAL MATERIAL
Supplemental material for this article may be found athttp://mbio.asm.org
/lookup/suppl/doi:10.1128/mBio.02136-14/-/DCSupplemental. Figure S1, EPS file, 0.6 MB.
Figure S2, EPS file, 0.6 MB. Figure S3, EPS file, 2.1 MB. Figure S4, EPS file, 2.1 MB. Figure S5, EPS file, 1.5 MB. Figure S6, PDF file, 2 MB.
Figure S7, EPS file, 11.8 MB. Figure S8, EPS file, 0.7 MB. Figure S9, PDF file, 0.3 MB. Table S1, DOCX file, 0.02 MB. ACKNOWLEDGMENTS
We thank E. Talagrand for excellent technical assistance, A. Horneman and R. M. Humphries for providing strains, the UConn Bioinformatics Facility for providing computing resources and the Microbial Analysis, Resources and Services Facility for access to an Illumina MiSeq system.
This research was supported through NIH R01 GM095390 (Joerg Graf, Peter Visscher, and Hilary G. Morrison), USDA ARS agreement 58-1930-4-002, and the National Science Foundation (DEB 0830024). REFERENCES
1. Didelot X, Bowden R, Wilson DJ, Peto TE, Crook DW. 2012. Trans-forming clinical microbiology with bacterial genome sequencing. Nat.
Rev. Genet. 13:601– 612.http://dx.doi.org/10.1038/nrm3437.
2. Pallen MJ, Loman NJ, Penn CW. 2010. High-throughput sequenc-ing and clinical microbiology: progress, opportunities and challenges.
Curr. Opin. Microbiol. 13:625– 631. http://dx.doi.org/10.1016/
j.mib.2010.08.003.
3. Ribeca P, Valiente G. 2011. Computational challenges of sequence
clas-sification in microbiomic data. Brief. Bioinform. 12:614 – 625. http://
dx.doi.org/10.1093/bib/bbr019.
4. Chen L, Xiong Z, Sun L, Yang J, Jin Q. 2012. VFDB 2012 update: toward the genetic diversity and molecular evolution of bacterial virulence
fac-tors. Nucleic Acids Res. 40:D641–D645.http://dx.doi.org/10.1093/nar/
gkr989.
5. Grad YH, Lipsitch M, Feldgarden M, Arachchi HM, Cerqueira GC, Fitzgerald M, Godfrey P, Haas BJ, Murphy CI, Russ C, Sykes S, Walker BJ, Wortman JR, Young S, Zeng Q, Abouelleil A, Bochicchio J, Chauvin S, Desmet T, Gujja S, McCowan C, Montmayeur A, Steelman S, Frimodt-Møller J, Petersen AM, Struve C, Krogfelt KA, Bingen E, Weill FX, Lander ES, Nusbaum C, Birren BW, Hung DT, Hanage WP. 2012. Genomic epidemiology of the Escherichia coli O104:H4 outbreaks in
Eu-rope, 2011. Proc. Natl. Acad. Sci. U. S. A. 109:3065–3070. http://
dx.doi.org/10.1073/pnas.1121491109.
6. Sogin ML, Morrison HG, Huber JA, Mark Welch D, Huse SM, Neal PR, Arrieta JM, Herndl GJ. 2006. Microbial diversity in the deep sea and the underexplored “rare biosphere.” Proc. Natl. Acad. Sci. U. S. A. 103:
12115–12120.http://dx.doi.org/10.1073/pnas.0605127103.
7. Bomar L, Maltz M, Colston S, Graf J. 2011. Directed culturing of
microorganisms using metatranscriptomics. mBio 2(2):e00012-11.http://
dx.doi.org/10.1128/mBio.00012-11.
8. Schnoes AM, Brown SD, Dodevski I, Babbitt PC. 2009. Annotation error in public databases: misannotation of molecular function in enzyme
superfamilies. PLOS Comput. Biol. 5:e1000605. http://dx.doi.org/
10.1371/journal.pcbi.10000605.
9. Meier-Kolthoff JP, Auch AF, Klenk HP, Göker M. 2013. Genome sequence-based species delimitation with confidence intervals and
im-proved distance functions. BMC Bioinformatics 14:60.http://dx.doi.org/
10.1186/1471-2105-14-60.
10. Chun J, Rainey FA. 2014. Integrating genomics into the taxonomy and systematics of the Bacteria and Archaea. Int. J. Syst. Evol. Microbiol. 64:
316 –324.http://dx.doi.org/10.1099/ijs.0.054171-0.
11. Brenner DJ, Staley JT, Krieg NR. 2005. Classification of procaryotic organisms and the concept of bacterial speciation, p 27316 –32. In Brenner DJ, Staley JT, Krieg NR, Garrity GM (ed), Bergey’s manual of systematic bacteriology, vol 2. The proteobacteria. Springer Verlag, New York, NY. 12. Lapage SP, Sneath PHA, Lessel EF, Skerman VBD, Seeliger HPR, Clark
WA. 1992. International code of nomenclature of Bacteria: bacteriological code, 1990 revision. ASM Press, Washington, DC.
13. Stackebrandt E, Frederiksen W, Garrity GM, Grimont PA, Kämpfer P, Maiden MC, Nesme X, Rosselló-Mora R, Swings J, Trüper HG, Vauterin L, Ward AC, Whitman WB. 2002. Report of the ad hoc com-mittee for the re-evaluation of the species definition in bacteriology. Int. J.
Syst. Evol. Microbiol. 52:1043–1047. http://dx.doi.org/10.1099/
ijs.0.02360-0.
14. Gevers D, Cohan FM, Lawrence JG, Spratt BG, Coenye T, Feil EJ, Stackebrandt E, Van de Peer Y, Vandamme P, Thompson FL, Swings J.