HAL Id: hal-01061630
https://hal.archives-ouvertes.fr/hal-01061630
Submitted on 3 Nov 2017
HAL is a multi-disciplinary open access
archive for the deposit and dissemination of
sci-entific research documents, whether they are
pub-lished or not. The documents may come from
teaching and research institutions in France or
abroad, or from public or private research centers.
L’archive ouverte pluridisciplinaire HAL, est
destinée au dépôt et à la diffusion de documents
scientifiques de niveau recherche, publiés ou non,
émanant des établissements d’enseignement et de
recherche français ou étrangers, des laboratoires
publics ou privés.
historical and geological evidences from the south
Caspian Sea
A. Naderi Beni, H. Lahijani, R. Mousavi Harami, K. Arpe, S. A. G. Leroy,
Nick Marriner, M. Berberian, Valérie Andrieu-Ponel, M. Djamali, A.
Mahboubi, et al.
To cite this version:
A. Naderi Beni, H. Lahijani, R. Mousavi Harami, K. Arpe, S. A. G. Leroy, et al.. Caspian Sea level
changes during the last millennium: historical and geological evidences from the south Caspian Sea.
Climate of the Past, European Geosciences Union (EGU), 2013, 9 (4), pp.1645-1665.
�10.5194/cp-9-1645-2013�. �hal-01061630�
Clim. Past, 9, 1645–1665, 2013 www.clim-past.net/9/1645/2013/ doi:10.5194/cp-9-1645-2013
© Author(s) 2013. CC Attribution 3.0 License.
EGU Journal Logos (RGB)
Advances in
Geosciences
Open Access
Natural Hazards
and Earth System
Sciences
Open AccessAnnales
Geophysicae
Open AccessNonlinear Processes
in Geophysics
Open AccessAtmospheric
Chemistry
and Physics
Open AccessAtmospheric
Chemistry
and Physics
Open Access DiscussionsAtmospheric
Measurement
Techniques
Open AccessAtmospheric
Measurement
Techniques
Open Access DiscussionsBiogeosciences
Open Access Open Access
Biogeosciences
DiscussionsClimate
of the Past
Open Access Open Access
Climate
of the Past
Discussions
Earth System
Dynamics
Open Access Open Access
Earth System
Dynamics
DiscussionsGeoscientific
Instrumentation
Methods and
Data Systems
Open Access
Geoscientific
Instrumentation
Methods and
Data Systems
Open Access DiscussionsGeoscientific
Model Development
Open Access Open Access
Geoscientific
Model Development
DiscussionsHydrology and
Earth System
Sciences
Open AccessHydrology and
Earth System
Sciences
Open Access DiscussionsOcean Science
Open Access Open Access
Ocean Science
DiscussionsSolid Earth
Open Access Open Access
Solid Earth
Discussions
The Cryosphere
Open Access Open Access
The Cryosphere
Discussions
Natural Hazards
and Earth System
Sciences
Open Access
Discussions
Caspian sea-level changes during the last millennium:
historical and geological evidence from the south Caspian Sea
A. Naderi Beni1, H. Lahijani2, R. Mousavi Harami1, K. Arpe3,4, S. A. G. Leroy4, N. Marriner5, M. Berberian6, V. Andrieu-Ponel7, M. Djamali7, A. Mahboubi1, and P. J. Reimer8
1Geology Department, Faculty of Science, Ferdowsi University of Mashhad, Mashhad, Iran 2Marine Geology Department, Iranian National Institute for Oceanography (INIO), Tehran, Iran 3Max Planck Institute for Meteorology, Hamburg, Germany
4Institute for the Environment, Brunel University, UB8 3PH Uxbridge, London, UK
5Aix-Marseille Universit´e, CNRS, CEREGE, UMR6635 – IRD, CEREGE, UMR161 – Coll`ege de France, CEREGE,
13545 Aix en Provence cedex 4, France
6School of Mathematics, Science, and Technology, Ocean County College, Toms River, NJ 08754-2001, USA
7Institut M´editerran´een de Biodiversit´e et d’Ecologie UMR7263 CNRS/Aix-Marseille Universit´e – Europˆole M´editerran´een
de l’Arbois – Pavillon Villemin – BP 80, 13545 Aix-en-Provence Cedex 04, France
8School of Geography, Archaeology and Palaeoecology, Queen’s University Belfast, Belfast, BT7 1NN, Northern Ireland, UK
Correspondence to: A. Naderi Beni (amnaderi@inio.ac.ir)
Received: 13 February 2013 – Published in Clim. Past Discuss.: 12 March 2013 Revised: 31 May 2013 – Accepted: 3 June 2013 – Published: 29 July 2013
Abstract. Historical literature may constitute a valuable source of information to reconstruct sea-level changes. Here, historical documents and geological records have been com-bined to reconstruct Caspian sea-level (CSL) changes during the last millennium. In addition to a comprehensive litera-ture review, new data from two short sediment cores were obtained from the south-eastern Caspian coast to identify coastal change driven by water-level changes and to com-pare the results with other geological and historical findings. The overall results indicate a high-stand during the Little Ice Age, up to −21 m (and extra rises due to manmade river avulsion), with a −28 m low-stand during the Medieval Cli-mate Anomaly, while presently the CSL stands at −26.5 m. A comparison of the CSL curve with other lake systems and proxy records suggests that the main sea-level oscillations are essentially paced by solar irradiance. Although the ma-jor controller of the long-term CSL changes is driven by cli-matological factors, the seismicity of the basin creates local changes in base level. These local base-level changes should be considered in any CSL reconstruction.
1 Introduction
The Caspian Sea (CS) has been characterized by substantial fluctuations during its geological lifetime (Varushchenko et al., 1987; Rychagov, 1997; Dolukhanov et al., 2010). It is be-lieved that climate-induced changes are the main reason for the Caspian sea-level (CSL) fluctuations by influencing the hydrological budget of the sea (Arpe et al., 2000, 2012; Arpe and Leroy, 2007). According to the latitudinal extension of the CS and its watershed from dry low-latitude to temperate high-latitude climates (Fig. 1), and in view of the ongoing global warming, it provides a good opportunity to investigate the impacts of global climate variations on sea level and their socio-economic consequences (G¨umilev, 1980; Dolukhanov et al., 2010). Historical and archaeological documents show that the CS has experienced frequent sea-level oscillations during the historical period. The CSL changes generated marked socio-economic impacts on the surrounding soci-eties such as coastal property destruction, major tribal migra-tions and the rise/fall of civilizamigra-tions (G¨umilev, 1964, 1980; L´etolle, 2000; Rekavandi et al., 2007).
Historical documents may provide valuable informa-tion on Late Holocene geological events such as tsunamis (Dotsenko et al., 2002; Shah-hosseini et al., 2011), earth-quakes (Ambraseys and Melville, 1982; Berberian, 1994; Berberian and Yeats, 1999), climatic variability (Brown, 2001; Okhravi and Djamali, 2003), and sea-level changes (Br¨uckner, 1890; Varushchenko et al., 1987; Karpychev, 2001). The cultural evolution of human societies has mainly occurred during the Holocene that has, in turn, undergone significant environmental changes (Mayewski et al., 2004). Historical and archaeological evidence is therefore particu-larly pertinent in understanding human–environment inter-actions (Berberian et al., 2012).
Holocene Caspian sea-level (CSL) changes have been a key focus of geological research (Mamedov, 1997; Rychagov, 1997; Kroonenberg et al., 2000; Karpychev, 2001; Kazancı et al., 2004; Hoogendoorn et al., 2005; Lahijani et al., 2009; Dolukhanov et al., 2010; Leroy et al., 2011; Kakroodi et al., 2012; Naderi Beni et al., 2013), mostly based on the indirect interpretation of a variety of proxy data.
Direct instrumental measurements of the CSL fluctua-tions only began in the mid-nineteenth century (Leroy et al., 2006). Leroy et al. (2006) showed a good correlation be-tween proxy-based interpretations and instrumental observa-tions starting from 1871 in the K¯ar¯a-Bog¯az Gol on the eastern coast of the Caspian Sea (CS) (Fig. 1). Due to the relatively short time frame of instrumental observations, palaeoenvi-ronmental data contribute to extend the length of the sea-level records, which, in turn, may be accompanied by some uncertainties. One of the ways to decrease the uncertainties relating to the pre-instrumental geological data is to corre-late the results with historical evidence recorded in ancient literature.
Although the history of civilization in the Caspian region dates back to more than 6000 yr ago (Gilbert, 1978), little literature pre-dating the last millennium is available to com-pare and contrast with geological interpretations. In light of this, we here focus on the last millennium (the tenth to twen-tieth centuries AD) to compare the historical events with re-lated geological findings and to independently test the accu-racy of palaeo-environmental data using new data from the south-east CS. Due to insufficient calibration datasets for the chronological data of the CS shells, we try to link the geo-logical findings with historical observations and estimate the exact date of major CSL changes. Moreover, local irregulari-ties such as vertical movements of the coasts, seiche and river avulsions might be partly underpinned by climatically driven sea-level changes. Therefore, historical evidence of the local irregularities has been investigated to show the impacts of the local sea-level changes on estimating the climatically driven CSL oscillations as a secondary objective.
50 45 55 60 35 45 50 40 55 35 45 50 45 40 60 40 20 200 600 20 200600 800 1000 800 Apsheron Sill Strike Slip Fault Kr -Bog z Bay āā ā Turkmenb shi Bayā Cheleken Baku Atrak River Gorgān River Terek River Iraq Sefidrud KuraRiver Aras River Iran Turkmenistan Kazakhstan Uzbekistan Russia Azerbaijan Aral Sea Caspian Sea Black Sea Ural River Volga River Amu-dary ā Turkey Georgia Armenia Water Body International Border River Caspian Watershed Syr-Darya Derbent Ch lusā Kh razm ā Z gros Mountains ā Alborz Mountains Kopeh D gh ā Sarykamish Gol
Mountain City Thrust Fault Ural Oka Volga Terek Sulak Samur Kura Sefidrud Gorgan 60 50 40 40 50 Caspian Sea N Urumiyeh Lake Ardébil Ast rā ā South Caspian basin Middle Caspian basin
North Caspian basin Khazar Fault Tālelsh Caucasus Mountains N E Uzboy pass Ruyān Alamut Lankarān 0 400 km N 35 40 45 50 45 50 55 60
Fig. 1. Modern map of the Caspian Sea and its seaboard countries. The positions of the Aral Sea, the main rivers as well as the re-gion’s main faults are highlighted. The inset on the top left shows the whole watershed area of the Caspian Sea. The inset on the top right shows the recent earthquake epicentres of the region based on Jackson et al. (2002).
2 Geographical setting 2.1 General view
The CS has a surface area of 360 000 km2 and 3.5 mil-lion km2of catchment area and is surrounded by five coun-tries: Iran, Azerbaijan, Russia, Kazakhstan and Turkmenistan (Fig. 1). Due to its vast area, the lake is referred to as a “sea” in the literature. The land-locked nature of the sea has been known since ancient times. Ibn Hawqal (1988, p. 129) stated that: “the Sea is not linked to any other sea and the Atil River [the Volga] discharges into the sea and only this river is con-nected to the Constantine Sea [Black Sea] through one of its branches and if someone goes round the sea, one will return to the starting point”.
The sea is saline and tide free (Ibn Hawqal, 1988, p. 129). The salinity of the sea is one third of that of the oceans and reaches up to 13 psu in the south-east. The CS separated from the open sea during the Pliocene (Varushchenko et al., 1987). Today the CSL is around −26.5 m below mean sea level. Ow-ing to its land-locked nature, the CS has fluctuated repeatedly during its geological lifetime.
36 34 32 30 28 26 24 22 20 18 10 9 8 7 6 5 4 3 2 1 0
Height (meter below sea level)
Age (k years BP)
Present Sea Level
Period of interest
Fig. 2. Caspian sea-level changes during the last 10 000 yr, in un-calibrated radiocarbon ages (Rychagov, 1997). The study period of the present investigation is denoted by the grey shading.
2.2 Caspian sea-level changes
The CS is known for its pronounced sea-level changes at various timescales (Kazancı et al., 2004). During the latest Pleistocene, sea level rose up to ∼ 50 m (Khvalynian Trans-gression) (Mamedov, 1997) and then dropped to at least
−50 m at the beginning of the Holocene (Mangyshlak Re-gression) (Dolukhanov et al., 2010). CSL oscillations dur-ing the Holocene have been estimated by Rychagov (1997, Fig. 2). Apart from these two extensive changes in sea level, at least eight minor oscillations have been recognized for the last 4000 yr (Mamedov, 1997). During the past ∼ 1000 yr, the CS has experienced two major sea-level changes associated with the Medieval Climate Anomaly (MCA: 950–1250) and the Little Ice Age (LIA: 1350–1850) (Ruddiman, 2008). Ac-cording to Kroonenberg et al. (2007) and Leroy et al. (2011), during the MCA the CSL dropped and then during the LIA the sea level rose. CSL changes continued to fluctuate dur-ing the nineteenth and the twentieth centuries. The sea level fell ∼ 3 m from 1929 to 1978, and was followed by a rise of ∼ 2.7 m from 1978 to 1995, at a rate one hundred times faster than the present global sea-level rise (Kroonenberg et al., 2000).
In addition to long-term CSL changes, on several occa-sions, abnormal, alternate rising and lowering of the sea level have been reported in old manuscripts and the recent instru-mental record that could be recorded by some geo-scientists as long-term CSL changes. Some unexpected sudden sea-level fluctuations were possibly related to large-magnitude inland or sea-based earthquakes (Shilo and Krivoshey, 1989; Rodkin, 1992a, b; Ozyavas et al., 2010).
2.3 Geological and seismotectonic setting
The CS intercontinental basin is located on old platforms to the north and the young orogens to the south. The northern part of the depression is located on the Tur¯an in the NE and the Scythian aseismic platforms in the NW. The southern part of the sea, the South Caspian deep basin is surrounded by the
Late Miocene–Pliocene uplifted and overthrust active oro-gens of the Caucasus and T¯alesh (SW), the Alborz (S), and the Kopeh D¯agh (also known as Kopet D¯ag) (SE) (Fig. 1). Lithologically, Kopeh D¯agh comprises sedimentary deposits (mainly limestone), while the Alborz contains igneous and metamorphic rocks (Berberian and King, 1981).
The South Caspian deep basin is a relatively rigid aseis-mic stable block floored by a trapped, modified oceanic crust surrounded by overthrust continental crust (Gegelyantz et al., 1958; Berberian, 1983; Priestley et al., 1994; Mangino and Priestley, 1998). It is being subducted beneath the North Caspian (Fig. 1) along the ¯Apshehron-B¯alkh¯an Sill (Knapp et al., 2004).
Seismological analysis of the central and southern parts of the CS has shown that the most probable area of seismic seiche generation is between the ¯Apsheron-B¯alkh¯an Sill and Derbent in the central Caspian basin (Dotsenko et al., 2002) (Fig. 1). Berberian and Walker (2010) showed that the in-land earthquakes on the southern and western coasts could provide some irregularities in the CSL (see below).
The south Caspian coastal plain lies on the footwall of the Khazar reverse fault (Fig. 1) and is in subsiding mode while the rate of relative vertical movement for the coastal plain is negligible for the last millennium (Djamour et al., 2010). 2.4 Hydrology of the Caspian Sea
The hydrological balance between input and output of the sea controls the sea level (Kroonenberg et al., 2000; Arpe et al., 2012). The sea’s inputs are mainly governed by rivers, discharging from the north, west and south as well as precipi-tation over the sea. The output is mainly controlled by evapo-ration over the sea and the watershed (Arpe and Leroy, 2007; Arpe et al., 2012). This means that the sea-level oscillations are strongly dependent on climatic variations (Kroonenberg et al., 2000), at least as long as no major changes are taking place in the size of the hydrographical basin. The surface area of the Caspian catchment basin is around ten times greater than the CS surface itself (Fig. 1 inset). The latitudinal ex-tension of the sea results in climate variations over the basin from sub-tropical in the southwest to desertic in the east and northeast (Leroy et al., 2011).
The Volga River is the largest river of the CS, discharging from the north (Fig. 1), and presently provides ∼ 80 % of all river influx to the sea.
al-Maqdis¯ı (1982, p. 544) in 985 AD described the south-ern coast of the CS with frequent rivers flowing from the Tus (southern Kopeh D¯agh), Tabarest¯an and Daylam (the Alborz) Mountains (Fig. 1). Although most of the Iranian rivers origi-nate from the northern flank of the Alborz Mountains, the Se-fidrud originates further, in the Z¯agros and the Alborz Moun-tains. The Gorg¯an and Atrak Rivers in the east have headwa-ters in the Kopeh D¯agh (Lahijani et al., 2009) (Fig. 1). The Sefidrud and the Gorg¯an River have developed large deltas along the Caspian coast due to considerable sediment supply,
Gonbad e Kāvus Gorgān Bandar Turkman Khājeh Nafas Gomish ān Behshahr Shāhkileh Ahlam Amol Ch ālus Amirkolā Kiāshahr Anzali Rasht Pirbāzār Astārā Gilān Māzandar ān Golest ān Hassanqoli Bay Turkmenistan Azerbaijan
Caspian Sea
Sāri Rāmsar Gomishān Lagoon Gorgān Bay Anzali Lagoon 0 60 km N Atrak River Gorg ān River Gharasu River Sefidrud Iran Playa Mountain foot RiverCity/Villages referred in text
International Border Province Border A B Coring site Miānkāleh Spit
Border of Geomorphological Zones
37 54 49 37 38.5 49 54 38.5 Lāhijan B bolsar ā Galoug h ā Naushahr Rudb ār Bu’in 1 2 3 4
Fig. 3. The Caspian coast of Iran, with its prominent coastal landforms and major rivers. The cities mentioned in this paper are marked on the map. The morphological zones of the south Caspian coast (Voropaev et al., 1998) are highlighted. 1: Coasts with gentle slopes on the beach and in the nearshore zone. 2: Coasts with gentle slopes on the beach and steep slopes in the nearshore zone. 3: Coasts with steep slopes on the beach and nearshore zone. 4: Coasts with steep slopes on the beach and gentle slopes in the nearshore zone. Core locations are indicated by the star symbol.
and have repeatedly changed their courses (Kousari, 1986; Voropaev et al., 1998). The largest input of sediments in the whole of the CS comes, however, from the Sefidrud (Lahijani et al., 2008). According to Leroy et al. (2007), the Aral Sea and CS were connected episodically during the last millen-nia through the Uzboy pass (Fig. 1) due to sea level fluc-tuations, tectonic events or human intervention. The Uzboy River received water from low latitudes via Amu-darya and discharged into the Caspian Sea in Turkmenb¯ashi Bay around 2200 to 1700 yr BP (Leroy et al., 2007) (Fig. 1).
The winds over the CS produce prevailing southward long-shore currents on the west and east coasts, and eastward currents along the Iranian shoreline (Lahijani et al., 2009; Ibrayev et al., 2010).
2.5 Morphology of the Iranian Caspian coast
The Caspian coastline of Iran stretches over 800 km along the three Iranian provinces of Gil¯an in the west, M¯azandar¯an in the middle and Golest¯an in the east (Fig. 3). According to Voropaev et al. (1998), the Iranian Caspian coast can be classified into four morphological zones based on beach and nearshore gradients (Fig. 3). This classification clearly shows that the southeast corner of the CS has a gentler slope off-shore and on land, and will, therefore, be more sensitive to small changes in sea level.
The Iranian coast of the CS consists of different land-forms and geomorphological features including bays, spits, lagoons and deltas, mainly developed during the Quaternary (Kazancı et al., 2004). Amongst the landforms, the Anzali Lagoon and the Sefidrud Delta in the west and the Gorg¯an Bay, the Gorg¯an Delta, as well as the Gomish¯an Lagoon and the Hassanqoli Bay in the east are the most prominent ones
(Fig. 3), whose formation and evolution are largely driven by the CSL changes coupled with the hydrodynamic regime (Kroonenberg et al., 2007; Kakroodi et al., 2012; Naderi Beni et al., 2013).
3 Material and methods
Two short cores (two meters in length and five cm in diam-eter) were obtained from the southeast of the CS, in front of the Hassanqoli Bay using a vibracorer (Fig. 3). They were taken from the morphological zone 1 of Voropaev et al. (1998), which is the most sensitive area to sea-level changes. The cores were analysed sedimentologically to cor-relate with historical documents as well as other geological findings.
The elevation of the coring sites was measured using an Ashtech Mobile Mapper 100. The magnetic susceptibility (MS) of the core samples was measured using a MS2C core-logging scanner from Bartington. The diameter of the sus-ceptibility meter loop was 10 cm and the progression step was 2 cm. The sensitivity of the meter was about 2 × 10⁻⁶SI. Core samples were split and sub-sampled at the laboratory of the Iranian National Institute for Oceanography (INIO) for sedimentological analysis. A Nabertherm P330 furnace was used for loss-on-ignition to measure organic matter and carbonate content based on the methods outlined in Heiri et al. (2001). Grain-size measurements were made using a Horiba Laser Scattering Particle Size Distribution Analyzer LA-950.
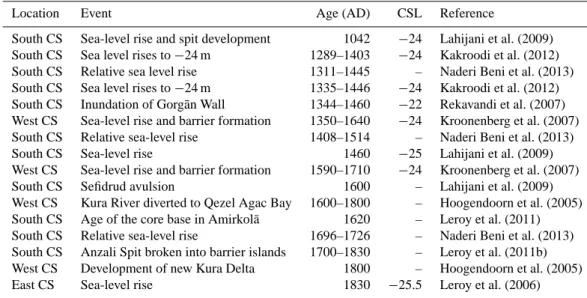
Table 1. Geological findings on the Caspian sea-level (CSL) changes in the Late Holocene. The sea level position is inserted where the data are available.
Location Event Age (AD) CSL Reference
South CS Sea-level rise and spit development 1042 −24 Lahijani et al. (2009) South CS Sea level rises to −24 m 1289–1403 −24 Kakroodi et al. (2012) South CS Relative sea level rise 1311–1445 – Naderi Beni et al. (2013) South CS Sea level rises to −24 m 1335–1446 −24 Kakroodi et al. (2012) South CS Inundation of Gorg¯an Wall 1344–1460 −22 Rekavandi et al. (2007) West CS Sea-level rise and barrier formation 1350–1640 −24 Kroonenberg et al. (2007) South CS Relative sea-level rise 1408–1514 – Naderi Beni et al. (2013)
South CS Sea-level rise 1460 −25 Lahijani et al. (2009)
West CS Sea-level rise and barrier formation 1590–1710 −24 Kroonenberg et al. (2007)
South CS Sefidrud avulsion 1600 – Lahijani et al. (2009)
West CS Kura River diverted to Qezel Agac Bay 1600–1800 – Hoogendoorn et al. (2005) South CS Age of the core base in Amirkol¯a 1620 – Leroy et al. (2011) South CS Relative sea-level rise 1696–1726 – Naderi Beni et al. (2013) South CS Anzali Spit broken into barrier islands 1700–1830 – Leroy et al. (2011b) West CS Development of new Kura Delta 1800 – Hoogendoorn et al. (2005)
East CS Sea-level rise 1830 −25.5 Leroy et al. (2006)
Fossil content was identified to aid in characterizing the past depositional environments based on the atlas of the in-vertebrates of the CS (Birstein et al., 1968).
Two articulated bivalve shells of Cerastoderma lamarcki, an indicator of marine environment, were selected and sent to Poznan Radiocarbon Laboratory for14C dating.
Calendar ages were obtained from the CALIB Rev 6.1.1 software (Stuiver and Reimer, 1993) based on the Ma-rine09 curve (Reimer et al., 2009) with 1 R = 26 ± 69
14C yr (Kuzmin et al., 2007; Olsson, 1980) as well as
based on the IntCal09 curve (Reimer et al., 2009) with RE = 407 ± 2714C yr to compare the results and correlate them with historical findings to get an estimate of the reservoir effect of the sea.
Several historical documents were studied, mainly in the library of the Ferdowsi University of Mashhad, and related geographical names and positions were extracted based on the “Historical Geography of Cities” (Nahchiri, 1999). We have used the most reliable literature sources covering the last millennium. Historical observations of the CS environ-ments were gathered to compare and contrast with geological records for the same period.
Note that in this study the dates are given in AD, unless otherwise stated. The Persian geographic names and other Persian words are written as they are pronounced and were originally written, with direct and simplified transliteration from Persian to English. Diacritical marks and special char-acters are used to differentiate the vowel “A” [short; e.g. ant] from “ ¯A” [long; e.g. R¯amsar], and Arabic “ain” (also used in Persian) as “’A” [e.g. ‘Abb¯as]. Elevations are above or below the present mean sea level. Rud and Darya mean river and Dagh means mountains.
4 Results and interpretation 4.1 Geological findings
The CSL changes and their impact on coastal evolution have been investigated by several researchers e.g. Kroonenberg et al. (2000, 2007), Lahijani et al. (2009), Kazancı et al. (2004), Leroy et al. (2011), Kakroodi et al. (2012) and Naderi Beni et al. (2013). The results of the geological investigations on the CSL are summarized in Table 1.
In this study we focused on two short cores from the south-eastern flank of the CS to compare the results with other ge-ological findings as well as historical evidence.
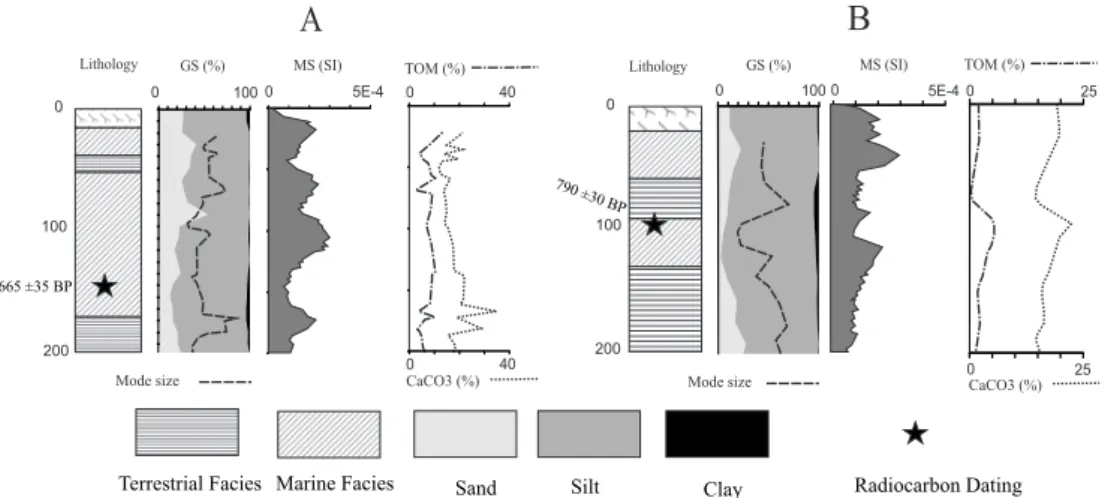
The lithology of the cores shows a succession of terres-trial (fluviodeltaic in Kakroodi et al., 2012) and marine envi-ronments during the last millennium (Fig. 4). Generally, the marine facies comprise finer-grained materials compared to terrestrial deposits based on the modal grain size and contain marine bivalve fossils of Cerastoderma lamarcki. The ter-restrial deposits constitute alternations of thin layers of fine sand, silt and clay, without any fossil content but containing gypsum minerals that are concentrated in some horizons. The presence of gypsum minerals in terrestrial sediments could be related to the flat topography of the region and warm cli-matic conditions that lead to water evaporation during dry seasons. Sea-level rise is indicated by a change from the ter-restrial facies to marine facies. In the marine facies, organic matter and carbonate contents tend to increase due to higher organic activity in shallow marine environment and presence of calcareous shell-bearing organisms (Fig. 4).
The magnetic susceptibility results show lower values in terrestrial deposits (Fig. 4), which could be related to the provenance of the grains or the increase in evaporative
Terrestrial Facies Marine Facies
B
TOM (%) CaCO3 (%) 0 100 GS (%) MS (SI) 200 100 0 25 0 25 790 ±30 BP 0 0 5E-4-A
200 0 100 0 100 665 ±35 BP GS (%) MS (SI) Lithology 0 40 0 5E-4 -0 40 Clay SiltSand Radiocarbon Dating
TOM (%)
CaCO3 (%) Mode size
Lithology
Mode size
Fig. 4. Lithology of two cores taken near Hassanqoli Bay in the southeast of the Caspian Sea. The position of the cores is presented in Fig. 3. The stars denote the dated horizons and the corresponding radiocarbon ages (BP). GS: Grain Size; MS: Magnetic Susceptibility; TOM: Total Organic Matter. The vertical axis is depth in cm.
minerals. Magnetic susceptibility measures the magnetisabil-ity of a material (Dearing, 1999). In sediments, it depends largely on the mineralogy of materials particularly to Fe-bearing minerals as well as the grain size. According to increasing bio-chemical activities in marine environments, which are reflected in the marine deposits, and concentration of Fe-bearing minerals in detrital deposits, which are com-mon in the terrestrial deposits, lower values of magnetic sus-ceptibility are expected of the marine facies in the sediment cores, while the marine facies show higher values of mag-netic susceptibility in the cores. This apparent contradiction could be answered by paying attention to the source of the sediments.
The feeding watercourses have their headwaters in the Kopeh D¯agh that is mantled in calcareous deposits (Berberian and King, 1981). The higher magnetic suscepti-bility values in the marine facies could be linked to the pres-ence of paramagnetic minerals, e.g. muscovite, flogopite and biotite, which are transported by longshore currents from the southern coast of the CS (Ibrayev et al., 2010). The paramag-netic components of the southern coast deposits are provided by igneous and metamorphic rock outcrops of the Alborz Mountains (Lahijani and Tavakoli, 2012).
According to the presence of some brackish water gas-tropods such as Theodoxus palassii, as well as Charophytes that coexist with marine gastropods Horatia marina and
Pyr-gohydrobia sp. and the marine bivalve Cerastoderma lamar-cki (Birstein et al., 1968), it seems that the marine facies
could represent a shallow marine environment and/or an open lagoon that was influenced by fresh-water input. The forma-tion of barrier-lagoon complexes during rapid sea-level rise has been reported by Kroonenberg et al. (2007), Lahijani et al. (2009) and Naderi Beni et al. (2013) in different parts of the Caspian coast and, therefore, it is more probable to link
the marine facies to an open lagoon environment which was influenced by fresh water input.
4.2 Radiocarbon dating
The age of the oldest marine facies of cores A and B (Fig. 4) is dependent on the reservoir effect (RE), which has been estimated differently in various studies: from 290 to 400 yr (Leroy et al., 2011). For example, some of the reported RE ages are: 345 to 38414C yr in Karpychev (1993), 29014C yr in Kroonenberg et al. (2007), 390–44014C yr in Kuzmin et al. (2007), and 38314C yr in Leroy et al. (2007). Although almost all of the chronological data are coincident with the LIA in the North Atlantic Ocean and already recorded in the CS by a high-stand (Leroy et al., 2011 in Gil¯an, and Kakroodi et al., 2012 in Golest¯an), they could be linked to different sea-level rise episodes between the fifteenth and the nineteenth centuries, depending on the reservoir age used in calibrating the radiocarbon dates.
The chronology was based on shell dating because: (1) the shells are the most abundant material in the cores for dat-ing; (2) by choosing articulated shells, the risk of trans-porting and reworking is minimal; (3) of the possibility to compare the dating results with previous works such as Rychagov (1997), Karpychev (1998, 2001), Lahijani et al. (2009), Leroy et al. (2011, 2013) and other researchers who mostly dated the sea-level changes based on shell chronology; finally (4) of the possibility to correct for the RE by using the Marine09 curve with an appropriate regional correction 1R when calibrating the age of marine samples. Since the CS is not connected to the global ocean and turns over annually, it is unclear whether it is more appropriate to use the atmospheric calibration curve (IntCal09) with the sample age corrected by subtracting RE and including the
-27 -26 -25 -24 -23 -22 -21 1700 1750 1800 1850 Fedchina (1980) Komarova (1980) Years (AD) CSL(m) 1725 1775 1825
Present Sea Level
Fig. 5. The Caspian sea-level (CSL) changes during the eighteenth century and first half of the nineteenth century (Fedchina, 1980) and the sea-level curve from Komarova (1980) based on Russian cartographic maps.
uncertainty in RE in the error, so both approaches are used here and compared (Table 2).
According to the elevation of the coring site (Table 2), it seems that sea level in dating horizons reached −26.75 and
−25.8 m for cores A and B, respectively, as the subsidence of the region has been negligible during the last millennium. 4.3 Historical evidence
The CSL variability before the instrumental observations (prior to 1850) was investigated by Br¨uckner (1890) on the CS coast. He used a wide range of observational evidence, e.g. travel descriptions, navigation maps, and paintings to garner data on CSL changes. Typical examples were walls along the shore with markings of sea levels, reports about buildings that disappeared under the water, and islands that emerged or disappeared. The results of Br¨uckner (1890) are summarized in Table 3.
Fedchina (1980) used the Russian cartographic data from 1556 to 1925 to reconstruct a CSL curve. The same method was followed by Komarova (1980) for the time period be-tween 1700 to 1850. The results of Fedchina (1980) and Ko-marova (1980) are summarized for the period 1700 to 1850 in Fig. 5. In spite of some differences between their analy-ses, the results generally show a good agreement in the CSL changes during the time period with high-stands up to −22 m (Fig. 5).
Varushchenko et al. (1987) used a wide range of historical, archaeological and geological evidence to reconstruct CSL changes for the last 2400 yr. Many historical and archaeolog-ical documents used by Varushchenko et al. (1987) for the last millennium are the same as those that Br¨uckner (1890) and Komarova (1980) considered in their work (Table 4).
-37 -36 -35 -34 -33 -32 -31 -30 -29 -28 -27 -25 -24 -23 -26 -22 -21 -20 900 9501000 1050 110011501200 1250 1300 13501400 14501500 1550 1600 1650 1700 17501800 1850 1900 1950 2000
Caspian Sea Level (m)
Years (AD) -19 -18 -17 -16 Karpychev (1998, 2001) Bruckner (1890) Present sea level
Varushchenko et al. (1987)
Fig. 6. The Caspian sea-level curve based on Br¨uckner (1890), Varushchenko et al. (1987) and Karpychev (1998, 2001). The dashed lines connecting the filled symbols are interpolations. The continuous line from 1850 to 2000 shows the instrumental obser-vations. A −26.5 line, the CSL in 1995, was added as a reference level to compare the different levels over the past millennium. The Medieval Climate Anomaly (MCA) and the Little Ice Age (LIA) are indicated by shaded boxes.
However, their results have many differences, particularly in the early centuries of the last millennium.
Lithological evidence from coring along the Caspian coastline was investigated by Karpychev (1998) and com-bined with historical information (Karpychev, 2001) for lay-ers of pebbles, for instance, which are an indication for shores at that level and for which the age was determined by radiocarbon dating. The results of Karpychev (1998, 2001) are summarized in Table 5.
Based on the results of Tables 3, 4 and 5, the CSL curve has been plotted from the tenth to the twentieth centuries (Fig. 6).
The Iranian literary texts are especially rich in statements pertinent to understanding the historical geography and ge-ological events of the Iranian Plateau and its neighbouring regions (e.g. Berberian, 1994; Okhravi and Djamali, 2003). Here, we present historical literature related mainly to the south CS to elucidate evidence of CSL changes during the last millennium split into three periods: the ninth to four-teenth centuries, the sixfour-teenth and sevenfour-teenth centuries, and the eighteenth to twentieth centuries.
4.3.1 The Caspian Sea level during the ninth to fourteenth centuries
One of the most important cities of the Caspian coasts in ancient times was ¯Abeskun/ ¯Abaskun (Figs. 7, 8), which ap-parently disappeared in the early fourteenth century due to sea-level rise (Mostowfi, 1999, p. 239). Nedjati (in G¨umilev, 1980) described how the port of ¯Abeskun was flooded and swallowed up by the sea in 1304 in agreement with other reports of a CSL high-stand (Tables 3 and 4). al-Istakhri
Table 2. AMS radiocarbon dating of the sediment cores. The 2σ (95.4 %) calibrated age ranges are based on the Marine09 curve with an average 1R = 26 ± 6914C yr (Kuzmin et al., 2007; Olsson, 1980) and on IntCal09 curve with a reservoir effect (RE) of 407 ± 2714C yr subtracted with the probabilities shown in parentheses. For core location, see Fig. 3.
Core No. Lab. No Elevation (m) Depth of sampling (cm) Type of material Radiocarbon Age (yr BP) Calibrated Age (yr AD) for 2σ range Marine09,
1R = 26 ± 69*
Calibrated Age (yr AD) for 2σ range IntCal09, RE = 407 ± 27*
Calibrated Age (yr AD) for 2σ range IntCal09, RE = 383** A Poz-51062 −25.3 145 Articulated bivalve 665 ± 35 1496–1872 (1) 1490–1682 (0.8) 1737–1803 (0.2) 1486–1604 (0.68) 1607–1664 (0.32) B Poz-51060 −24.8 100 Articulated bivalve 790 ± 30 1437–1681 (1) 1440–1529 (0.6)-1543–1634 (0.4) 1433–1521 (0.86) 1591–1621 (0.34)
* Average weighted mean RE, 1R, and standard deviation for five known age data points in the Caspian Sea (Kuzmin et al., 2007; Olsson, 1980). Cal age ranges with gaps of 10 years or less have been combined for IntCal09 calibrations. Relative probability is given in parentheses. ** RE = 383 (Leroy et al., 2007).
Table 3. Dates, type of historical evidence and the Caspian sea-level summary from the tenth to nineteenth centuries (Br¨uckner, 1890). Caspian
sea-Year Information level (m)
915–921 6 projections in the wall at the fort in Derbent reached into the sea −17.4 1100–1150 Building of a caravanserai near Baku which was submerged later < −30.4 1306–1320 Tomb of Sheik Zahed in Lankar¯an in danger of flooding < −16.0 1400 Mosque in Baku (but some doubts) −21.4 1556 Navigation at Volga exit to Caspian Sea (less reliable) −24.7 1638 Markings on fort wall in Derbent −21.3 1715–1720 Many sources 1715 lowest level −25.9 1735–1743 Many sources 1723 to 1743 rise by 2.4 m −22.7
1754–1766 Many sources −22.75 1767–1780 Many sources −22.65 1805 Many sources −22.7 1816 Many sources −23.8 1830 Many sources −25.8 1843–1846 Many sources −26.7 1847 Many sources −26.0 1851–1855 Many sources −26.4 1856–1860 Many sources −26.47 1861–1865 Many sources −26.39 1866–1870 Many sources −26.01 1871–1875 Many sources −26.03 1876–1878 Many sources −25.66
(1961, p. 173) in the tenth century described ¯Abeskun as the best port in the CS. The tenth century historians and geogra-phers such as al-Mas’¯ud¯ı (2012, p. 25/2), al-Istakhri (1961, p. 173) and Ibn Hawqal (1988) reported ¯Abeskun as a port, while the later geographers like Jovayni (1911, p. 115/2) in the thirteenth century and Ban¯aketi (1969, p. 240) and Mostowfi (1999, p. 239; possibly compiled older treatises) in the fourteenth century described it as an island. According to the dates of the descriptions, it seems that an important change in the CSL occurred during this time period. When
sea level was relatively lower during the ninth and tenth cen-turies, ¯Abeskun lay on the shoreline, whereas when the sea level rose in the thirteenth and fourteenth centuries it was surrounded and then flooded by the sea.
Barthold (1984) speculated that the location of ¯Abeskun is consistent with the present Gomish¯an, which lies at about
−23.5 m elevation, in line with the level by Karpychev (1998, 2001) in 1304 (Table 5). G¨umilev (1964) assumed that the CSL was at –33 m in the tenth century and rose to −28.5 m in the eleventh century based on al-Istakhri’s observation
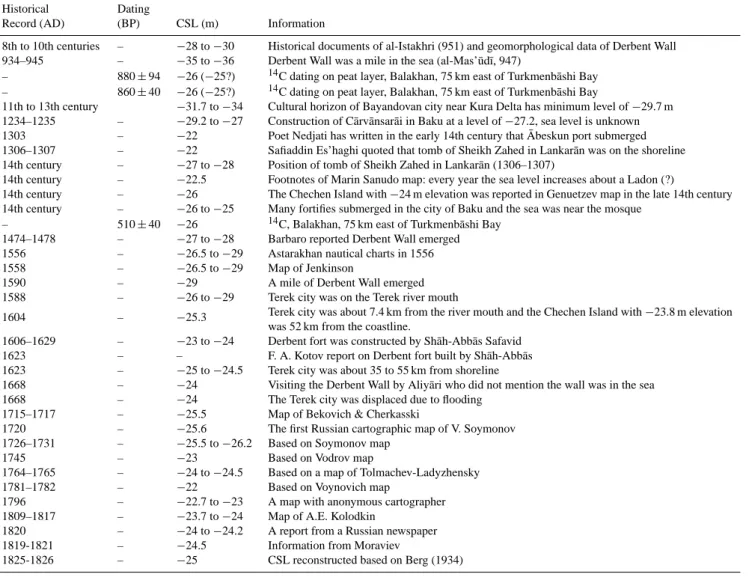
Table 4. Dates, type of historical and geological evidence and the Caspian sea-level summary from the tenth to nineteenth centuries (Varushchenko et al., 1987).
Historical Dating
Record (AD) (BP) CSL (m) Information
8th to 10th centuries – −28 to −30 Historical documents of al-Istakhri (951) and geomorphological data of Derbent Wall 934–945 – −35 to −36 Derbent Wall was a mile in the sea (al-Mas’¯ud¯ı, 947)
– 880 ± 94 −26 (−25?) 14C dating on peat layer, Balakhan, 75 km east of Turkmenb¯ashi Bay – 860 ± 40 −26 (−25?) 14C dating on peat layer, Balakhan, 75 km east of Turkmenb¯ashi Bay
11th to 13th century −31.7 to −34 Cultural horizon of Bayandovan city near Kura Delta has minimum level of −29.7 m 1234–1235 – −29.2 to −27 Construction of C¯arv¯ansar¯ai in Baku at a level of −27.2, sea level is unknown 1303 – −22 Poet Nedjati has written in the early 14th century that ¯Abeskun port submerged 1306–1307 – −22 Safiaddin Es’haghi quoted that tomb of Sheikh Zahed in Lankar¯an was on the shoreline 14th century – −27 to −28 Position of tomb of Sheikh Zahed in Lankar¯an (1306–1307)
14th century – −22.5 Footnotes of Marin Sanudo map: every year the sea level increases about a Ladon (?)
14th century – −26 The Chechen Island with −24 m elevation was reported in Genuetzev map in the late 14th century 14th century – −26 to −25 Many fortifies submerged in the city of Baku and the sea was near the mosque
– 510 ± 40 −26 14C, Balakhan, 75 km east of Turkmenb¯ashi Bay 1474–1478 – −27 to −28 Barbaro reported Derbent Wall emerged 1556 – −26.5 to −29 Astarakhan nautical charts in 1556 1558 – −26.5 to −29 Map of Jenkinson
1590 – −29 A mile of Derbent Wall emerged 1588 – −26 to −29 Terek city was on the Terek river mouth
1604 – −25.3 Terek city was about 7.4 km from the river mouth and the Chechen Island with −23.8 m elevation was 52 km from the coastline.
1606–1629 – −23 to −24 Derbent fort was constructed by Sh¯ah-Abb¯as Safavid 1623 – – F. A. Kotov report on Derbent fort built by Sh¯ah-Abb¯as 1623 – −25 to −24.5 Terek city was about 35 to 55 km from shoreline
1668 – −24 Visiting the Derbent Wall by Aliy¯ari who did not mention the wall was in the sea 1668 – −24 The Terek city was displaced due to flooding
1715–1717 – −25.5 Map of Bekovich & Cherkasski
1720 – −25.6 The first Russian cartographic map of V. Soymonov 1726–1731 – −25.5 to −26.2 Based on Soymonov map
1745 – −23 Based on Vodrov map
1764–1765 – −24 to −24.5 Based on a map of Tolmachev-Ladyzhensky 1781–1782 – −22 Based on Voynovich map
1796 – −22.7 to −23 A map with anonymous cartographer 1809–1817 – −23.7 to −24 Map of A.E. Kolodkin
1820 – −24 to −24.2 A report from a Russian newspaper 1819-1821 – −24.5 Information from Moraviev
1825-1826 – −25 CSL reconstructed based on Berg (1934)
in Derbent, in present-day Dagestan, Russia (Fig. 1). Also, Varushchenko et al. (1987) reported about such a rise but from −35 to −33 m. The eleventh century sea-level rise reduced the area of the Volga Delta and endangered the Kingdom of Khazaria due to the reduction of its farmlands (G¨umilev, 1964).
Ibn Hawqal (1988, p. 125) described ¯Abeskun’s air as mal-odorous and full of mosquitoes, which could be linked to the presence of marshlands and/or lagoons. The town was popu-lous and repeatedly invaded between 880 and 913 by Russian tribes (al-Mas’¯ud¯ı, 2012, p. 20/2). Al-Bakri (1999, p. 31) de-scribed ¯Abeskun as a small village on the Caspian shoreline in 1208. In 1219 it was disturbed due to an increase of the CSL which Mostowfi (1999, p. 239) and L´etolle (2000) as-signed to the man-made avulsion of the ¯Amu-dary¯a towards the CS by the Mongols (sons of Genghis Khan). The sug-gestion of Mostowfi (1999), linking the ¯Abeskun flooding
to the river avulsion, could also be possible as the largest observed amount of the Amu-Dary¯a discharge in the 20th century (around 98 cubic kilometres per year) to flow into the CS, raised the CSL by 2 m. The Italian traveller Marin Sanudo (1320, in G¨umilev, 1980) mentioned that the sea-level rise in the early fourteenth century was catastrophic and destroyed many important cities around the CS. The 1304 rapid sea-level rise accentuated the demise of the Khazars dominion on the northern coast of the CS (G¨umilev, 1980). Berg (1949, in G¨umilev, 1980) reported that the CSL rise in the fourteenth century could not have reached more than
−24 m, while G¨umilev (1980) believed that the sea level rose up to −19 m based on articulated bivalve shells, dated to the fourteenth century, on a historical wall near the Terek River, Russia.
Jayh¯ani (1989, p. 146) noted that at the end of ninth cen-tury, in an area between M¯azandar¯an and Gil¯an (near the
Table 5. Summary of the dates of the Caspian sea level based on his-torical documents and uncalibrated radiocarbon ages (Karpychev, 1998, 2001).
Year Information CSL (m) 600–900 Silt in Turkmenb¯ashi Bay −28 to −31 800–1300 Dating <33 1234 Building of a caravanserai in Derbent < −31
which was submerged later
1300–1304 Dating −28.5 1305–1306 Settlement of Bayandovan was flooded −28 1300–1400 Dating rise to −24 1380–1395 Dating −29.0 1430–1450 Dating −26.0 1480–1490 Dating −31.0 1550–1680 Dating −22.0 1587–1606 A tower was added to a wall near the −28.5
water line in Derbent
1710–1720 Dating −26.0 1740–1750 Dating −24.5 1740–1750 Many lines of historical evidence −23 1760 Underwater fortification <23 1770–1790 Dating −25.0 1795–1810 Dating −22.0 1850–1900 Dating −25.0
present city of R¯amsar, Fig. 3) the sea and the mountains were in contact and the only way to cross the area was through the mountains. This observation is supported by Ibn Hawqal (1988, p. 120) who noted that “Ch¯alus is the
en-trance of Daylam (Gil¯an) and the city opens to the sea and
only one guardsman is enough to close the way” (Fig. 8). To-day, the foothills of the Alborz Mountains extend to the sea at −23 m in R¯amsar, just at the border of M¯azandar¯an and Gil¯an. According to the above-mentioned reports, it seems that the CSL in the tenth century rose up to ≤ −23 m and the sea level was more or less around the same level until the thirteenth century. This is corroborated by the position of
¯
Abeskun that remained a port from the ninth to the thirteenth centuries. After this time, the sea level started to rise around 1208 and finally reached −19 m in the fourteenth century (G¨umilev, 1980).
About 250 km north of ¯Abeskun a populated region was known as the Dahest¯an District (Barthold, 1984). Accord-ing to the approximate position of ¯Abeskun in Gomish¯an (Barthold, 1984; Rabino, 1917), the Dahest¯an District could be somewhere around the present Turkmenb¯ashi Bay (Fig. 1), where Barthold (1984) claimed that he found an-cient ruins of the city in Qezel ¯Arv¯at, tens of kilometres from the shoreline (the exact position is not yet known).
al-Maqdis¯ı (1982, p. 525) mentioned that the Dahest¯an District comprised 24 villages and the capital of the dis-trict was ¯Akhor on the Caspian shoreline. Ibn Hawqal (1988, p. 130) remarked that the sea level started to fall in 977 when he met ¯Akhor as the sea became shallow and let the ship and boats use it as a shelter during stormy conditions.
Barthold (1984) reported that people in the tenth century constructed a 50 km-long channel from the Atrak River to Dahest¯an to provide fresh water to its people.
The anonymous writer of the Hudud al-‘Alam (written in 982; 1973, p. 46) highlighted that in 982 the CS did not have any bays but it had two islands; one of them was known as Si¯ah Kuh. The other island was on the western side of the CS in front of B¯ab (Fig. 7) and was called the Jazirat al B¯ab (B¯ab Island). It is reported in Hudud al-‘Alam (1973, p. 47) that a peninsula existed in front of Dahest¯an, named Dahest¯an¯an-Sar (the Dahest¯an Cape) and it was a place for hunting. This report may support the approximate position of the Dahest¯an District around Turkmenb¯ashi Bay as the Cheleken penin-sula (Fig. 1), at ca. 50 m in elevation, could be considered as the Dahest¯an Cape. The report of the Hudud al-‘Alam (1973) is supported by Ibn Hawqal (1988, p. 129), who referred to Si¯ah Kuh Island as Siah Kubeh (Fig. 7). He also located the B¯ab Island in front of the Kur River (Kura River, in mod-ern Azerbaijan). Ibn Hawqal (1988, p. 129) wrote that the B¯ab Island was a grazing land and locals brought their cat-tle to the island to fatten them. If this is true, then the water between the island and main land was possibly shallow. Ac-cording to the position of the B¯ab Island (Fig. 7), this island could be consistent with Chechen Island with −23.8 m ele-vation (Varushchenko et al., 1987), which was reported by other historians such as Genuetzev (in Varushchenko et al., 1987).
Although Ibn Hawqal (1988) and the Hudud al-‘Alam (1973) described only two unoccupied islands in the tenth century, al-‘Umar¯ı (2010) in 1349 remarked that several is-lands existed in front of the city of Rasht and people used them as a haven when they were attacked by pirates.
Mostowfi (1999, p. 142) mentioned that a bay existed on the south-eastern flank of the CS, near ¯Abeskun and called it the Nim-mard¯an Bay (the Half-men Bay). According to his remarks, the Gorg¯an River discharged close to ¯Abeskun into the bay. Attributing the name of Nim-mard¯an to the bay could be interpreted as a shallow-water bay in which fisher-men could stand in order to fish (Nahchiri, 1999), the same way as fishermen do today in Gomish¯an. Nahchiri (1999) also believed that Nim-mard¯an Bay is the present Gorg¯an Bay. However, based on other historical evidence, the pro-posed position of ¯Abeskun by some geographers (Barthold, 1984; Rabino, 1980) and new geological findings from the Gorg¯an Bay (Kakroodi, 2012) mean that Nahchiri’s sug-gestion seems unlikely. It is, therefore, more likely to link Nim-mard¯an Bay to the present Hassanqoli Bay (Fig. 3). 4.3.2 Caspian sea level during the sixteenth to
seventeenth centuries
In 1628 Ashraf al-Bel¯ad (the Ashraf port) was constructed on the southern flank of the Gorg¯an Bay (present-day Behshahr; Fig. 3) (Parodi, 1997). The remains of an old port of the Safavid era (1501–1722) were found at an altitude
N
Daylam Mountains
Tabarestān Mountains Atil River (Volga)
Gorgān (Gonbad Kāvus) Abeskun Ahlam Chālus Aras River Kur River Moghān (Astārā) Atil Siāh Kuh Island Bāb (Derbent) Bāb Island
Fig. 7. The tenth century map of the Caspian Sea by Ibn Hawqal (1988). The map was rotated to show the north at the top and some of the names have been translated into English. ¯Abeskun, Gorg¯an, Ahlam and Ch¯alus were described as the most important ports of the south Caspian Sea by the tenth century geographer.
of −23.5 m in the plain of Behshahr, south of Sh¯ahkileh (Asgari, 1971) (Fig. 3), which could be linked to this in-formation. The seventeenth century sea-level rise was men-tioned by Kotov, a Russian entrepreneur who described the inundation of a castle in Derbent in 1623 (G¨umilev, 1980). This castle was built on the site of the Sasanian fortified town in 1587, and the remains of the structure were found at −28 m by Russian archaeologists (G¨umilev, 1980).
According to the above-mentioned reports, it seems that sea level rose to −23 m in the seventeenth century after a sea-level fall during the sixteenth century (see also Br¨uckner, 1890; Table 3).
4.3.3 Caspian sea level during the eighteenth to twentieth centuries
Changes in the position of the Caspian’s shoreline have been mentioned in more recent literature such as Farh¯ad Mirz¯a (1987, p. 26) who stated that a royal tower, built in 1868 in Anzali (Fig. 2), was subsequently threatened by sea water in 1875. According to Rabino (1917), the building was demol-ished in 1913. The modern watchtower of the Anzali port has been built near the same position at about −25 m elevation on a concrete foundation (www.anzali.ir).
Due to its vast area, the Anzali Lagoon was described as a bay by Gmelin in 1771 (Rabino, 1917). This suggests a higher CSL in 1771 than today, previously reported by Br¨uckner (1890) at −23 m elevation. Abbott (1858) indicated that Anzali water was influenced by sea waves during his stay in Gil¯an from 1847 to 1848. Eastwick (1864 in Rabino, 1917) explained that the coastal plain of Anzali was flat be-cause during storm conditions the lagoon water surged onto
the land without any obstacle, destroying boats in Anzali as well as the more inland site of Pirb¯az¯ar near Rasht (Fig. 3).
Rabino (1980) wrote that the Gorg¯an Bay was the safest place in the CS for ships, and followed that from 1860 to 1906 the area of the Gorg¯an Bay had been dramatically re-duced. According to his report, the Galug¯ah farmlands on the southern coast of the Gorg¯an Bay (Fig. 8) were completely inundated in 1815. This information supports Moraviev’s ob-servation (in Rabino, 1980), reporting that Gomish¯an was an island in 1815, while the city was 3 km from the shoreline when Rabino visited the city in 1906. A high-stand at and before 1805 with values of −22.7 and −22.0 m were also reported by Br¨uckner (1890) and Karpychev (2001), respec-tively (Fig. 6).
It seems that the CSL underwent fluctuations from 1771 to 1900 and that the area of the Anzali Lagoon and Gorg¯an Bay changed in accordance with these fluctuations, as their surface area reduced during low stands and increased during high-stands.
4.3.4 Unexpected Caspian sea-level fluctuations Tusi (1966, p. 82), in 1160 noted that: “Earthquakes can cause disturbances along the shorelines, and the properties close to sea shake and are impacted by the water and waves. I have heard from people of Gil¯an that the Kabud¯an [Blue] Sea was agitated by high tides, the city of Ard´ebil was shaken; and the distance of Ard´ebil to the Kabud¯an Sea is 12 farsangs (∼ 72 km)”.
The “Kabud¯an Sea” (the Blue Lake) is the ancient name of the Lake Urumiyeh (Fig. 1), but it is located about 240 km to the west of Ard´ebil, while the CS is located 55 km to the east of Ard´ebil. The author seems to be confused with the correct names of the seas. It is probable that the people of Gil¯an were referring to the 958 Ms∼7.7 Ruy¯an (central
Alborz) earthquake (Ambraseys and Melville, 1982; Berbe-rian, 1994; Berberian and Yeats, 1999, 2001), which might have caused some changes in the CSL. It seems unlikely that the reference is made to the 957 M ∼ 5.5 Derbent earthquake (Kondorskaya and Shebalin, 1977, 1982, p. 71), because of the much lower magnitude and farther distance of the latter to the south Caspian shore.
Based on the publication by Kazin (1974), who gave the year 915, and Nikitin (1974) citing the period 915–921, Kon-dorskaya and Shebalin (1977, 1982, p. 71) reported that dur-ing the 918 Ms∼5.5 earthquake in Derbent (Fig. 1), the
Caspian shore with the fortress walls sank. This event def-initely caused abnormal waves in the Derbent area of the western CS. On the authority of Nikitin (1963) who dates the event to 968, Kondorskaya and Shebalin (1977, 1982, p. 71) reported an earthquake in 957 with Ms∼5.5 in the
west Caspian where the sea experienced horizontal displace-ment of the shoreline towards the sea by around 150 m from its normal position.
The 20 April 1608 Ms∼7.6 Alamutrud (West Alborz)
earthquake, about 55 km to the SW of the CS shore (Berberian and Walker, 2010), caused large waves in the CS, which crashed up the coast and resulted in great alarm among men and animals (Ambraseys and Melville, 1982).
Abnormal fluctuations were also observed at Baku, Lankar¯an and the southern Caspian shore, where sea level oscillated within the space of an hour by fifty to more than a hundred centimetres in 1868 and 1960 (Hedin, 1892; Mus-ketov and Orlov, 1893; Ambraseys and Melville, 1982).
Large sea waves were also observed at ¯Ast¯ar¯a associ-ated with the 4 December 1910 Ms5.4 Mogh¯an earthquake
(Kondorskaya and Shebalin, 1977, 1982, p. 99). Large sea-waves were noticed all along the southern Caspian coast from Mi¯ank¯aleh in the east to Anzali in the west (Ambraseys and Melville, 1982) during the 11 July 1890, Ms∼7.2 T¯ash
earthquake in the east Alborz, about 60 km to the SE of the Caspian shore.
Sea waves flooded the coast of the Cheleken Island dur-ing the 8 July 1895 Ms7.5 Krasnovodsk (Qezel Suyu,
Turk-menb¯ashi) earthquake on the eastern Caspian shore (Kon-dorskaya and Shebalin, 1977; Ambraseys, 1997). The wa-ter in the harbour quickly swelled and reached the railroad tracks. A ship 30 km from Krasnovodsk reported that the sea swelled with the shock and ejected a column of water and smoke (possibly linked to the eruption of a submarine mud-volcano).
During the 1 September 1962 Mw7.0 Bu’in earthquake,
which took place 142 km to the SW of the Caspian shore, some irregularities in the behaviour of the water level of the CS were noticed at the Anzali, Naushahr and B¯abolsar ports, where waves followed the earthquake. The tide gauge records at the Anzali port showed abnormal variations in sea level before and after the earthquake; waves with amplitudes of nearly two feet and periods between 15 and 50 min were recorded. At the Naushahr port, a series of swells had been reported but made no noticeable damage. In addition, the morning after the earthquake, the CS was muddy for more than a nautical mile (Ambraseys, 1962, 1963).
The 20 June 1990 Mw7.3 Rudb¯ar earthquake (Berberian
et al., 1992; Berberian and Walker, 2010), which was much larger than the 1962 Mw 7.0 Bu’in earthquake, and its
epi-centre was closer to the CS (about 68 km to the SW of the Caspian shore vs. 142 km), should have caused unusual fluc-tuations in the CS, much greater than the 1962 event. Un-fortunately, our efforts in obtaining the hourly/daily records from the south CS failed because the gauge station was de-stroyed during the earthquake.
4.3.5 Other historical findings
Ibn Hawqal (1988, p. 141) in the tenth century described the Aral Sea (Fig. 1) as a salt lake that had not been freshened even by the ¯Amu-dary¯a water: “Although considerable water from the Jayhun River ( ¯Amu-dary¯a) discharges into the lake,
the area of the lake has not been increased and the water is not freshened and people believe that the lake is connected to the CS via an underground channel”. Although this is cor-roborated by the Hudud al-‘Alam (1973, p. 55), Mostowfi (1999, p. 239) mentioned that the Jayhun River ( ¯Amu-dary¯a) was diverted from the Aral Sea towards the CS by the sons of Genghis Khan when they surged towards Iran in 1219 (L´etolle, 2000).
Mar’ashi (1982, p. 134) quoted that during the invasion of M¯azandar¯an by Uzbeks in 1392, the army invaded ¯Amol (Fig. 8), then arrested people and after that transferred them to Kh¯arazm by ship from the CS and the Jayhun River. This story indicates that ¯Amu-dary¯a was discharging into the CS at that time via the Uzboy waterway. According to Barthold (1984), this waterway was open until the late six-teenth century.
In addition to the above-mentioned river avulsion, some reports of other Caspian rivers provide useful information on the south Caspian river courses.
The Sefidrud was reported as the largest river on the south Caspian coast in the Hudud al-‘Alam (1973, p. 149). Ac-cording to this report (written in 982), the people of Gil¯an could be categorized into two groups, the first group set-tled between the river and the Sea i.e. Rasht, while the other group was situated between the river and the mountains i.e. Lahij¯an (Fig. 1). Regarding the East–West direction of the Alborz Mountains (Fig. 1), this categorization is true when the river direction is parallel to the mountains and flows east-ward on the plain. Rabino (1917) stated that in 1740 a large tributary separated from the Sefidrud, 6 km south of the river mouth, and discharged into the Anzali Lagoon, and that this tributary was large enough to enable ships to carry passen-gers from Anzali to Pirb¯az¯ar near Rasht. This tributary could be navigated in 1875 because Farh¯ad Mirz¯a (1987) used it in his journey to Europe. Barthold (1984) mentioned that the tributary was called Sh¯ahrud and discharged into the Anzali Lagoon at the beginning of the twentieth century. At present, this tributary is abandoned.
The Gorg¯an River, on the south-eastern flank of the CS (Fig. 8), according to Rabino (1980), discharged into the Gorg¯an Bay before 1854 near B¯ash Youzki (the present Ban-dar Turkman, Fig. 1). Then the river avulsed northward and split into two tributaries. In 1886 the southern branch of the river was completely abandoned and the river discharged into the CS at Kh¯ajeh Nafas where it still meets the sea to this day. According to this account, the present delta of the Gorg¯an River has been in formation since just 1854.
5 Discussion
5.1 Caspian sea-level during the last millennium The CSL during the tenth century is the most controversial time period for the last millennium as it has been reported
Table 6. Historical earthquakes in the Caspian Sea region and the observed consequences on the sea level (Modified after Dotsenko et al., 2002).
Year (AD) Location Evidence
918 Derbent Part of the coast with fortifications was submerged in the sea.
957–972 Derbent The fall of sea level caused horizontal displacement of the shoreline by around 150 m from its original position. 958 Ruy¯an The Caspian Sea in Gil¯an was agitated by high tides.
1668 Terka The sea submerged part of the beach. The rise of water level was observed in the delta of the Terek River. 1868 B¯aku Short-term rise and fall of sea level with an amplitude of about 0.45 m were observed.
1876 Oblivnoy (island) Unusual sea-level oscillations occurred after strong underwater explosion in conditions of dead calm. Event was observed from the ship.
1890 T¯ash Large sea waves were noticed along the Caspian coast of Iran.
1895 Cheleken Island Flooding of north and west areas of Uzun-Ada as a result of a rise in water level in the bay. Large waves caused flooding of buildings and the dock. A few wooden houses were washed out to sea. Pipeline was destroyed. 1902 B¯aku Unusual waves resulted in dangerous motion of ships in the port. The event was observed after a destructive
earthquake near Shimaha.
1910 Mogh¯an Large sea waves were observed in ¯Ast¯ar¯a. 1933 Kuuli-Mayak Sudden rise of sea level up to 1.35 m for 10 min.
Fishing boats and equipment were washed out to sea.
1939 Livanov Shoal The passing of a solitary large wave was observed from two ships that were 15 miles apart. 1960 B¯aku Sea-level oscillations up to 1 m were observed for 2–3 h.
1962 Bu’in Irregularities were noticed at Anzali, Naushahr and Babolsar ports.
1986 Livanov Shoal Unusual high-frequency sea level oscillations of 2–3 cm amplitude were observed over the earthquake for 1– 1.5 min. The event was fixed from the seiner and 45 fishing ships.
at less than −35 m by Varushchenko et al. (1987), −33 m by G¨umilev (1980) and Karpychev (1998, 2001) up to more than −17 m by Br¨uckner (1890) during the early tenth cen-tury (Fig. 6). Because the shoreline accommodating the fort walls in Derbent sank due to the 918 earthquake (Kazin, 1974; Nikitin, 1974) (discussed earlier), the sea-level posi-tion menposi-tioned by Br¨uckner (1890) for 915 to 921 (Table 3) could partially be related to coastal subsidence rather than sea-level rise. As Br¨uckner (1890) compared paintings of that period with those in 1638 and estimated the CSL difference between both periods from how many projections in the wall were reached by water (6 in 915–921 and 3 in 1638), it is also possible that the wall might have been altered. According to the existence of ¯Abeskun as a port from the beginning of the ninth century (al-Istakhri, 1961; Ibn Hawqal, 1988) to the beginning of the fourteenth century (Mostowfi, 1999), and the historical observations in Ch¯alus and R¯amsar (Hudud al-‘Alam, 1973; Ibn Hawqal, 1988), it is probable that sea level during this period did not change as dramatically as men-tioned. This suggestion is supported by the reports on the CSL during the next catastrophic sea-level rise in the four-teenth century with a maximum level at −19 m (G¨umilev, 1980) that drowned ¯Abeskun and was much greater than the high-stand of the first half of the tenth century. As the
approx-imate position of the ¯Abeskun possibly lies at about −24 m elevation, the sea-level position in the early tenth century was at least −24 m as the CSL must have been lower than the height of the town, which could be supported by the geolog-ical findings of Lahijani et al. (2009), who described a sea-level rise during the first centuries of the last millennium to around −24 m in central Gil¯an.
According to Ibn Hawqal’s (1988) observations in 977 in the Dahest¯an District, it seems that the sea level started to fall during the second half of the tenth century, which has been reported elsewhere in the scientific literature (Leroy et al., 2011; Kakroodi et al., 2012) as the Medieval Cli-mate Anomaly (MCA) low-stand. A horizontal displacement of the shoreline in 957 in Derbent (Dotsenko et al., 2002) could also be related to this sea-level fall rather than the seismic event. Although the MCA in the North Atlantic re-gion extended to the middle of the thirteenth century (Rud-diman, 2008), the observations of al-Bakri (1999) and Jo-vayni (1911) in the early thirteenth century suggest that the regression did not stretch beyond 1208. At this time sea level started to rise and reached the highest level at the begin-ning of the fourteenth century (Ban¯aketi, 1969; Mostowfi, 1999). This observation could be correlated with the dating results of Kakroodi et al. (2012) in Gomish¯an and Naderi
Table 7. The Caspian sea level (CSL) during the last millennium based on comparison between historical observations and geological events. No Age (AD) CSL (m) Historical Observation Reference Geological event Reference
1 907 −23 Sea level position in Ahlam, Ch¯alus and R¯amsar
Hudud al-‘Alam (1973), Ibn Hawqal (1988), Jayh¯ani (1989)
Progradation of the old Kura Delta
Hoogendoorn et al. (2005)
2 977 −24 Sea level fall in Dahestan Hudud al-‘Alam (1973), Ibn Hawqal (1988)
Sea-level fall Hoogendoorn et al. (2005) 3 982 −23.8 B¯ab Island is in the map Hudud al-‘Alam (1973),
Ibn Hawqal (1988),
– –
4 1208 −24 Abeskun was on the¯ shoreline
Al-Bakri (1999) – –
5 1260 > −24 Abeskun was flooded¯ Jovayni (1911) High-stand Naderi Beni et al. (2013)
6 1304 −19 Rapid sea-level rise Ban¯aketi (1969), Mostowfi (1999), Marin Sanudo (1320 in G¨umilev, 1980), Al-‘Umar¯ı (2010)
High-stand Kakroodi et al. (2012), Naderi Beni et al. (2013), Rekavandi et al. (2007)
7 1587 −28 Construction of Safavid castle in Derbent
G¨umilev (1980) – –
8 1628 −23 Establishment of ports and structures along the Caspian Sea coast
Parodi (1987), G¨umilev (1980)
Sea-level rise and barrier formation
Kroonenberg et al. (2007)
9 1771 −23 Sea-level rise Abbott (1858), Br¨uckner (1890), Rabino (1980),
Widespread evidence Leroy et al. (2011), Naderi Beni et al. (2013)
10 1815 −23.5 Sea-level position in Galug¯ah and Gomish¯an
Rabino (1980) Anzali Spit broken into barriers
Leroy et al. (2011)
11 1875 −25 Sea-level rise at Anzali royal tower
Farh¯ad Mirz¯a (1987) Kar¯a Bog¯az Gol Leroy et al. (2006)
Beni et al. (2013) in Anzali. The rapid catastrophic sea-level rise in 1304 (Br¨uckner, 1890; G¨umilev, 1980; Karpychev, 2001) inundated ¯Abeskun completely and engendered spit-lagoon development along different stretches of the Caspian coastal areas (Kroonenberg et al., 2007; Storms and Kroo-nenberg, 2007; Naderi Beni et al., 2013). The formation of Nim-mard¯an Bay (Mostowfi, 1999) could possibly be linked to this rapid sea-level rise that is reflected in the study of Kakroodi et al. (2012) as a shell-bearing layer. The succes-sive transgressions of the thirteenth and fourteenth centuries are also recorded in the Anzali Spit as two different horizons of shell-bearing sands (Naderi Beni et al., 2013), as well as in Dagestan (Kroonenberg et al., 2007), the Gorg¯an Wall (Reka-vandi et al., 2007) and Gomish¯an (Kakroodi et al., 2012).
According to the historical documents presented in this study, the geological findings in the south CS (Table 7), and other evidence reported by Br¨uckner (1890), Varushchenko et al. (1987) and Karpychev (1998, 2001), in addition to other findings by Komarova (1980) and G¨umilev (1980) from other parts of the CS, the sea-level curve could be reconstructed as illustrated in Fig. 9.
5.2 Dating Caspian sea level changes during the last millennium
The RE in a closed environment such as the CS is more vari-able and coupled with more uncertainties in time and space than in the open ocean (Walker, 2005). It means that the present-day age of seawater may not necessarily be applica-ble for correction of fossil material from a particular locality (Walker, 2005).
However if a RE is applied to the dating results of this study, then the ages could be linked to the younger high-stands of the fifteenth to the nineteenth centuries (Fig. 9, rect-angle I). According to the elevation of the dated horizons of cores A and B at −26.75 m and −25.8 m, respectively (Ta-ble 2), and the reconstructed level curve (Fig. 9), the sea-level rise in the seventeenth century is more appropriate for the dated horizons. During the tenth to seventeenth centuries the sea level was always higher than −26 m and hence the terrestrial facies below the dated horizons in cores A and B (Fig. 4) could only be formed during the sixteenth century low-stand.
Gonbad e K vus (Gorgān) ā Gorg n (Astar b d)ā Ā ā Behshahr (Ashraf Port) Sh hkilehā Ahlam Āmol Chālus Amirkolā Ki shahrā Anzali Rasht Pirb z rā ā Āstārā Gil n (Daylam) ā M zandar n (Tabarest n) ā ā ā Nim-mard n Bay?ā Turkmenistan Azerbaijan
Caspian Sea
Sari Ramsar Gorg n Bay ā Anzali Lagoon 0 60km N Atrak River Gorgān River SefidrudIran
Dahest nā Gomish nā Ābeskun Khand nā 2 3 4 5 6 7 8 9 10 11 12 13 Galoug hā 49 37 38.5 49 54 38.5 Approximate location RiverCity/Villages referred in text
Estimated river course Province Border Gorgan Defensive Wall Sea level position
International Border
Moghān
1
Fig. 8. The Iranian Caspian coast and reported historical observations. The ancient names are denoted in parentheses: (1) the possible position of sea level in Dahest¯an in the second half of the tenth century (al-Istakhri, 1961, 1973; Barthold, 1984; Ibn Hawqal, 1988). (2) The probable position of Nim-mard¯an Bay (Mostowfi, 1999; Kakroodi et al., 2012). (3) The probable position of ¯Abeskun along the Caspian shoreline (Jovayni, 1911; al-Istakhri, 1961; Ibn Hawqal, 1988; Mostowfi, 1999; al-Mas’¯ud¯ı, 2012). (4) The sea-level position in 1906 in Galoug¯ah (Rabino, 1980). (5) The position of Ashraf port in 1628 (Parodi, 1997). (6) Uzbeks shipped the captives of M¯azandar¯an from S¯ari (Mostowfi, 1999). (7) Sea-level position in Ahlam in the ninth century (al-Ya’q¯ub¯ı, 1968). (8) Sea-level position in Ahlam reported by Ibn Hawqal (1988), Mostowfi (1999) and Mar’ashi (1982). (9) Sea-level position in Ch¯alus reported by Ibn Hawqal (1988) and Jayh¯ani (1989) in the tenth century. (10) Sea-level position in an area between Daylam and M¯azandar¯an in the tenth century (Ibn Hawqal, 1988; Jayh¯ani, 1989). (11) The Sefidrud or its tributary course in the tenth century (Hudud al-‘Alam, 1973). (12) The main course of Sefidrud and its tributary in the eighteenth and nineteenth centuries (Rabino, 1917; Barthold, 1984; Farh¯ad Mirz¯a, 1987). (13) The Anzali Spit broke into barrier islands in the fifteenth century (Mar’ashi, 1982).
Owing to frequent CSL changes during the Holocene (Kroonenberg et al., 2000), and owing to the poorly known RE of the CS, many researchers prefer to conduct their inter-pretations based on uncalibrated ages (e.g. Rychagov, 1997; Pierret et al., 2013), or on calibrated age data (IntCal09 curve) but with different RE ranging from 290 to 438 yr. Us-ing IntCal09 with RE subtracted produces somewhat tighter calibrated ages ranges than using Marine09 with 1R when the overall calibrated age ranges are considered (Fig. 9). 5.3 Hydroseismicity and Caspian sea-level changes Following Shilo and Krivoshey (1989), Rodkin (1992a, b) reported some correlation between the seismic and hydro-dynamic regimes in the CS area and the observed delay times between the CS water imbalances (oscillations in water level due to river inflow, precipitation over the Sea, evapora-tion and outflow from the sea) and regional seismicity. The hydroseismic research avenue was later followed by Ulo-mov (2003), who found some correlation between seismicity and hydrological variations in the central and south CS by utilizing regional M > 6.0 magnitude earthquakes. Since re-liable instrumental measurements on CSL fluctuations before the mid-nineteenth century are not available, the first large-magnitude earthquake selected by Ulomov (2003) was the 1895 Ms7.4 Krasnovodsk (Cheleken) earthquake along the
eastern Caspian shore (though he assigned a M 8.0). Most of
the earthquakes were apparently preceded by a short rise in the CSL followed by noticeable sea-level drops.
Nonetheless, some of the large-magnitude events selected by Ulomov (2003) such as the 1930 Salm¯as, 1948 Ashk¯ab¯ad, 1968 Dasht-e Bay¯az, 1978 Tabas-e Golshan, 1979 Koli, and 1990 Rudb¯ar earthquakes, macro-seismic epicentres are far from the Caspian shoreline (360, 400, 520, 450, 430, 570, and 68 km, respectively). Hence, some of his data points may not be closely linked to the hydroseismicity of the CS. De-spite deleting most of his M > 7.0 earthquakes, if his corre-lation is still valid, then one can state that the factors trolling the fluctuations of the CSL may also partially con-tribute to the seismicity of the basin and lead to destruc-tion of coastal settlements as well as changing shorelines. These kinds of destruction, although short in time, should be considered in any historical, geological and archaeologi-cal reconstructions of CSL changes. In spite of the rich his-torical evidence related to seiche generation in the CS and its theoretical supports, no individual studies have been con-ducted to show the sedimentological impacts of seismic sea-level changes. However, in some cases, such as Lahijani et al. (2009), the evidence of sea level rise was indicated during the MCA that is characterized firmly by a low-stand by many researchers. Although this apparent contradiction could be related to dating techniques, it could also be related to short-term CSL rise due to seismic activity.