HAL Id: hal-02892088
https://hal-amu.archives-ouvertes.fr/hal-02892088
Submitted on 17 Sep 2020HAL is a multi-disciplinary open access archive for the deposit and dissemination of sci-entific research documents, whether they are pub-lished or not. The documents may come from teaching and research institutions in France or abroad, or from public or private research centers.
L’archive ouverte pluridisciplinaire HAL, est destinée au dépôt et à la diffusion de documents scientifiques de niveau recherche, publiés ou non, émanant des établissements d’enseignement et de recherche français ou étrangers, des laboratoires publics ou privés.
Shift in plant-soil interactions along a lakeshore
hydrological gradient
Wenjuan Feng, Mathieu Santonja, Luca Bragazza, Alexandre Buttler
To cite this version:
Wenjuan Feng, Mathieu Santonja, Luca Bragazza, Alexandre Buttler. Shift in plant-soil interac-tions along a lakeshore hydrological gradient. Science of the Total Environment, Elsevier, 2020, 742, pp.140254. �10.1016/j.scitotenv.2020.140254�. �hal-02892088�
Title: Shift in plant-soil interactions along a lakeshore hydrological gradient
1 2
Authors: Wenjuan Feng1,2,3,4¶, Mathieu Santonja3,4,5¶*, Luca Bragazza3,4,6, Alexandre
3
Buttler3,4,7 4
¶ = equal contribution to the work
5 6
Addresses
7
1. Key Laboratory of Watershed Geographic Sciences, Nanjing Institute of Geography and
8
Limnology, Chinese Academy of Sciences, Nanjing, 210008, China 9
2. University of Chinese Academy of Sciences, Beijing, 100049, China
10
3. Ecole Polytechnique Fédérale de Lausanne (EPFL), School of Architecture, Civil and
11
Environmental Engineering (ENAC), Laboratory of Ecological Systems (ECOS), Station 2, 12
1015 Lausanne, Switzerland 13
4. Swiss Federal Institute for Forest, Snow and Landscape Research (WSL), Site Lausanne,
14
Case postale 96, 1015 Lausanne, Switzerland 15
5. Aix Marseille Univ, Avignon Université, CNRS, IRD, IMBE, Marseille, France
16
6. Agroscope, Field-Crop Systems and Plant Nutrition, Research Division Plant Production
17
Systems, Route de Duillier 50, P.O. Box 1012, CH-1260 Nyon, Switzerland 18
7. Laboratoire de Chrono-Environnement, UMR CNRS 6249, UFR des Sciences et Techniques,
19
16 route de Gray, Université de Franche-Comté, F-25030 Besançon, France 20
21
* = corresponding author 22
Mathieu Santonja ([email protected]); ORCID: 0000-0002-6322-6352 23
Abstract
25
Wetlands occupy the transitional zone between aquatic and terrestrial systems. 26
Hydrological conditions have significant influence on wetland plant communities and soil 27
biogeochemistry. However, our knowledge about plant-soil interactions in wetlands along 28
hydrological gradients is still limited, although it is crucial to guide wetland management 29
decisions and to adapt, whenever possible, hydrological conditions to the different plant 30
communities. To this aim, we related vegetation composition, plant functional traits, soil 31
physicochemical properties, soil microbial biomass, and soil enzymatic activities in wetlands 32
on the southeastern shore of Neuchâtel lake, Switzerland, a lake whose level is partly regulated. 33
Aboveground and belowground plant biomass and correspondent C, N and P concentrations 34
remained constant or decreased moving from the vegetation community subjected to more 35
frequent flooding events to the community with almost no flooding. The soil organic layer 36
exhibited always higher nutrient concentrations and greater enzymatic activities than the 37
organo-mineral and mineral layers. The chemical and biological characteristics of the soil 38
organic layer showed decreasing values for most of the parameters along the hydrological 39
gradient from lakeshore to upland wetland communities. On the basis of nutrient stoichiometry, 40
plant-soil system in the plant community with most flooding events had no-nutrient limitation, 41
while there was a N limitation in the transitional community. In the upland plant community 42
where there was no flooding effect, the plant-soil system was characterized by N and P co-43
limitation. These findings are important because they provide a threshold for flooding regime 44
by the lake in the context of optimization of lake level regulation under various stakeholders 45
needs. 46
47
Keywords: wetland; flooding; plant biomass; biogeochemistry; nutrient stoichiometry
48 49
1. Introduction
50
Wetlands are important ecosystems supporting biodiversity by providing habitats for 51
numerous plants and animals (Neckles et al., 1990; Gibbs, 2000). Furthermore, they ensure 52
several key ecosystem services such as flood control, groundwater replenishment, water 53
purification, carbon (C) sequestration and they provide livelihoods for local populations 54
(Ramsar, 2013). Extreme climate events such as flooding and drought, as well as anthropogenic 55
activities such as sand mining and agriculture intensification (Lai et al., 2014; Xu et al., 2019) 56
are likely to change the hydrological conditions of wetlands (Hingray et al., 2007; Sarneel et
57
al., 2019) and their habitats (Dawson et al., 2003). In particular, variation in frequency and 58
duration of soil flooding and dryness can profoundly affect biogeochemical cycles of C, 59
nitrogen (N) and phosphorous (P) with cascading effects on wetland plant community 60
composition (Baldwin and Mitchell, 2000; Wang et al., 2015b; Swanson et al., 2017). 61
Flooding regime affects soil organic C and nutrient content and availability by controlling 62
microbial mineralization (Wolf et al., 2013; Wang et al., 2015a; Swanson et al., 2017). 63
Accumulation of degraded organic compounds in water saturated soils and under oxygen 64
deficiency (Hopkinson, 1992; Swanson et al., 2017) leads to increasing dissolved soil organic 65
carbon (DOC) and nutrients, resulting partly from C, N and P leaching from leaf litter under 66
rewetting conditions (Baldwin and Mitchell, 2000; Shrestha et al., 2014). Extracellular 67
degrading enzymes are produced by microorganisms in response to environmental signals or 68
through cell lysis (Sinsabaugh et al., 2009; Cui et al., 2018). It has been proved that their higher 69
activities in wet conditions can accelerate organic C, N and P mineralization rates by breaking 70
down large organic molecules for microbial consumption (Wilson et al., 2011; Heuck et al.,
71
2015). Soil organic carbon (SOC) and nutrient concentrations were shown to be relatively 72
higher in the wetter as compared to the drier part in both river and lake wetlands (Bai et al.,
73
2005; Wang et al., 2016) and this increase of nutrient pool promoted microbial activity and 74
nutrient cycling (Baldwin and Mitchell, 2000; Heuck et al., 2015). Thus, microbial biomass is 75
both a source and a sink for nutrients and participates to nutrient transformation (Gil-Sotres et
76
al., 2005). However, drying of formerly inundated wetlands may cause a severe C limitation 77
and consequently a decrease in the rate of nutrient cycling because of C being lost (Baldwin
78
and Mitchell, 2000) and microbial die-off (Qiu and McComb, 1995). 79
Hydrological conditions in wetlands can have strong impact on plant-soil interactions (Fu
80
et al., 2018; Wang et al., 2018) through changing both organic matter accumulation and 81
mineralization processes (Wilson et al., 2011; Swanson et al., 2017). Plant C, N, P 82
concentrations and their stoichiometric ratios may reflect nutrient availability from substrate 83
and plant nutrient uptake (Demars and Edwards, 2007; Agren, 2008; Elser et al., 2010), 84
Furthermore, the above- and belowground nutrient content and stoichiometry are tightly linked 85
(Bell et al., 2014) and therefore represent important indicators of ecosystem structure and 86
nutrient cycling (Zechmeister-Boltenstern et al., 2015; Sardans et al., 2017). Plant nutrient 87
content and stoichiometry have been studied to detect tissue nutrient allocation (Wang et al.,
88
2015b; Hu et al., 2018), seasonal nutrient variation (Fu et al., 2018), nutrient limitation (Bedford
89
et al., 1999; Demars and Edwards, 2007) or variation between plant functional types (Wang
90
and Moore, 2014; Hu et al., 2018). For example, Li et al. (2017) and Li et al. (2018b) showed 91
that soil nutrient content and stoichiometry are changing along hydrological gradients, and that 92
plant nutrient content and stoichiometry are regulated rather by flooding duration than by soil 93
nutrient content. 94
Different plant species and their abundances can also cause variation in soil and microbial 95
nutrient stoichiometry (De Graaff et al., 2010; Bell et al., 2014) and modulate ecosystem 96
functions through ecological processes affecting microbial and enzymatic activities (Bever et
97
al., 2010; Kardol et al., 2010). There are ample evidences of the close relationships among plant 98
species and soil stoichiometry (Hobbie et al., 2006; Bell et al., 2014; Wang et al., 2018). Pattern 99
of nutrient availability varies among plant species (Bedford et al., 1999; Güsewell and
100
Koerselman, 2002) and conversely, plants apply some control over nutrient availability by 101
driving soil microbial and enzymatic activities (Richardson et al., 2009; Sardans and Peñuelas,
102
2012; Bragazza et al., 2015). Along hydrological gradients, the relationship between plant 103
functional traits and soil properties has been explored in wetlands, revealing potential plant-soil 104
relationships (Liu et al., 2015; Wang et al., 2015b; Hu et al., 2018). 105
In the present study, we investigated soil physico-chemical characteristics (including C, 106
N, P stock and availability), soil microbial biomass nutrients (C, N, P), soil enzymatic activities, 107
and nutrient content in plant and moss biomass (C, N, P) in three plant communities along a 108
hydrological gradient from lakeshore to upland. Investigations took place at the beginning and 109
at peak of the growing season in a wetland along the southern shore of Lake Neuchâtel, 110
Switzerland. We hypothesized that: (i) soil nutrient content, microbial biomass and enzymatic 111
activities, and plant nutrient content are higher in the flooded areas near the lakeshore as 112
compared to the upland area; (ii) the nutrient stoichiometry of plant and soil components can 113
reveal contrasted ecosystem functioning along the hydrological gradient, with a N and P 114
limitation for plant communities of the upland area, as opposed to no N and P limitation for the 115
plant communities close to the lakeshore subjected to flooding. 116
117
2. Materials and methods
118 119
2.1 Study site
120
The study was conducted in the wetlands along the southern shore of Lake Neuchâtel 121
(46°54′28″N, 6°52′02″E) in Switzerland, which is the Ramsar site called "Grande Cariçaie". 122
The climate is defined as pluvial sub-oceanic (Buttler, 1990) with a mean annual temperature 123
of 9.4 °C and mean annual precipitation of 891 mm (MeteoSuisse, 124
https://www.meteosuisse.admin.ch - Payerne, period 1981-2010). Five main plant communities, 125
respectively dominated by Molinia caerulea (L.) Moench, Schoenus nigricans L., Carex 126
panicea L., Carex elata All. and Phragmites australis (Ca.) Steud. can be found moving from
127
the upland wetland to the lake shoreline (Buttler et al., 1985; Buttler and Gallandat, 1989;
128
Buttler and Muhlhauser, 1994). These plant communities experience an annual flooding regime 129
depending on the lake water level, which is partly regulated and is on average low in winter, 130
high in spring and intermediate in summer and autumn 131
(https://www.hydrodaten.admin.ch/fr/2149.html). Thus, flooding by the intrusion of the lake 132
into the wetland occurs mainly in spring and early summer time, and relates to the snowmelt in 133
the Alps. Heavy rain can recharge the soil water rapidly in autumn, which translates into 134
superficial flooding’s event in the upland wetlands which are not influenced by the lake water 135 (Buttler, 1987). 136 137 2.2. Sampling design 138
Distinct plant communities distributed along an elevation gradient (i.e. transects from 139
lakeshore to upland) were selected, a method frequently used in wetland ecosystem studies (e.g. 140
Li et al., 2017; Fu et al., 2018). The three plant communities dominated by C. elata, C. panicea 141
and S. nigricans were selected for this study because they represent the interface between the 142
vegetation influenced by the lake intrusion into the wetland, e.g. Caricetum elatae W. Koch 26, 143
variant with Phalaris arundinaceae, the transitional vegetation, e.g. Caricetum elatae W. Koch 144
26, variant with Carex panicea and the vegetation not reached by the lake, e.g. Orchio-145
Schoenetum nigricantis Oberd. 57, variant with Galium palustre (Buttler and Gallandat, 1989).
146
Along this gradient, which is topographically characterized by a gentle slope with about 30-60 147
cm increase of soil level towards the upland wetland, soils show a marked hydromorphic feature: 148
histic humaquept (C. elatae community), wet typic haplaquoll (C. panicea community) and dry 149
typic haplaquoll (S. nigricans community) (Buttler and Gobat, 1991). 150
Four transects at least 1 km apart were established from the upland to the shoreline 151
(Supplementary Fig. S1). In each of the three plant communities crossed by these transects, one 152
10 m × 10 m plot was randomly selected, leading to a total of 12 plots (4 transects × 3 plant 153
communities). The different botanical compositions in different plots are given in the 154
Supplementary Table S1. One piezometer was installed in each plot to monitor the soil water 155
level (Supplementary Fig. S2). Carex elata community was mostly flooded with decreasing 156
water levels during the study period, C. panicea community experienced wet conditions with 157
soil saturated in spring and a subsequent drop of water level below -35 cm in August, and S. 158
nigricans community, typically never flooded with water level decreasing from -4 to -70 cm
159
during the measurement period. Data loggers (Onset HOBO Water Temp Pro v2) were also 160
installed in the soil at 5 cm depth to monitor the soil temperature (Supplementary Fig. S3). 161
Overall, from March to August, the top-soil temperature increased regularly from 5 °C to more 162
than 20 °C, with the soil in C. elata community being always slightly colder than that in C. 163
panicea and S. nigricans communities, which had very similar temperatures.
164 165
2.3. Plant and soil collection
166
Plant and soil samples were collected in all plots at the beginning of the plant growing 167
season (April 2018) and at the peak of plant biomass (July 2018) (Supplementary Fig. S4). In 168
addition to the groundwater level measured with the piezometers, the soil volumetric water 169
content was measured at 0-10 cm depth in each plot and at each sampling time using a portable 170
TDR (FieldScout TDR100, UK). 171
Aboveground vascular plant biomass (AGB), moss biomass (MB) and plant litter (L) 172
were collected in all plots using a 50 cm × 50 cm quadrat in S. nigricans and C. panicea 173
communities, and a 100 cm × 100 cm quadrat in C. elata community. Vascular plants were 174
clipped at the ground level, while litter and mosses were picked up carefully to avoid soil 175
particles. All the aboveground material was placed in separated bags, transported to the 176
laboratory, and then oven-dried at 65 °C for 4 days. Once oven-dried, this plant material was 177
weighted in order to estimate the dry mass (DM) per square meter for each plot and kept for 178
further analysis. 179
Three soil cores (5.6 cm diameter × 30 cm depth) per plot were randomly collected (in-180
between the tussocks for C. elata and S. nigricans communities) for belowground biomass 181
(BGB - roots and rhizomes) sampling. The same layers as for soil sampling (see below) were 182
used and pooled so as to have a composite sample for each layer. Roots and rhizomes were 183
carefully collected by gentle washing in water. As for the aboveground material, the 184
belowground biomass was oven-dried at 65 °C during 4 days and weighted in order to estimate 185
the dry mass (DM) per square meter for each plot and kept for further analysis. 186
Three other soil cores (5.6 cm diameter × 30 cm depth) per plot were collected in a similar 187
way for the soil sampling as for the belowground biomass. Based on the soil color and texture, 188
each soil core was divided into three parts: organic layer (OL), organo-mineral layer (OML), 189
and mineral layer (ML) (Supplementary Figs. S4 and S5). The top 5 cm of the organic layers 190
from the three soil cores were collected and pooled in one composite sample. For the organo-191
mineral layer, the 5 cm immediately below the entire organic layer were taken and pooled. For 192
the mineral layer, the upper 2 cm of this layer was removed to avoid irregular transition and the 193
following 5 cm below were collected, which again were pooled in one composite sample. These 194
samples were placed in polyethylene bags, transported to the laboratory and stored at 4 °C until 195
being further processed. 196
In order to determine the soil bulk density (BD), a last soil core was sampled and an intact 197
piece (5.6 cm diameter × 5 cm depth) was taken for each soil layer and oven-dried at 105 °C 198
for 48 h and weighted. Bulk density was calculated by dividing the mass of the oven‐dried soil 199
sample by its volume and expressed as g.cm-3.
200 201
2.4. Plant and moss C, N and P analyses
202
A subsample of dry plant material was washed and dried again, then ground to a fine 203
powder using a ball mill before chemical analysis. Total organic carbon (C) and total nitrogen 204
(N) concentrations were determined by thermal combustion using an elemental analyzer (CE 205
Instruments model NA2500 Nitrogen Carbon Analyzer) and expressed as percent of dry weight. 206
Total phosphorus (P) concentration was determined by the molybdenum blue method after 207
HClO4-H2SO4 digestion using a continuous flow autoanalyser (FlowSys, Systea, Anagni, Italy)
208
and expressed as percent of dry weight. Finally, C:N, C:P and N:P stoichiometric ratios were 209
calculated for aboveground and belowground plant biomass, plant litter and moss biomass 210
(Supplementary Fig. S4). 211
212
2.5. Soil chemical analyses
213
For chemical analyses, any visible coarse plant material in the soil samples was removed 214
by hand-sorting. Soil samples were divided into two subsamples: i) a subsample was oven-dried 215
at 65 °C for 4 days and ground to a fine powder using a ball mill in order to determine total 216
organic C (TOC), N (TN) and P (TP) concentrations, and ii) a fresh subsample was stored at 4 217
°C in order to determine soil pH, nitrate (N-NO3-) and ammonium (N-NH4+) concentrations,
218
dissolved organic C (DOC), N (DN) and P (DP) concentrations, soil microbial biomass and soil 219
enzymatic activities. For the determination of soil water content (SWC) and in order to quantify 220
all the measured parameters per g of dry soil weight, 10 g of fresh soil samples for each replicate 221
were oven-dried at 105 °C for 48 h. In addition, these oven-dried samples were burned at 550 °C 222
for 6 h in order to determine the soil organic matter content by loss of ignition (LOI). 223
TOC, TN and TP were determined for each replicate following the same methods as for 224
plant and moss material and expressed as percent of dry soil weight. Soil pH was measured in 225
1:5 (w/v) soil water suspension with a portable pH meter (WTW multi 3430, Weilheim, 226
Germany) after stirring the mixture for 2 h. N-NH4+ and N-NO3- concentrations were
227
determined after extraction of 5 g of fresh soil with 30 ml of 1 M KCl extraction and filtration 228
through 0.45 µm filter using a continuous flow autoanalyzer (SEAL Analytical, Germany) and 229
the results were expressed as mg.kg–1 oven dry soil. 230
Microbial biomass carbon (MBC), nitrogen (MBN) and phosphorus (MBP) were 231
measured using the chloroform fumigation extraction method (Brookes et al., 1985). Three 232
pairs of about 5 g of fresh soil (3 g for MBP) were weighed for each replicate. One sample from 233
each pair was stored at 4 °C while the other sample was put in a vacuum desiccator and 234
subjected to chloroform vapor. After 24 h of fumigation in the dark at ambient temperature, the 235
fumigated soil samples and the corresponding ones kept unfumigated in the fridge were 236
extracted with a 25 ml of 0.5 M K2SO4 for MBC and MBN and with 40 ml of 0.5 M NaHCO3
237
for MBP. All solutions were filtered through a 0.45 µm filter before analysis. Organic C and N 238
concentrations in the solutions from both fumigated and unfumigated samples were determined 239
using a TOC/TN analyzer (Shimadzu TOC-V), while P concentration was determined by 240
colorimetry using a spectrophotometer at 890 nm (Olsen et al., 1954). Soil DOC, DN and DP 241
were determined as the concentrations obtained from the unfumigated samples. The soil MBC, 242
MBN and MBP values were estimated as the differences between fumigated and unfumigated 243
samples using an extractability factor of 0.45 for C (Vance et al., 1987), 0.54 for N (Brookes et 244
al., 1985) and 0.40 for P (Brookes et al., 1982) and expressed as mg.kg–1 oven dry soil. 245
In order to measure the soil enzymatic activities, 1 g of fresh soil was mixed with 10 ml 246
of water, stirred for 1 h, and the supernatant was collected after centrifugation. The activities 247
of extracellular hydrolase enzymes were measured by adding 50 µl of 4-methylumbelliferyl-ß-248
D-glucoside for the activity of ß-glucosidase (BG), 4-MUF-N-acetyl-ß-D-glucosaminide for 249
the activity of ß-1, 4-N-acetylglucosaminidase (NAG), L-leucine-7-amido-4-methycoumarin 250
hydrochloride for the activity of leucine aminopeptidase (LAP) and 4-MUF-phosphate for the 251
activity of phosphatase (PHO) to 250 µl of the soil extract. After 2 h of incubation, the 252
fluorescence was measured on a microplate reader (BioTek SynergyMX) at 450 nm emission 253
and 330 nm excitation wavelength. To quantify product release and account for quenching 254
effects, a set of standards was prepared using methylumbelliferone (MUF) and 7-amino-4-255
methylcoumarin (MUC) mixed with soil extract. Enzymatic activities were expressed as μmol 256
of substrate (MUF and MUC) converted per min and per g (dry weight) of soil (Freeman et al.,
257
2004). 258
The C:N, C:P and N:P stoichiometric ratios were calculated for bulk soil and its dissolved 259
fraction and for microbial biomass. 260
261
2.6. Data analysis
262
Statistical analyses were performed with the R software 3.2.3 (R. Core Team, 2017). 263
When necessary, data were log or square root transformed, and the normality and 264
homoscedasticity of the distribution of residuals of models were visually verified. 265
We used a linear mixed effects model approach (‘‘nlme’’ package, Pinheiro et al., 2020), 266
followed by Tukey HSD tests for post hoc comparisons, to test the effects of vegetation type 267
(C. elata, C. panicea or S. nigricans community), growing season (beginning or peak of the 268
growing season), and their interactions on plant and moss parameters. To consider the fact that 269
we had three plots per transect, the random part of the model indicated that the plots were nested 270
within transects. 271
For what concerns the soil physico-chemical, microbial and enzymatic parameters, we 272
used a linear mixed-effects model approach followed by Tukey HSD tests for post hoc 273
comparisons in order to test the effects of soil layers (organic, organo-mineral or mineral layer), 274
vegetation type (C. elata, C. panicea or S. nigricans community), growing season (beginning 275
or peak of the growing season), and their interactions, specifying soil layers nested into plots 276
nested into transects as random factor. 277
A redundancy analysis (RDA) was used to link the plant chemical characteristics of the 278
three vegetation types taken at two sampling times (C, N and P contents and their stoichiometry 279
in above- and belowground plant biomass, moss biomass and plant litter) as a response to the 280
soil characteristics (chemical and biological variables – see Supplementary Tables S2 and S3). 281
Finally, a principal component analysis (PCA) was used to determine the correlations 282
between stoichiometry of C, N and P in the plant material, in the bulk soil and in its dissolved 283
fraction, and in the microbial biomass. 284 285 3. Results 286 287
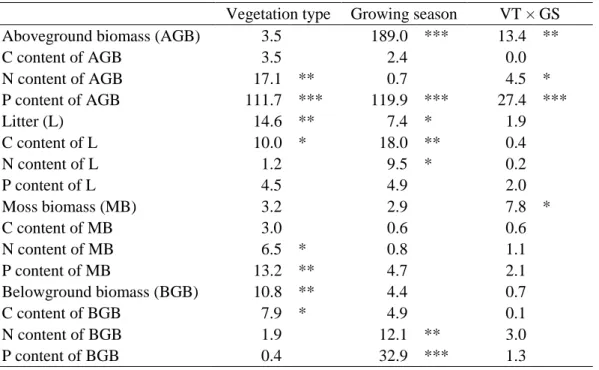
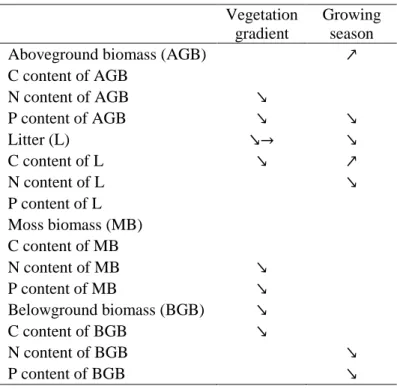
3.1 Plant and moss parameters
288
Litter mass and belowground biomass were between 2.4 and 3.5 times higher in C. elata 289
community compared to C. panicea and S. nigricans communities (Table 1 and 2;
290
Supplementary Table S2), while differences in aboveground and moss biomass among the three 291
plant communities were dependent on the sampling time during the growing season (significant 292
vegetation type × growing season interaction, Table 1). At the beginning of the growing season, 293
aboveground biomass of C. elata community was lower than that of C. panicea and S. nigricans 294
communities, while aboveground biomass of C. elata community was higher than that of C. 295
panicea at the peak of growing season (Fig. 1a). Concerning moss biomass, there was no 296
difference among plant communities at the beginning of growing season, while moss biomass 297
of C. elata community was 5 times higher than that of the two other plant communities at the 298
peak of growing season (Fig. 1b). When summing all plant and moss materials, the organic 299
matter stock was approximately 2.5-time higher in C. elata community (10’063 g.m-2) as 300
compared to C. panicea (4’037 g.m-2) and S. nigricans (3’803 g.m-2) communities. The 301
aboveground biomass increased more than 8 times during the growing season, while litter mass 302
was 30% lower (Table 2; Supplementary Table S2). Belowground biomass decreased by 32% 303
from the beginning to the peak of biomass period, while moss biomass increased 1.6-times, 304
although these trends were not significant (Tables 1 and 2; Supplementary Table S2). 305
Carbon content in belowground biomass and litter were higher in C. elata community 306
compared to S. nigricans community (Table 1; Supplementary Table S2). Nitrogen content in 307
aboveground biomass of C. panicea community was similar to that of the C. elata community 308
and higher than that of S. nigricans community at the beginning of the growing season, while 309
it was similar to that of S. nigricans community and lower than that of C. elata community at 310
the peak of the growing season (significant vegetation type × growing season interaction, Table
311
1; Fig. 1c). Phosphorus content in aboveground biomass showed a trend of decrease according 312
to the gradient C. elata > C. panicea > S. nigricans, i.e. from lakeshore to upland communities 313
(Table 1; Supplementary Table S2). The decrease in P content in aboveground biomass during 314
the growing season was dependent on the plant community (significant vegetation type × 315
growing season interaction, Table 1), since the P content decreased only in the C. elata and C. 316
panicea communities (Fig. 1d). 317
Nitrogen and P content in moss biomass was also higher in C. elata compared to S. 318
nigricans community (Table 1; Supplementary Table S2). In litter, C content increased, while 319
N content decreased during the growing season, and in belowground biomass both N and P 320
contents decreased during the growing season (Tables 1 and 2; Supplementary Table S2). 321
322
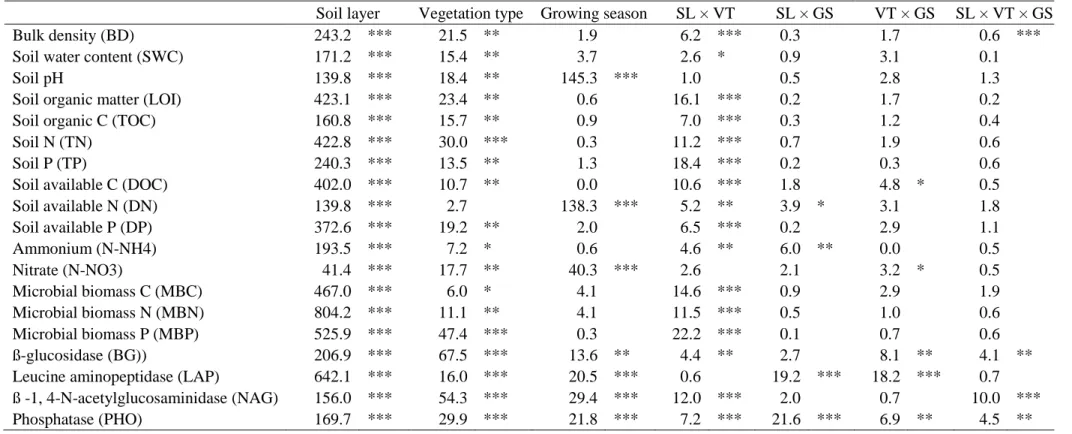
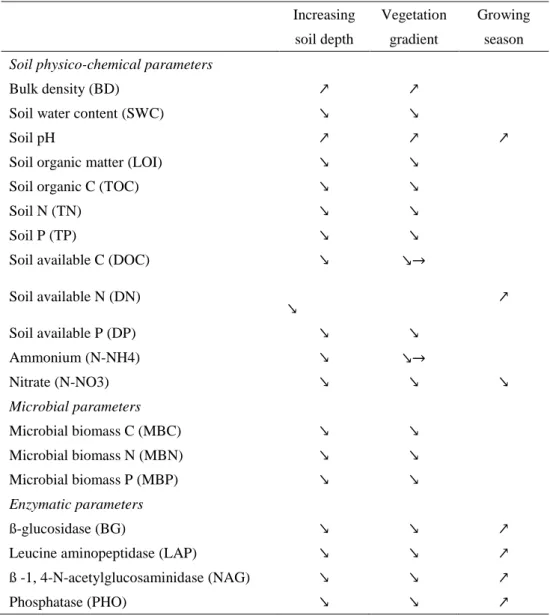
3.2 Soil physico-chemical parameters
Bulk density and pH increased according to the gradient organic > organo-mineral > 324
mineral layers (i.e. soil depth) while, in the opposite, all other physico-chemical parameters 325
decreased according to soil depth (Tables 3 and 4; Supplementary Table S3). Moreover, bulk 326
density and pH increased from lakeshore to upland plant communities while, in the opposite, 327
all other physico-chemical parameters decreased according to this vegetation gradient (Tables
328
3 and 4; Supplementary Table S3). Overall, more physico-chemical parameters were 329
significantly different between C. elata and C. panicea communities than between C. panicea 330
and S. nigricans communities (Supplementary Table S3). 331
Except for soil pH and nitrate, the differences among the three plant communities were 332
dependent on the soil layer (significant soil layer × vegetation type interaction, Table 3), with 333
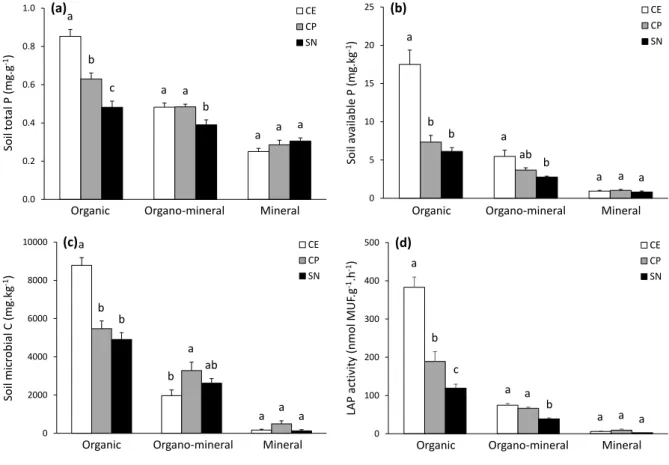
decreasing differences among plant communities according to increasing soil depth. For 334
example, while we observed marked differences for soil total P (TP) and available P (DP) in 335
organic layer among plant communities, the values of mineral layer were much less marked or 336
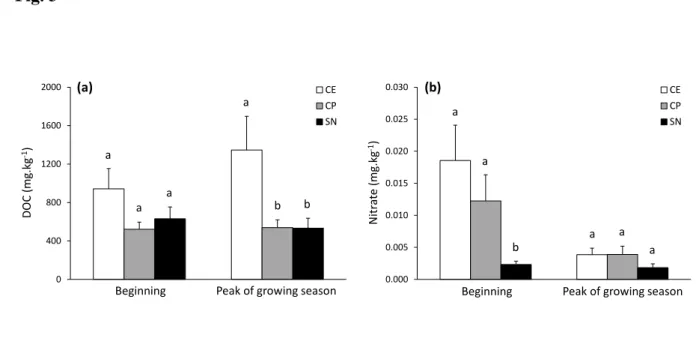
similar between plant communities (Fig. 2a and b). The differences in soil available C (DOC) 337
and nitrate contents among the 3 plant communities were also dependent on the growing season 338
(significant vegetation type × growing season interaction, Table 3). Soil DOC values were 339
similar between the 3 plant communities at the beginning of the growing season, while DOC 340
was higher in C. elata compared to the two other communities at the peak of growing season 341
(Fig. 3a). Soil nitrate was higher in C. elata and C. panicea communities compared to S. 342
nigricans community at the beginning of the growing season, while similar values between the
343
three plant communities were observed at the peak of growing season (Fig. 3b). 344
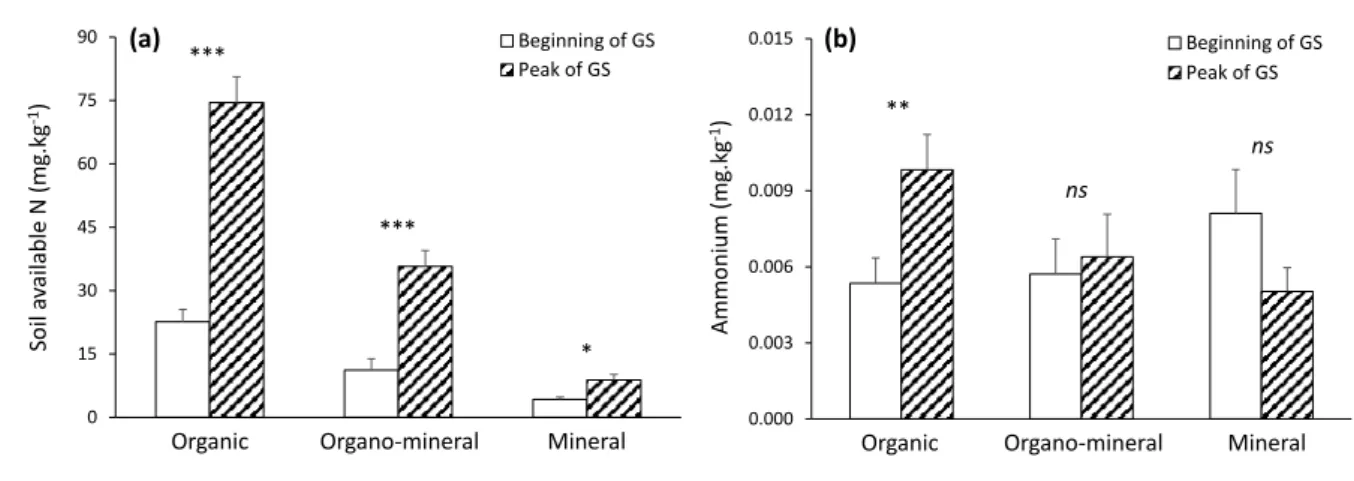
Only few soil physico-chemical parameters varied across the growing season (Table 3). 345
Soil pH and DN increased while, on the opposite, nitrate decreased between the beginning and 346
the peak of the growing season (Tables 3 and 4; Supplementary Table S3). The increase in soil 347
available N (DN) across the growing season was higher in the organic and organo-mineral 348
layers compared to the mineral layer (significant soil layer × growing season interaction, Table
349
3; Fig. 4a), while ammonium content increased only in the organic layer (significant soil layer 350
× growing season interaction, Table 3; Fig. 4b). 351
352
3.3 Soil microbial biomass and enzyme activity
353
Soil microbial biomass and enzymatic parameters decreased according to soil depth and 354
according to the vegetation gradient from lakeshore to upland (Tables 3 and 4; Supplementary
355
Table S3). Contrary to microbial biomass, the four enzymatic activities varied across the 356
growing season (Table 3), with higher values reported at the peak compared to the beginning 357
of growing season (Table 4; Supplementary Table S3). 358
Except for leucine aminopeptidase activity, the differences in microbial biomass and 359
enzymatic parameters among the three plant communities were dependent on the soil layer 360
considered (significant soil layer × vegetation type interaction, Table 3), with decreasing 361
differences according to increasing soil depth (Fig. 2c and d). Finally, the differences in 362
enzymatic parameters among plant communities or among soil layers were stronger at the peak 363
compared to the beginning of growing season (significant soil layers × growing season and 364
vegetation type × growing season interactions, Table 3). 365
366
3.4 Plant-soil interactions
367
The redundancy analysis model (RDA) provides a synthetic view on the relationship 368
between plant chemical characteristics as a response to soil characteristics in the upper organic 369
layer at two sampling periods, April and July (Supplementary Fig. S6). C. elata community 370
samples are strongly linked, along axis 1, to high values of N and P in aboveground biomass, 371
moss biomass and plant litter, while belowground biomass samples vary mostly along axis 2, 372
with higher P and N values in April. 373
The relationships among stoichiometry of C, N and P in all sampled compartments (plant, 374
moss, soil and microbial biomass) in April and July are given in the principal component 375
analysis (PCA) of the Fig. 5. C. elata community samples are mostly positively correlated to 376
soil dissolved C:N ratio and strongly negatively correlated to C:P and N:P in microbial biomass. 377
Samples of C. panicea community are mostly positively correlated to C:N ratios in 378
belowground biomass, in bulk soil and also weakly in microbial biomass, and strongly 379
negatively correlated to C:P and N:P ratios in bulk soil and in belowground biomass, as well as 380
in soil dissolved C:P. Finally, samples of S. nigricans community are positively correlated to 381
several ratios, in particular to C:P and N:P ratios in microbial biomass, to soil dissolved N:P, 382
to bulk soil C:N ratio and to C:N, C:P and N:P ratios in aboveground biomass, moss and litter. 383
384
4. Discussion
385 386
4.1 Plant biomass and its nutrients content reflect the hydrological gradient induced by the
387
lake flooding
388
The seasonal pattern of aboveground biomass was different among the three vegetation 389
types. In spring, before the vegetation started to grow, C. elata had the lowest aboveground 390
biomass, but later in the season, at the peak of biomass period, the trend reversed and C. elata 391
community developed more biomass compared to C. panicea and S. nigricans communities (in 392
this later case the difference was only marginal). This reflects in the litter accumulation, which 393
was higher in C. elata community. Mosses also developed more during the vegetation period 394
in C. elata community due to the very favorable microclimatic conditions resulting from high 395
soil moisture and shading conditions under the tussocks. The total plant biomass reflects well 396
the hydrological gradient, with highest values in C. elata community and lowest in S. nigricans 397
community. Li et al. (2017) found opposite results for biomass distribution along an elevation 398
gradient in Dongting Lake wetland (China), with increasing aboveground biomass with 399
decreasing soil water content. This can be explained by the different hydrological conditions in 400
these two wetlands. In Dongting Lake wetland, the upland plant community still experiences 401
an annual flooding event, similarly to the community close to the lake shoreline and therefore 402
its ecological functioning cannot be assimilated to a conservative nutrient poor biogeochemical 403
cycle as in the S. nigricans community investigated in the present study. 404
As we hypothesized, plant nutrient content generally decreased along the hydrological 405
gradient, with higher values in C. elata community, which is under the influence of the lake 406
flooding. This was particularly true for N and P content in plant aboveground and moss 407
biomasses. The concentrations of these two elements in aboveground biomass also showed the 408
intermediate status of C. panicea community, as exemplified by its N content which was similar 409
to C. elata in spring, when both vegetation types were flooded by the lake, and similar to S. 410
nigricans later in the dryer season (Fig. 1c). Nutrients provided by the lake water are important 411
sources for wetland plants, and indeed, in C. elata community, and to some extend also in C. 412
panicea community, vascular plants and mosses could absorb more nutrients than in S.
413
nigricans community, which contributed to the higher biomass accumulation. Furthermore, C
414
and nutrients from the litter leachates (Demars and Edwards, 2007; Shrestha et al., 2014) and 415
organic matter accumulation (Wilson et al., 2011; Swanson et al., 2017) under flooding 416
conditions are also beneficial for the plant nutrient absorption and growth. 417
We assessed the nutrient content in aboveground and moss biomass by pooling the plant 418
species, since each plant community was dominated by only a few species (Buttler, 1987, see 419
also Supplementary Table S1). Nevertheless, plant nutrients can show a high interspecific 420
variability and low phenotypic response to nutrient supply (Demars and Edwards, 2007; Li et
421
al., 2017; Hu et al., 2018). Plants have lower nutrient resorption proficiency in nutrient-rich 422
environment (Hopkinson, 1992; Mao et al., 2016), while under extremely low nutrient 423
availability, they can adapt by maintaining small nutrient concentrations in photosynthetically 424
active tissues (Wang and Moore, 2014). In S. nigricans community, we can speculate that plants 425
could transfer and store more nutrients into the living roots. It was also observed that shoots 426
remain partly green over winter, which can contribute to the storage of nutrients, while all the 427
aboveground biomass dies out in C. elata vegetation (personal observations). As a consequence, 428
in S. nigricans community these nutrients could be mobilized during the growing season and 429
allow for relatively high aboveground biomass production as compared to C. elata community 430
(Fig. 1a, no statistical difference between CE and SN at the peak of biomass). Nutrient 431
translocation was the reason why litter quality was increased with nutrient enrichment in N-432
limited wetlands (Mao et al., 2016). We did not detect any vegetation type × growing season 433
cross effect for accumulated litter and its quality (Table 1), so that we assume that the existing 434
litter became similar in the different vegetation types during winter decomposition already. 435
Litter decomposition was mostly related to leaf N content (de Neiff et al., 2006) and flooding 436
can accelerate decomposition through increasing soil moisture (Shrestha et al., 2014; Heuck et
437
al., 2015) and nutrient leaching (Baldwin and Mitchell, 2000; Shrestha et al., 2014). This could 438
explain why, despite initial nutrient concentration differences in early senescent biomass and 439
distinct nutrient translocation capacity in the three communities, there was no significant 440
differences in litter N and P contents. However, C content in litter decreased along the 441
hydrological gradient, with highest values in C. elata and lowest in S. nigricans communities. 442
This difference of litter C content potentially provides more energy for microorganisms in the 443
C. elata community.
444
From a stoichiometric perspective, in aboveground and moss biomass, C:N, C:P and N:P 445
ratios were significantly lower in C. elata and higher in S. nigricans communities 446
(Supplementary Table S4). Even if this trend is still visible in the litter, differences were non-447
significant, which could advocate for similar decomposition rates. In litter bags decomposition 448
experiments, Buttler (1987) found that k decomposition rates were 0.229, 0.224 and 0.253 for 449
C. elata, C. panicea and S. nigricans communities, respectively, thus a higher decomposability
450
for the litter in S. nigricans community was measured. This discrepancy can be explained by 451
the quality of the litter used. Because of the plant morphology, fresh litter can easily be collected 452
on S. nigricans tussocks at the end of the growing season as standing senescent leaves, while 453
for Carex species, these senescent leaves tend to fall down and mix with older leaves on the 454
ground, so that litter samples might be more heterogeneous and comprise leaves in a more 455
advanced decomposition stage. 456
457
4.2 Soil organic matter quantity and quality reflects the flooding regimes
458
Under intensive flooding, as happened in C. elata community near the lakeshore, there 459
was more than double the amount of organic matter accumulated in the ecosystem, as compared 460
to C. panicea and S. nigricans communities. With respect to the belowground biomass, which 461
was also highest in C. elata community, it cannot be concluded on higher root growth as it was 462
not possible to distinguish between living and dead roots, but lower soil bulk density can 463
indicate higher organic matter content in relation to higher root productivity (Rokosch et al.,
464
2009). As for litter, the strong decrease of belowground biomass during the growing season 465
points to the degradation of dead organic matter. In the belowground biomass, there was no 466
difference in plant N and P concentrations among the three communities, despite different soil 467
nutrient conditions (Table 4). Like for the N:P ratio of above-ground biomass and mosses, the 468
N:P ratio of belowground biomass was higher in the S. nigricans community where there is no 469
flooding than in the other two communities. This result is contrary to the finding in Wang et al.
470
(2018) where N:P ratio of belowground biomass was increased with flooding intensity. These 471
opposed results might be explained by distinct nutrient limitation in the two study areas. Below-472
ground biomass C content decreased along the hydrological gradient, with highest values in C. 473
elata and lowest in S. nigricans communities, which mirrors in the trend for higher
below-474
ground biomass C:N and C:P ratios in C. elata community. This reflected the humus types, 475
which were marked differently by hydromorphic features: peaty anmoor, anmoor-hydromull 476
and hydromull in C. elata, C. panicea and S. nigricans communities, respectively (Buttler and
477
Gobat, 1991). This is consistent with the decrease of soil organic matter and C contents along 478
the vegetation gradient, as well as in the increase of bulk density and pH (Table 4 and
479
Supplementary Table S3). 480
481
4.3 High organic matter in wetter soils triggers enzyme activity, which in turn accelerates
482
nutrient mineralization
483
The soils in the three plant communities differed in their chemical and biological 484
characteristics of their surface organic layer, which showed, as hypothesized, decreasing values 485
for most of the parameters along the hydrological gradient, from C. elata to S. nigricans 486
communities. Thus, higher soil fertility near the lakeshore also allowed higher microbial 487
biomass. Along the growing season, DOC increased markedly in C. elata community, as a 488
result of intense organic matter decomposition of the accumulated litter under high soil 489
biological activity. Thus, higher organic matter contributed to the enzyme activity, which in 490
turn could accelerate nutrient mineralization (Wilson et al., 2011; Heuck et al., 2015). 491
Conversely, nitrate was higher at the beginning of the vegetation period, but decreased 492
thereafter because it was used readily for the high biomass production, and consequently the 493
soils could not be differentiated anymore by their nitrate content at the peak of biomass. 494
Enzyme activity was affected not only by the availability of organic matter, but was also 495
promoted by temperature increase during the growing season (Sinsabaugh et al., 2008; Manzoni
496
et al., 2012). 497
4.4 Plant-soil interaction and nutrient limitation in different hydrological conditions
499
The three studied vegetation types are characterized by different nutrient requirements 500
and, according to our hypothesis, this translates into different nutrient limitation and 501
stoichiometric ratios in the plant material, soil and microbial pools. In C. elata community, N 502
and P are not limiting because of the regular input of nutrients by lake water. With respect to 503
NO3, values were on a yearly average 1.7 mg.L-1 in the lake water, as opposed to 0.1 mg.L-1 in
504
the soil solution of the organic layer in the considered soils, while values for PO4 were
505
indifferently 0.1 mg.L-1 in both the lake water and the upper horizon of these soils, but 506
undetectable in the deeper horizons (Buttler, 1992). This shows that despite the inflow of 507
nutrients from the lake in the wettest plant communities, the nutrient content in the soil does 508
not discriminate the plant communities, despite obvious differences in biomass production and 509
associated nutrient content (this study and Buttler, 1992). This is explained by the immediate 510
uptake of nutrients for biomass production and its feedback effect onto the soil during the 511
vegetation period in wetlands (Dykyjová and Úlehlová, 1978; Bayley et al., 1985). Indeed, 512
hydrological differences among the various vegetation communities can affect soil organic 513
matter accumulation and mineralization processes (Wilson et al., 2011; Swanson et al., 2017), 514
as well as plant nutrient resorption (Wang et al., 2015a). Finally, losses of nutrients from soil 515
organic matter and litter decomposition are important for the eutrophic vegetation influenced 516
by the lake and contribute to a high C:N ratio in the soil dissolved fraction. It has been reported 517
that dissolved organic carbon was higher under flooding than non-flooding condition in 518
floodplain vegetation (Shrestha et al., 2014) and it was increased by flooding duration (Blodau
519
and Moore, 2003; Kim et al., 2014). Therefore, for vegetation under the influence of lake 520
inundation and high nutrient inputs, there is a rapid turnover of nutrients. Conversely, in the 521
upland wetland vegetation characterized by S. nigicans, which is never affected by lake 522
flooding, N and P are limiting, which translates in high N:P ratios in the soil dissolved fraction 523
as well as high C:N, C:P and N:P ratios in aboveground biomass, mosses and litter, as well as 524
high C:P and N:P ratios in the microbial biomass. Under such low nutrient availability, nutrient 525
translocation from senescing tissues is a strategy for plants to retard nutrient loss (Hopkinson,
526
1992; Aldous, 2002). This translocation process of nutrients to roots by species such as S. 527
nigricans (also Molinia caerulea and M. arundinacea, both present in S. nigricans community)
528
is specific to a conservative biogeochemical cycle. In C. panicea community, which has an 529
intermediate position along the vegetation gradient, only N is limiting, which translates into 530
high C:N ratios in bulk soil, below-ground biomass and microbial biomass, and low C:P and 531
N:P ratios in bulk soil and below-ground biomass, as well as low C:P ratio in the soil dissolved 532 fraction. 533 534 5. Conclusion 535
High nutrient concentrations in plant leaves tend to be associated with the “live-fast/die 536
young” end of the leaf economics spectrum (Wright et al., 2004; Kazakou et al., 2007), a 537
characteristic which holds for the lakeshore vegetation under the influence of the lake flooding, 538
as opposed to the upland wetland vegetation, which is never reached by lake flooding (Bueche
539
et al., 1994). Our findings have strong implication for wetland management. The wetland 540
hydrodynamic depends strongly on the lake level regulation at the outlet of the lake Neuchâtel, 541
where a dam has been built (Buttler et al., 1995). It is a request to the hydraulic managers to 542
consider the various stakeholders needs for setting the water level curve along the year. 543
Constraints are given by the electricity power plants on the Aar river, navigation on the Rhin 544
river, agriculture in the floodplains around the lake, fisheries and nature conservancy on the 545
south shore of lake Neuchâtel which has become a Ramsar site. In this respect, the wetland 546
vegetation and their soils are sensitive to lake flooding regime, as it was shown in this study. It 547
is therefore important that the water level of the lake is set to optimize the flooding regime in 548
the wetland, more specifically that most of the vegetation of the type of C. elata along the 549
lakeshore (but also the Phragmites communis belt near the lakeshore and ponds) can be flooded 550
in spring, and the least possible vegetation of the type of S. nigricans (and neighboring Molinia 551
coearulea vegetation) is reached by lake water (Buttler et al., 1995). These findings are 552
important because they provide a threshold for flooding regime by the lake in the context of 553
optimization of lake level regulation under various stakeholders needs. An inadequate water 554
management would affect soil sustainability with a loss of C from the highly organic soils if 555
they would be less flooded. In the opposite, dryer soils would also trigger shrub encroachments 556
and lead to a loss of the most valuable habitats in connection with the lake, which are crucial 557
for many organisms, as for example for fish and bird reproduction. Finally, a general flooding 558
would suppress in the upland wetlands some plant and animal species of high naturalistic 559
importance such as orchids or tree frog. 560
561
Acknowledgements
562
We thank Sylvain Lanz, Emmanuel Carino, Mitsuo Wada, Gil Fontannaz and Yannic 563
Bernard for their contributions to the sampling in the field and some laboratory work. We are 564
very grateful to Christian Clerc from the Association de la Grande Cariçaie, Champittet, for 565
guidance and help for site selection. We also thank the China Scholarship Council for the PhD 566
grant attributed to Wenjuan Feng, the National Key Research and Development Program of 567
China (2018YFE0206400) and the EPFL for financial support. 568
569
Conflict of interest: The authors declare that they have no conflict of interest.
570 571
References
Agren, G.I., 2008. Stoichiometry and Nutrition of Plant Growth in Natural Communities. 573
Annual Review of Ecology Evolution and Systematics 39, 153-170. 574
Aldous, A.R., 2002. Nitrogen translocation in Sphagnum mosses: effects of atmospheric 575
nitrogen deposition. New Phytologist 156, 241-253. 576
Bai, J.H., Ouyang, H., Deng, W., Zhu, Y.M., Zhang, X.L., Wang, Q.G., 2005. Spatial 577
distribution characteristics of organic matter and total nitrogen of marsh soils in river 578
marginal wetlands. Geoderma 124, 181-192. 579
Baldwin, D.S., Mitchell, A.M., 2000. The effects of drying and re-flooding on the sediment and 580
soil nutrient dynamics of lowland river-floodplain systems: A synthesis. Regulated Rivers-581
Research & Management 16, 457-467. 582
Bayley, S.E., Zoltek, J.J., Hermann, A.J., Dolan, T.J., Tortora, L., 1985. Experimental 583
manipulation of nutrients and water in a freshwater marsh: effects on biomass, 584
decomposition, and nutrient accumulation. Limnology and Oceanography 30, 500-512. 585
Bedford, B.L., Walbridge, M.R., Aldous, A., 1999. Patterns in nutrient availability and plant 586
diversity of temperate North American wetlands. Ecology 80, 2151-2169. 587
Bell, C., Carrillo, Y., Boot, C.M., Rocca, J.D., Pendall, E., Wallenstein, M.D., 2014. 588
Rhizosphere stoichiometry: are C:N:P ratios of plants, soils, and enzymes conserved at the 589
plant species-level? New Phytologist 201, 505-517. 590
Bever, J.D., Dickie, I.A., Facelli, E., Facelli, J.M., Klironomos, J., Moora, M., Rillig, M.C., 591
Stock, W.D., Tibbett, M., Zobel, M., 2010. Rooting theories of plant community ecology in 592
microbial interactions. Trends in Ecology & Evolution 25, 468-478. 593
Blodau, C., Moore, T.R., 2003. Experimental response of peatland carbon dynamics to a water 594
table fluctuation. Aquatic Sciences 65, 47-62. 595
Bragazza, L., Bardgett, R.D., Mitchell, E.A.D., Buttler, A., 2015. Linking soil microbial 596
communities to vascular plant abundance along a climate gradient. New Phytologist 205, 597
1175-1182. 598
Bragazza, L., Parisod, J., Buttler, A., Bardgett, R.D., 2013. Biogeochemical plant–soil microbe 599
feedback in response to climate warming in peatlands. Nature Climate Change 3, 273-277. 600
Brookes, P.C., Landman, A., Pruden, G., Jenkinson, D.S., 1985. Chloroform Fumigation and 601
the Release of Soil-Nitrogen - a Rapid Direct Extraction Method to Measure Microbial 602
Biomass Nitrogen in Soil. Soil Biology & Biochemistry 17, 837-842. 603
Brookes, P.C., Powlson, D.S., Jenkinson, D.S., 1982. Measurement of Microbial Biomass 604
Phosphorus in Soil. Soil Biology & Biochemistry 14, 319-329. 605
Bueche, M., Buttler, A., Cornali, Ph., Perrochet, P., 1994. Effects of water level regulation of 606
lake Neuchâtel (Switzerland) on the shore wetlands: mathematical modelling of 607
groundwater-lakewater interactions. Proceedings of the International Symposium 608
"Conservation and Management of Fens", 6th-10th June 1994, Poland, International Peat 609
Society - Agricultural University Warsaw, pp. 201-212. 610
Buttler, A. Quelques aspects climatiques dans les marais non boisés de la rive sud du lac de 611
Neuchâtel (Suisse). Bulletin de la Société Neuchâteloise des Sciences Naturelles 113, 217-612
230. 613
Buttler, A., 1987. Etude écosystémique des marais non boisés de la rive sud du lac de Neuchâtel 614
(Suisse): phytosociologie, pédologie, hydrodynamique et hydrochimie, production végétale, 615
cycles biogéochimiques et influence du fauchage sur la végétation. Thèse de doctorat, 616
Université de Neuchâtel (Suisse), pp. 284. 617
Buttler, A., 1992. Hydrochimie des nappes des prairies humides de la rive sud du lac de 618
Neuchâtel. Bulletin d’Écologie 23, 35-47. 619
Buttler, A., Bueche, M., Cornali, Ph., Gobat, J.M., 1985. Historischer und ökologischer 620
Ueberblick über das Südostufer des Neuenburger Sees. Telma (Hannover) 15, 31-42. 621
Buttler, A., Cornali, P., Bueche, M., 1995. Etude des effets de la régulation des lacs 622
subjurassiens sur la végétation et le milieu. Rapport Université de Neuchâtel, sur mandat de 623
l'Office fédéral de l’environnement, des forêts et du paysage (OFEFP), 154, + annexes. 624
Buttler, A., G. Mulhauser, G., 1994. The result of a century of hydrological control - the 625
fenlands of La Grande Cariçaie, in: Gruenig, A. (ed.). Mires and Man. Mire Conservation in 626
a Densely Populated Country - the Swiss Experience. Excursion Guide and Symposium 627
Proceedings of the 5th Field Symposium of the International Mire Conservation Group 628
(IMCG) to Switzerland 1992. Birmensdorf, Swiss Federal Institute for Forest, Snow and 629
Landscape Research, 173-180. 630
Buttler, A., Gallandat, J.D., 1989. Phytosociologie des prairies humides de la rive sud du lac de 631
Neuchâtel (Suisse) et modèle de succession autogène. Phytocoenologia 18, 129-158. 632
Buttler, A., Gobat, J.M., 1991. Les sols hydromorphes des prairies humides de la rive sud du 633
lac de Neuchâtel (Suisse). Bulletin d’Écologie 22, 405-418. 634
Cui, Y.X., Fang, L.C., Guo, X.B., Wang, X., Zhang, Y.J., Li, P.F., Zhang, X.C., 2018. 635
Ecoenzymatic stoichiometry and microbial nutrient limitation in rhizosphere soil in the arid 636
area of the northern Loess Plateau, China. Soil Biology & Biochemistry 116, 11-21. 637
Dawson, T.P., Berry, P.M., Kampa, E., 2003. Climate change impacts on freshwater wetland 638
habitats. Journal for Nature Conservation 11, 25-30. 639
De Graaff, M.A., Classen, A.T., Castro, H.F., Schadt, C.W., 2010. Labile soil carbon inputs 640
mediate the soil microbial community composition and plant residue decomposition rates. 641
New Phytologist 188, 1055-1064. 642
De Neiff, A.P., Neiff, J.J., Casco, S.L., 2006. Leaf litter decomposition in three wetland types 643
of the Paraná River floodplain. Wetlands 26, 558-566. 644
Demars, B.O.L., Edwards, A.C., 2007. Tissue nutrient concentrations in freshwater aquatic 645
macrophytes: high inter-taxon differences and low phenotypic response to nutrient supply. 646
Freshwater Biology 52, 2073-2086. 647
Dykyjová, D., Úlehlová, B., 1978. Structure and chemistry of the fishpond bottom, Pond 648
Littoral Ecosystems. Springer, Berlin, pp. 141-156. 649
Elser, J.J., Fagan, W.F., Kerkhoff, A.J., Swenson, N.G., Enquist, B.J., 2010. Biological 650
stoichiometry of plant production: metabolism, scaling and ecological response to global 651
change. New Phytologist 186, 593-608. 652
Freeman, C., Ostle, N.J., Fenner, N., Kang, H., 2004. A regulatory role for phenol oxidase 653
during decomposition in peatlands. Soil Biology & Biochemistry 36, 1663-1667. 654
Fu, X.H., Li, F., Zhu, L.L., Xie, Y.H., Hu, C., Chen, X.S., Deng, Z.M., 2018. Change in 655
ecological stoichiometry of Carex brevicuspis in response to seasonal dynamics and 656
elevation in Dongting Lake, China. Nordic Journal of Botany 36, e01821. 657
Gibbs, J.P., 2000. Wetland loss and biodiversity conservation. Conservation Biology 14, 314-658
317. 659
Gil-Sotres, F., Trasar-Cepeda, C., Leirós, M., Seoane, S., 2005. Different approaches to 660
evaluating soil quality using biochemical properties. Soil Biology and Biochemistry 37, 877-661
887. 662
Güsewell, S., Koerselman, W., 2002. Variation in nitrogen and phosphorus concentrations of 663
wetland plants. Perspectives in Plant Ecology, Evolution and Systematics 5, 37-61. 664
Heuck, C., Weig, A., Spohn, M., 2015. Soil microbial biomass C:N:P stoichiometry and 665
microbial use of organic phosphorus. Soil Biology & Biochemistry 85, 119-129. 666
Hingray, B., Mouhous, N., Mezghani, A., Bogner, K., Schaefli, B., Musy, A., 2007. Accounting 667
for global-mean warming and scaling uncertainties in climate change impact studies: 668
application to a regulated lake system. Hydrology and Earth System Sciences 11, 1207-1226. 669
Hobbie, S.E., Reich, P.B., Oleksyn, J., Ogdahl, M., Zytkowiak, R., Hale, C., Karolewski, P., 670
2006. Tree species effects on decomposition and forest floor dynamics in a common garden. 671
Ecology 87, 2288-2297. 672
Hopkinson, C.S., 1992. A comparison of ecosystem dynamics in freshwater wetlands. Estuaries 673
15, 549-562. 674
Hu, M.J., Penuelas, J., Sardans, J., Sun, Z.G., Wilson, B., Huang, J.F., Zhu, Q.L., Tong, C., 675
2018. Stoichiometry patterns of plant organ N and P in coastal herbaceous wetlands along 676
the East China Sea: implications for biogeochemical niche. Plant and Soil 431, 273-288. 677
Kardol, P., Cregger, M.A., Campany, C.E., Classen, A.T., 2010. Soil ecosystem functioning 678
under climate change: plant species and community effects. Ecology 91, 767-781. 679
Kazakou, E., Garnier, E., Navas, M.L., Roumet, C., Collin, C., Laurent, G., 2007. Components 680
of nutrient residence time and the leaf economics spectrum in species from Mediterranean 681
old-fields differing in successional status. Functional Ecology 21, 235-245. 682
Kim, Y., Ullah, S., Moore, T.R., Roulet, N.T., 2014. Dissolved organic carbon and total 683
dissolved nitrogen production by boreal soils and litter: the role of flooding, oxygen 684
concentration, and temperature. Biogeochemistry 118, 35-48. 685
Lai, X., Shankman, D., Huber, C., Yesou, H., Huang, Q., Jiang, J., 2014. Sand mining and 686
increasing Poyang Lake’s discharge ability: A reassessment of causes for lake decline in 687
China. Journal of Hydrology 519, 1698-1706. 688
Li, F., Gao, H., Zhu, L.L., Xie, Y.H., Yang, G.S., Hu, C., Chen, X.S., Deng, Z.M., 2017. Foliar 689
nitrogen and phosphorus stoichiometry of three wetland plants distributed along an elevation 690
gradient in Dongting Lake, China. Scientific Reports 7, 2820. 691
Li, F., Hu, C., Xie, Y.H., Liu, W.Z., Chen, X.S., Deng, Z.M., Hou, Z.Y., 2018. Influence of 692
Differ P Enrichment Frequency on Plant Growth and Plant C:N:P in a P-Limited Subtropical 693
Lake Wetland, China. Frontiers in Plant Science 9, 1608. 694
Liu, F.D., Liu, Y.H., Wang, G.M., Song, Y., Liu, Q., Li, D.S., Mao, P.L., Zhang, H., 2015. 695
Seasonal Variations of C: N: P Stoichiometry and Their Trade-Offs in Different Organs of 696
Suaeda salsa in Coastal Wetland of Yellow River Delta, China. Plos One 10, e0138169.
697
Manzoni, S., Taylor, P., Richter, A., Porporato, A., Ågren, G.I., 2012. Environmental and 698
stoichiometric controls on microbial carbon‐use efficiency in soils. New Phytologist 196, 699
79-91. 700
Mao, R., Chen, H.M., Zhang, X.H., Shi, F.X., Song, C.C., 2016. Effects of P addition on plant 701
C:N:P stoichiometry in an N-limited temperate wetland of Northeast China. Science of the 702
Total Environment 559, 1-6. 703
Neckles, H.A., Neill, C., 1994. Hydrologic Control of Litter Decomposition in Seasonally 704
Flooded Prairie Marshes. Hydrobiologia 286, 155-165. 705
Olsen, S., Cole, C., Watanabe, F., Dean, L., 1954. Estimation of available phosphorus in soils 706
by extraction with sodium bicarbonate. USDA Circular Nr 939, US Gov. Print. Office, 707
Washington, D.C. 708
Olson, J.S., 1963. Energy storage and the balance of producers and decomposers in ecological 709
systems. Ecology 44, 322-331. 710
Qiu, S., McComb, A.J., 1995. Planktonic and microbial contributions to phosphorus release 711
from fresh and air-dried sediments. Marine and Freshwater Research 46, 1039-1045. 712
Pinheiro, J., Bates, D., DebRoy, S., Sarkar, D., 2020. nlme: Linear and Nonlinear Mixed Effects 713
Models. R package version 3.1-147, https://CRAN.R-project.org/package=nlme.Ramsar, 714
2013. The Ramsar Manual. 6th ed. Ramsar Convention Secretariat, Switzerland, pp. 110. 715
Richardson, A.E., Barea, J.-M., McNeill, A.M., Prigent-Combaret, C., 2009. Acquisition of 716
phosphorus and nitrogen in the rhizosphere and plant growth promotion by microorganisms. 717
Plant and Soil 321, 305-339. 718
Rokosch, A.E., Bouchard, V., Fennessy, S., Dick, R., 2009. The use of soil parameters as 719
indicators of quality in forested depressional wetlands. Wetlands 29, 666-677. 720
Sardans, J., Bartrons, M., Margalef, O., Gargallo-Garriga, A., Janssens, I.A., Ciais, P., 721
Obersteiner, M., Sigurdsson, B.D., Chen, H.Y.H., Peñuelas, J., 2017. Plant invasion is 722
associated with higher plant-soil nutrient concentrations in nutrient-poor environments. 723
Global Change Biology 23, 1282-1291. 724
Sardans, J., Peñuelas, J., 2012. The Role of Plants in the Effects of Global Change on Nutrient 725
Availability and Stoichiometry in the Plant-Soil System. Plant Physiology 160, 1741-1761. 726
Sarneel, J.M., Hefting, M.M., Kowalchuk, G.A., Nilsson, C., Van der Velden, M., Visser, E.J., 727
Voesenek, L.A., Jansson, R., 2019. Alternative transient states and slow plant community 728
responses after changed flooding regimes. Global Change Biology 25, 1358-1367. 729
Shrestha, J., Niklaus, P.A., Pasquale, N., Huber, B., Barnard, R.L., Frossard, E., Schleppi, P., 730
Tockner, K., Luster, J., 2014. Flood pulses control soil nitrogen cycling in a dynamic river 731
floodplain. Geoderma 228, 14-24. 732
Sinsabaugh, R.L., Hill, B.H., Shah, J.J.F., 2009. Ecoenzymatic stoichiometry of microbial 733
organic nutrient acquisition in soil and sediment. Nature 462, 795-798. 734
Sinsabaugh, R.L., Lauber, C.L., Weintraub, M.N., Ahmed, B., Allison, S.D., Crenshaw, C., 735
Contosta, A.R., Cusack, D., Frey, S., Gallo, M.E., Gartner, T.B., Hobbie, S.E., Holland, K., 736
Keeler, B.L., Powers, J.S., Stursova, M., Takacs-Vesbach, C., Waldrop, M.P., Wallenstein, 737
M.D., Zak, D.R., Zeglin, L.H., 2008. Stoichiometry of soil enzyme activity at global scale. 738
Ecology Letters 11, 1252-1264. 739
Swanson, W., De Jager, N.R., Strauss, E., Thomsen, M., 2017. Effects of flood inundation and 740
invasion by Phalaris arundinacea on nitrogen cycling in an Upper Mississippi River 741
floodplain forest. Ecohydrology 10, e1877. 742