HAL Id: hal-02922337
https://hal.archives-ouvertes.fr/hal-02922337
Submitted on 26 Aug 2020HAL is a multi-disciplinary open access archive for the deposit and dissemination of sci-entific research documents, whether they are pub-lished or not. The documents may come from teaching and research institutions in France or abroad, or from public or private research centers.
L’archive ouverte pluridisciplinaire HAL, est destinée au dépôt et à la diffusion de documents scientifiques de niveau recherche, publiés ou non, émanant des établissements d’enseignement et de recherche français ou étrangers, des laboratoires publics ou privés.
Compared to Endangered Natural Populations
Media Fitri Isma Nugraha, Laurent Pouyaud, Odang Carman, Utut
Widyastuti, Muhammad Zairin Junior, K. Kadarusman, Jean-Christophe
Avarre
To cite this version:
Media Fitri Isma Nugraha, Laurent Pouyaud, Odang Carman, Utut Widyastuti, Muhammad Zairin Junior, et al.. Genetic Diversity of Boeseman’s Rainbowfish ( Melanotaenia Boesemani ) Reared in Indonesian Farms Compared to Endangered Natural Populations. Tropical Conservation Science, SAGE Publications, 2015, 8 (3), pp.796-812. �10.1177/194008291500800315�. �hal-02922337�
Research Article
Genetic diversity of Boeseman´s Rainbowfish
(Melanotaenia boesemani) reared in Indonesian
farms compared to endangered natural
populations
Media Fitri Isma Nugraha
1, 2,3, Laurent Pouyaud
1, Odang Carman
3,
Utut Widyastuti
4, Muhammad Zairin Junior
3, Kadarusman
5and
Jean-Christophe Avarre
1*1Institut des Sciences de l'Evolution de Montpellier, UMR 226 IRD-CNRS-UM2, Montpellier, France
2Research Centre and Development for Ornamental Fish, Indonesian Agency for Marine and Fisheries Research
and Development, Depok, Indonesia
3Department of Aquaculture, Faculty of Fisheries and Marine Science, Bogor Agriculture University (IPB), Bogor,
Indonesia.
4Department of Biology, Faculty of Mathematics and Science, Bogor Agriculture University (IPB), Bogor, Indonesia 5 Politeknik Kelautan dan Perikanan Sorong, KKD-BP Sumberdaya Genetik dan Konservasi, Sorong, Papua Barat,
Indonesia
*Corresponding author:
jean-christophe.avarre@ird.fr
Abstract
Endemic to two lakes (Ayamaru and Uter) of West Papua (Indonesia), the Boeseman´s Rainbowfish Melanotaenia boesemani Allen & Cross, 1980 is a very popular ornamental freshwater fish. As a result, this rainbowfish species faces great threats and is on the red list of endangered species. Therefore, rearing of this species in aquaculture systems appears to be a promising solution to limit capture of wild specimens and prevent its extinction. Although its reproduction cycle has been controlled for more than 30 years, very few farms still raise M. boesmani , probably due to the problems reported by the farmers, such as decline of production, higher proportion of females per spawning, loss of coloration, lower growth rate and fecundity. Using 12 microsatellites previously developed for this species, comparison of genotypes within six farms around Jakarta indicated that all reared strains originated from Ayamaru Lake. No deficit in heterozygotes was evidenced, suggesting that there was no major inbreeding in these reared populations. Genotype analysis also suggested that M. boesemani species is a metapopulation composed of genetically differentiated populations. Altogether, these results indicate that the problems experienced by the farmers are due not to inbreeding depression but to other factors such as inadequate management and/or poor water quality. Yet, increasing aquaculture production is probably the most effective way to alleviate the pressure that M. boesemani faces in its natural environment.
Key-words: Melanotaenia boesemani, endangered species, aquaculture strains, genetic variability, microsatellites
Introduction
The Boeseman´s Rainbowfish Melanotaenia boesemani Allen & Cross, 1980 is one of the most popular rainbowfish species in the aquarium hobby. When fully matured, males display a very distinct pattern of half-and-half coloration marked by a brilliant blue anterior and bright yellow to orange-red posterior (Fig. 1) [1, 2]. Gerald Allen discovered the species while studying the material collected in 1954-55 by Marinus Boeseman and stored at the National Museum of Natural History in Leiden (Netherlands) [3]. According to several studies [1, 4, 5], the species is only known from Ayamaru Lakes and tributaries and from Uter-Aitinyo Lake (or Uter L.). The two locations are 30 km apart and are separated by rugged karsts (Fig. 2). After the first publication describing M. boesemani [3], great interest arose in the potential commercial value of this species. It was introduced to the aquarium hobby in 1983 and has steadily increased in popularity since then [6]. In the mid-1980s, more than 60,000 males were caught and exported monthly from Ayamaru [7]. Such over-exploitation has therefore quickly brought this species to the verge of extinction in its natural habitat [4]. It has been on the red list of endangered species since 2004, and only aquaculture products are now supposed to be exported [8].
Although there is a lack of precise data, very few Indonesian farms, no more than ten, breed this species, all located around Jakarta, and their production does not account for the total exported fish. Boeseman´s Rainbowfish has been domesticated and produced in Indonesian farms since 1983. At present, farmers claim a decrease of both quantity and quality: males are not as colored as in the wild; growth rate and fecundity are slower; and morphological abnormalities frequently occur (unpublished data obtained from the farmers; Fig. 1c). They attribute these observations to loss of genetic variability and possible inbreeding (personal communication).
Twelve nuclear DNA microsatellite markers were recently developed in this species [9] for conservation purposes. We used these microsatellite markers to assess the genetic variability of six different strains of Boeseman’s Rainbowfish reared in six Javanese farms. We compared their genetic variability with that of wild populations to determine the geographic origin of the founders and quantify possible loss of variability. Prior to these analyses, the microsatellite markers were further validated by testing their Mendelian inheritance through crossing experiments with five mate pairs of Boeseman’s Rainbowfish obtained from a French retailer.
Received: 19 June 2015; Accepted: 27 August 2015; Published: 28 September 2015
Copyright: © Media Fitri Isma Nugraha, Laurent Pouyaud, Odang Carman, Utut Widyastuti, Muhammad Zairin Junior, Kadarusman and Jean-Christophe Avarre. This is an open access paper. We use the Creative Commons Attribution 4.0 license http://creativecommons.org/licenses/by/3.0/us/. The license permits any user to download, print out, extract, archive, and distribute the article, so long as appropriate credit is given to the authors and source of the work. The license ensures that the published article will be as widely available as possible and that your article can be included in any scientific archive. Open Access authors retain the copyrights of their papers. Open access is a property of individual works, not necessarily journals or publishers.
Cite this paper as: Nugraha, M. F. I, Pouyaud, L., Carman, O., Widyastuti, U., Zairin Junior, M., Kadarusman and Avarre, J. C. 2015. Genetic diversity of Boeseman´s Rainbowfish (Melanotaenia boesemani) reared in Indonesian farms compared to endangered natural populations. Tropical Conservation Science Vol. 8 (3): 796-812. Available online: www.tropicalconservationscience.org
Disclosure: Neither Tropical Conservation Science (TCS) or the reviewers participating in the peer review process have an editorial influence or control over the content that is produced by the authors that publish in TCS.
Methods
Fish samplingA total of 432 M. boesemani specimens were analyzed in the present study. Wild fish were captured in 2007 by using gillnets at two distinct locations, respectively in the vicinity of Ayamaru lake (Tiwit tributary, 1°15.463’S and 132°14.939’E, 28 specimens) and at the Uter lake (1°25.957’S and 132°23.258’E, 49 specimens) (Fig. 2). Specimens were captured under local permits obtained by Akademi Perikanan Sorong (APSOR, West Papua). Captive fish were obtained from six farms located around Jakarta. These six farms have been cultivating M. boesemani for many years (up to 30 years), do not practice out-crossings with other breeders, and are facing difficulties such as more females in each harvest (only males are suitable for sale), smaller body size, and loss of color brightness. Approximately 30 individuals were collected from each farm. For Mendelian inheritance tests, five breeding pairs were selected from stock purchased from a French ornamental fish retailer (Botanic, Montpellier) and reared in distinct 60L aquariums. Progeny of each parental pair were collected within the two following months, and consisted of 23 to 43 hatchlings, depending on the spawn size. All fish were anaesthetized with 0.1 mL/L Eugenol (in accordance with the EU Directive 2010/63/EU) and a ~1-cm2 piece of anal fin was collected and stored in absolute ethanol for further DNA extractions. Fish were then allowed to recover from anaesthetic and were released back into either the lakes (at the sampling site) or fish ponds. Experiments on captive animals were conducted at the aquatic experimental facilities of ISEM (PLATAX) (Montpellier) under the laboratory agreement for animal experimentation number A-34-172-24 and the author’s personal authorization for animal experimentation number 34-188, both provided by the French government.
DNA extraction and microsatellite amplification
Individual samples were genotyped with 12 nuclear microsatellite markers that were recently developed [9]. DNA was extracted from a small fragment (10 mg) of anal fin clip with the NucleoSpin® 96 Tissue kit (Macherey-Nagel), according to the manufacturer's instructions, using a Janus automated Workstation (Perkin Elmer). Forward primers were end-labeled with fluorescent dyes (5’FAM, 5’HEX, 5’ATO550, 5’ATO565) (Eurofins). Each reaction contained 5 µl of 2x Master mix (Fast-Start PCR kit, Roche), 0.1 µM of forward primer, 0.4 µM of reverse primer, and 0.5 µl of template DNA. Cycling conditions were as follows: initial denaturation at 95°C for 4 min, followed by 30 cycles of 95°C for 20 s, 56°C for 20 s, and 72 °C for 30 s, and a final elongation step of 7 min at 72°C. Amplicon size was analyzed by capillary electrophoresis as previously described [9], in the technical facilities of the labex "Centre Méditerranéen de l’Environnement et de la Biodiversité" (Montpellier). Allele sizing and genotyping were achieved with the Peak Scanner v1.0 and GeneMapper® v5.0 software (Applied Biosystems).
Genetic diversity analysis
Allelic numbers (Na), average observed (Ho) and expected (He) heterozygosities were calculated using the GENETIX 4.05 software [10]. Data were analyzed for possible departures from Hardy-Weinberg equilibrium by estimating the significance of the multilocus inbreeding coefficient (Fis) with 1,000 random allelic permutations of the original datasets. The genetic structure among the investigated populations was also evaluated by calculating pairwise Fst values with 1,000 random permutations. The significance level of P value for Fis and Fst was defined as the probability of obtaining absolute values higher than or equal to the observed one under the null hypothesis. The genetic relationships between multilocus genotypes of the six reared strains and the wild populations of M. boesemani from Ayamaru and Uter Lakes were also assessed, using a factorial correspondence analysis (FCA) available in Genetix 4.05 software.
Fig. 2. Geographic localization of Ayamaru and Uter Lakes in West Papua, Indonesia. Fig. 1. Coloration patterns of Boeseman´s Rainbowfish
Melanotaenia boesemani. Panels (a)
and (b) show the difference between wild male and female specimens from Ayamaru and Uter Lakes (West Papua, Indonesia), respectively; panel (c) shows a reared specimen from Gusi farm (Jakarta) with a malformation, as frequently observed in the investigated farms.
Results
Experimental validation of the DNA microsatellite markers
The Mendelian inheritance of each microsatellite marker and the presence of putative null alleles were evaluated through crossing experiments. For this purpose, the genotypes of the progenies were resolved and compared to those of their corresponding parents. Results indicated that all genotypes observed in the offspring matched those expected from the parental ones: there were no heterozygous genotypes different from the predicted ones, genotype frequencies were similar to those expected (Appendix 1), and there was no significant difference between the observed and expected heterozygosities calculated on all loci for each crossing population (Table 1). Therefore, all 12 microsatellite loci seemed subject to Mendelian inheritance and there are no null alleles at these loci.
Table 1. Observed (Ho) and expected (He) heterozygosity calculated on all loci for each crossing population and associated Fis.
Crossing 1 Crossing 2 Crossing 3 Crossing 4 Crossing 5
Ho ± SD 0.65 ± 0.27 0.69 ± 0.32 0.67 ± 0.30 0.56 + 0.26 0.70 ± 0.38
He ± SD 0.52 ± 0.19 0.49 ± 0.21 0.47 ± 0.19 0.43 ± 0.18 0.49 ± 0.25
Fis NS NS NS NS NS
NS: non-significant
Genetic variability and heterozygosity of M. boesemani in aquaculture settings and in natural populations
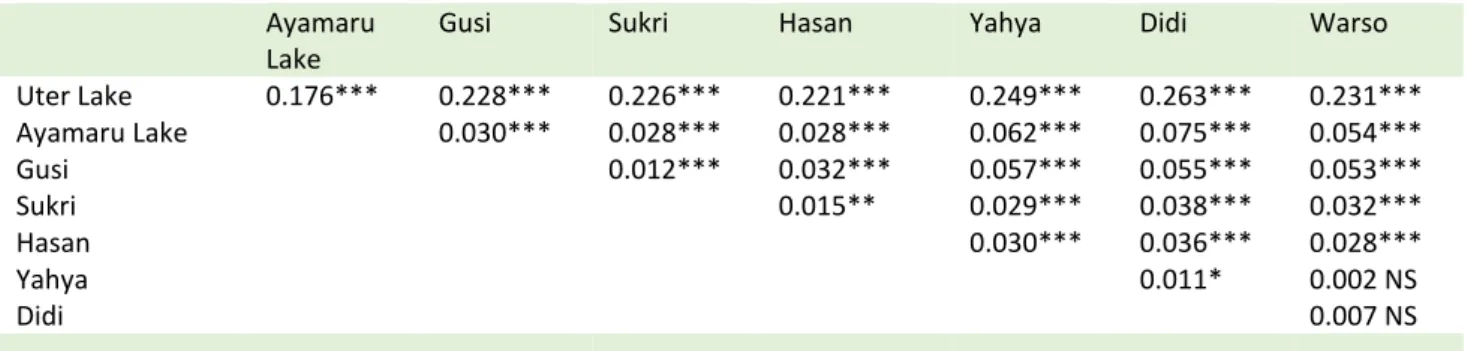
A total of 151 alleles were detected in the 183 farmed and 77 wild specimens in the 12 microsatellite loci. The total number of alleles per locus for all populations varied from 5 to 22, and all loci were polymorphic in each strain and wild population (Appendix 2). Generally, the domesticated populations showed a lower genetic variability (total number of alleles between 62 and 86) compared to the Ayamaru wild population (107 alleles), but comparable to that observed in the wild population of Uter (82 alleles) (Table 2). Considering only the wild populations, there were 23 private alleles for the Uter Lake population and 48 private alleles for Ayamaru Lake. When all samples were included, there were 17 private alleles for Uter Lake, 16 private alleles for Ayamaru Lake and 21 private alleles for the domesticated populations (i.e., only present in one or more strains and absent in wild populations). There were six alleles shared between Uter Lake and one or more strains, and 32 alleles shared between Ayamaru lake and at least one strain. There were 51 alleles shared between both wild populations and one or more strains, and eight alleles shared between Ayamaru and Uter lakes but absent from any strains (Appendix 2). Likewise, the heterozygosities calculated for the captive populations (Hobs comprised between 0.53 and 0.64) were lower than that calculated for the Ayamaru wild population (0.68) but similar to that of Uter population (0.56) (Table 2). Moreover, the Ho were never significantly different from the He. The multilocus Fis values for all populations (wild and captive) were between -0.010 and 0.061, and none of them was significant except that for the Sukri strain (Fis = 0.061, P < 0.05) (Table 2). These results strongly suggest that, with the exception of the Sukri farm, there is no deficit in heterozygotes in any population. Finally, the pairwise Fst values calculated between each population were all significant (P < 0.05), except between Warso and Yahya and between Warso and Didi farms, indicating that most of the populations are genetically differentiated from each other (Table 3).
Table 2. Sample size (N), allele number (Na), average observed (Ho) and expected (He) heterozygosity, and multilocus Fis values for each wild population and strain
Population N Na Ho He Fis Uter lake 49 82 0.56 0.55 -0.010 Ayamaru lake 28 107 0.68 0.69 0.013 Farm Gusi 34 79 0.61 0.61 -0.007 Farm Sukri 30 74 0.59 0.63 0.061* Farm Hasan 30 86 0.64 0.64 -0.001 Farm Yahya 30 75 0.61 0.62 0.010 Farm Didi 29 62 0.53 0.55 0.029 Farm warso 30 71 0.62 0.61 -0.013 * P < 0.05
Table 3. Population differentiation based on pairwise Fst estimates
NS: non significant; * P < 0.05; ** P < 0.01; *** P < 0.001
Geographic origin of M. boesemani reared in Indonesian farms
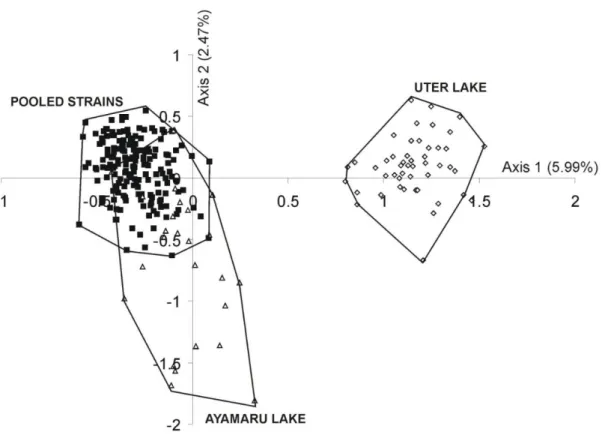
A factorial correspondence analysis (FCA) was performed on all multilocus genotypes obtained for the six captive and the two wild populations (Fig. 3). The projection made on axis 1 (5.99%) and axis 2 (2.47%) indicated that the wild population from Uter Lake could be genetically differentiated from that of Ayamaru Lake. Moreover, all the fish collected from the farms (i.e. polygon “pooled strains”) were partly grouped with those of Ayamaru Lake (i.e., polygon “Ayamaru lake”). The third axis of the FCA did not enable us to separate the farm samples from the Ayamaru wild population. Likewise, when the Uter population was removed, the Ayamaru and farm specimens still overlapped. These results suggest that all captive fish originate from the region of Ayamaru Lake.
Ayamaru Lake
Gusi Sukri Hasan Yahya Didi Warso
Uter Lake 0.176*** 0.228*** 0.226*** 0.221*** 0.249*** 0.263*** 0.231*** Ayamaru Lake 0.030*** 0.028*** 0.028*** 0.062*** 0.075*** 0.054*** Gusi 0.012*** 0.032*** 0.057*** 0.055*** 0.053*** Sukri 0.015** 0.029*** 0.038*** 0.032*** Hasan 0.030*** 0.036*** 0.028*** Yahya 0.011* 0.002 NS Didi 0.007 NS
Fig. 3. Factorial Component Analysis based on the multilocus genotypes of Boeseman’s Rainbowfish
Melanotaenia boesemani individuals from the 2 wild populations of Ayamaru (n=28) and Uter (n=49) and
the 6 Indonesian farms (n=29-34).
Discussion
The possible presence of null alleles in the 12 microsatellite markers had been checked in silico and results suggested that M. boesemani species was not affected [9]. However, this needed to be experimentally validated in order to definitely exclude this possibility. The cross-breeding experiments performed in the present study showed that the 12 microsatellite markers follow a Mendelian inheritance, and ruled out the existence of null alleles due to primer misamplifications, as well as genotyping errors due to stuttering or large allele dropout.
Ayamaru and Uter lakes are located in Indonesia in the western part of New Guinea Island. These two lakes are not connected, are 30 km apart, and are separated by rugged karsts. Though they are considered to be the same species, the fish from these two lakes display significant morphological differences: those from Ayamaru lake have a bright blue anterior and bright yellow anterior coloration, whereas those from Uter show a bright blue anterior and a reddish posterior coloration (Fig. 1). Nevertheless, previous analyses based on both the mitochondrial cytochrome oxydase I gene and morphomeristic traits failed to separate these two populations, which are slightly overlapping [11]. Here, the use of 12 microsatellite markers brought clear evidence that they are genetically differentiated (Fig. 3), and emphasizes that population mixtures should be strictly avoided during any upcoming broodstock constitution. From the samples investigated here, many private alleles were evidenced between the two wild populations of Boeseman’s Rainbowfish (23 for Uter lake and 48 for Ayamaru lake). Among the 12 markers, Mb_di1, Mb_di3, Mb_di4 and Mb_tetra2 accounted for more than 50% of the private alleles found between the two populations (42 over 71).
Among the investigated farms, Gusi, Hasan and Didi started to exploit Boeseman’s Rainbowfish in 1983 and 1986, respectively, soon after the description of M. boesemani species by Allen and Cross [3] and the publication of Rainbowfishes of Australia and Papua New Guinea [12]. This book greatly increased the popularity of rainbowfishes, especially the newly discovered New Guinea species, including Boeseman’s Rainbowfish [2]. In spite of the establishment of these farms, exploitation of this species from its natural environment in Ayamaru has persisted until now. The geography of Uter Lake, surrounded by mountains and characterized by steep and rocky shores, is less favorable to fishing activities than that of Ayamaru, which is more easily accessible. This is probably why all investigated domesticated populations originated from Ayamaru.
The core population of Ayamaru sampled 30 years ago for the cultivated strains was genetically different from that of the wild population sampled in 2007. This was especially evidenced by the 21 private alleles observed in the strains and absent in the wild population of Ayamaru Lake. The presence of these private alleles may suggest a loss of variability that the wild population of Ayamaru has undergone over the last 30 years. However, the fact that heterozygosity and allele number values calculated from the Ayamaru population are comparable with those of other rainbowfish species [9] suggests little or no loss of genetic diversity. Most likely, these private alleles indicate that the genetic diversity of the Ayamaru specimens investigated here are not representative of the whole genetic diversity of Boeseman’s Rainbowfish in this area ( Ayamaru Lake and tributaries). The wild fish sampled in 2007 were indeed collected in Tiwit River, a tributary of Ayamaru Lake, and could represent a distinct genetic entity from the whole population. In this case, the species could be a metapopulation composed of several population subdivisions according to their geographic distribution in the mosaic of habitats characterizing Ayamaru Lake.
It was recently shown in a wide range of marine fishes that overfishing could result in significant reduction of genetic diversity [13]. Another recent meta-population study using many marine fish species demonstrated that the renewal of a fish population depends much less on the amount of available genitors than on environmental factors [14]. If the data presented here are not sufficient to tackle these questions, they nonetheless highlight the urgent need for a complete and exhaustive sampling campaign to determine the exact genetic structure and diversity of this endangered species, in order to ensure its conservation. This would require collection of fish in many more locations of Ayamaru Lake and its tributaries. Indeed, in addition to overfishing, Ayamaru Lake also experiences important environmental threats (deforestation, urbanization) and episodic droughts. Based on the sequence of a mitochondrial DNA fragment of the native Australian freshwater fish Rhadinocentrus ornatus, Mather et al. showed that habitat degradation caused by urbanization significantly reduced genetic diversity [15].
Finally, the genetic variability within the six farmed populations was comparable to that of the natural population of Uter Lake. Because no deficit in heterozygotes was evidenced, there was no major inbreeding in these reared populations. Therefore, the problems experienced by the farmers (i.e., decline of production, higher proportion of females per spawning, loss of coloration, lower growth rate and fecundity, morphological abnormalities) are obviously not due to inbreeding depression and are probably caused by other factors such as poor management and/or poor water quality. It is noteworthy that all investigated farms are located in industrial and densely populated peri-urban areas. As Jakarta and its suburbs have no waste water treatment system, the water used for rearing these fish is probably of very poor quality, and may contain many chemical and hormonal pollutants, both of which have been proven to alter major fish traits such as reproduction and growth. Indeed, exposure to low concentrations of endocrine disruptive chemicals (such as estrogens) can impede gonadal function, reduce fertilization success, decrease fecundity, alter mating behavior, and reverse sex of various
aquatic species [16-18]. Such exposure can even cause the collapse of fish populations at trace concentrations [19].
Regarding the coloration pattern, rainbowfish are able to change color according to the turbidity level of their environment [20, 21]. For instance, increased brightness of red colors in environments rich in organic matter (i.e., more turbid) may enhance conspicuousness, allowing individuals to maintain communication in altered visual environments. Thus, the alteration of fish color brightness observed in reared animals may be an adaptation to the aquaculture conditions, where ponds are very shallow and mimic habitats with full-spectrum lighting. However, a better understanding of the visual system of rainbowfish is required to predict how changes in the aquatic light environment affect the physiology and ecology of these fishes and allow farmers to adapt their rearing conditions to maintain bright body colors.
Implications for conservation
The combination of important levels of biodiversity with low human population density (2-6 inhabitants / km2) led Conservation International in 1997 to declare New Guinea as the only “Major
Tropical Wilderness Area” remaining in Asia. For illustration, all the species of melanotaeniids from Western New Guinea are endemic to the area. Because many rainbowfish species have restricted distributions and are confined to specific habitats, such as isolated lacustrine environments or small parts of a single river system, they are highly vulnerable to environmental disturbance and over-harvesting. Ayamaru Lake is affected by the development of residential areas and ecotourism. Forest clearance has increased channel obstructions by sediments and led to partial drying of the lake. Meanwhile, simultaneous over-catching of the endemic Boeseman’s Rainbowfish drove this species to the verge of extinction [7]. The results presented here (i.e., no significant loss of heterozygotes in the wild populations and no inbreeding depression in the reared strains) indicate that, in spite of the threats that Ayamaru is facing, it is still possible to prevent the extinction of Boeseman’s Rainbowfish. This, however, would require increased aquaculture production in order to quickly alleviate the overfishing pressure. This, in turn, would require better management of the quality of waters used for rearing Boeseman’s Rainbowfish, which is a general concern in Indonesia.
Acknowledgements
The PhD thesis of Mrs Nugraha is jointly supported by the French Ministry of Foreign Affairs and IRD. We are very grateful to Mr. Christophe Cochet who bred the rainbowfish, collected their offspring and ensured their welfare. Data presented in this work were partly produced through the technical facilities of the labex "Centre Méditerranéen de l’Environnement et de la Biodiversité". This is publication IRD-DIVA-ISEM-2015-155.
References
[1] Kadarusman, Hadiaty, R. K., Segura, G., Setiawibawa, G., Caruso, D. and Pouyaud, L. 2012. Four new species of Rainbowfishes (Melanotaeniidae) from Arguni Bay, West Papua, Indonesia. Cybium 36:369-382.
[2] Tappin, A. R. 2010. Rainbowfishes - Their care & keeping in captivity. Art Publications, Australia. [3] Allen, G. R. and Cross, N. J. 1980. Description of five new rainbowfishes (Melanotaeniidae) from
New Guinea. Records of the Western Australian Museum 8:377-396.
[4] Allen, G. R. 1995. Rainbowfishes in Nature and the Aquarium. Tetra-Verlag, Melle, Germany. [5] Allen, G. R. and Boesman, M. 1982. A collection of freshwater fishes from Western New Guinea
with descriptions of two new species (Gobiidae and Eleotridae). Records of the Western Australian Museum 10:67-103.
[6] Polhemus, D. A. and Allen, G. R. 2007. Freshwater biogeography of Papua. In: The Ecology of Papua, part one, Marshall, A. J. and Beehler, B. M. (Eds.), pp. 207-245. Periplus Editions, Singapore.
[7] Allen, G. R. 2007. Fishes of Papua. In: The Ecology of Papua, part one, Marshall, A. J. and Beehler, B. M. (Eds.), pp. 637-653. Periplus, Singapore.
[8] IUCN. 2015. The IUCN Red List of Threatened Species. Version 2015.1 www.iucnredlist.org
Accessed 19 June 2015.
[9] Nugraha, M. F. I., Pouyaud, L., Carman, O., Kadarusman, Widyastuti, U. and Avarre, J. C. 2014. Development of twelve novel polymorphic microsatellite DNA markers for the Boeseman's rainbowfish (Melanotaenia boesemani) and tests for their cross-utility in 21 rainbowfish species from West Papua (Indonesia). European Journal of Wildlife Research 60:941-946.
[10] Belkhir, K., Borsa, P., Chikhi, L., Raufaste, N. and Bonhomme, F. 1996. GENETIX 4.05, logiciel sous WindowsTM pour la génétique des populations, v4.05. CNRS, Laboratoire génome, populations, interactions, Montpellier, France.
[11] Kadarusman, Hubert, N., Hadiaty, R. K., Sudaro, Paradis, E. and Pouyaud, L. 2012. Cryptic Diversity in Indo-Australian Rainbowfishes Revealed by DNA Barcoding: Implications for Conservation in a Biodiversity Hotspot Candidate. Plos One 7.
[12] Allen, G. R. and Cross, N. J. 1982. Rainbowfishes of Australia and Papua New Guinea. Angus & Robertson, Australia.
[13] Pinsky, M. L. and Palumbi, S. R. 2014. Meta-analysis reveals lower genetic diversity in overfished populations. Molecular Ecology 23:29-39.
[14] Cury, P. M., Fromentin, J. M., Figuet, S. and Bonhommeau, S. 2014. Resolving Hjort's Dilemma How Is Recruitment Related to Spawning Stock Biomass in Marins Fish? Oceanography 27:42-47. [15] Mather, A., Hancox, D. and Riginos, C. 2015. Urban development explains reduced genetic
diversity in a narrow range endemic freshwater fish. Conservation Genetics 16:625-634.
[16] Martinović, D., Hogarth, W. T., Jones, R. E. and Sorensen, P. W. 2007. Environmental estrogens suppress hormones, behavior, and reproductive fitness in male fathead minnows. Environmental Toxicology and Chemistry 26:271-278.
[17] Sumpter, J. P. 2005. Endocrine Disrupters in the Aquatic Environment: An Overview. Acta hydrochimica et hydrobiologica 33:9-16.
[18] Vos, J. G., Dybing, E., Greim, H. A., Ladefoged, O., Lambré, C., Tarazona, J. V., Brandt, I. and Vethaak, A. D. 2000. Health Effects of Endocrine-Disrupting Chemicals on Wildlife, with Special Reference to the European Situation. Critical Reviews in Toxicology 30:71-133.
[19] Kidd, K. A., Blanchfield, P. J., Mills, K. H., Palace, V. P., Evans, R. E., Lazorchak, J. M. and Flick, R. W. 2007. Collapse of a fish population after exposure to a synthetic estrogen. Proceedings of the National Academy of Sciences of the United States of America 104:8897-8901.
[20] Kelley, J. L., Phillips, B., Cummins, G. H. and Shand, J. 2012. Changes in the visual environment affect colour signal brightness and shoaling behaviour in a freshwater fish. Animal Behaviour 83:783-791.
[21] Rodgers, G. M., Kelley, J. L. and Morrell, L. J. 2010. Colour change and assortment in the western rainbowfish. Animal Behaviour 79:1025-1030.
Appendix 1. Allele frequencies for each breeding pair (crossing) and its corresponding
offspring at the 12 microsatellite loci.
Allele Crossing and corresponding offspring
M1 F1 O1 (n=24) M2 F2 O2 (n=40) M3 F3 O3 (n=23) M4 F4 O4 (n=32) M5 F5 O5 (n=43) Mb_di1 95 - - - 0.50 - 0.28 - - - 0.50 - 0.29 97 - - - 0.50 - 0.21 109 - - - 0.50 0.50 0.55 - - - - 113 1.00 0.50 0.67 - 0.50 0.21 - 1.00 0.50 1.00 0.50 0.70 - 0.50 0.24 117 - 0.50 0.33 0.50 - 0.24 0.50 - 0.22 - 0.50 0.30 - - - 119 - - - 0.50 0.26 Mb_di2 113 - 0.50 0.33 - - - 0.50 1.00 - - - - 123 - - - 0.50 - 0.35 - - - 0.50 - 0.22 - - - 127 - 0.50 0.17 - - - - 129 - - - - 0.50 0.20 - - - 0.50 1.00 0.78 - 0.50 0.26 133 - - - 0.50 - 0.15 - - 0.72 - - - - 135 - - - 0.50 - 0.23 139 0.50 - 0.33 - 0.50 0.30 0.50 - 0.28 - - - - 141 - - - 0.50 0.50 0.51 143 0.50 - 0.17 - - - - Mb_di3 153 - 1.00 0.50 - - - 0.50 0.50 0.46 0.50 0.50 0.48 - - - 161 - - - 0.50 0.25 163 0.50 - 0.25 1.00 0.50 0.80 0.50 0.50 0.54 - - - 1.00 - 0.50 165 - - - - 0.50 0.20 - - - - 171 0.50 - 0.25 - - - 0.50 0.50 0.52 - 0.50 0.25 Mb_penta1 160 - - - 0.50 1.00 0.65 - - - 0.50 - 0.29 180 - - - 0.50 0.50 0.59 - - - 185 - - - - 1.00 0.50 0.50 - 0.35 - - - - 0.50 0.24 190 0.50 0.50 0.56 - - - 0.50 - 0.19 - - - 195 0.50 - 0.23 - - - - 200 - 0.50 0.21 1.00 - 0.50 - - - - 0.50 0.22 0.50 - 0.21 205 - - - 0.50 0.26 Mb_di4 112 0.50 - 0.19 0.50 - 0.26 1.00 0.50 0.76 - 0.50 0.28 - 1.00 0.50 114 0.50 0.50 0.52 - 0.50 0.23 - 0.50 0.24 1.00 0.50 0.72 - - - 124 - - - 0.50 0.50 0.51 - - - - 140 - 0.50 0.29 - - - -
164 - - - 1.00 - 0.50 Mb_tetra1 143 1.00 1.00 1.00 1.00 1.00 1.00 0.50 1.00 0.74 - 1.00 0.50 0.50 0.50 0.47 147 - - - 0.50 - 0.26 0.50 - 0.23 0.50 0.50 0.53 157 - - - 0.50 - 0.27 - - - Mb_tri1 113 1.00 0.50 0.71 0.50 1.00 0.75 1.00 0.50 0.76 1.00 1.00 1.00 1.00 1.00 1.00 116 - 0.50 0.29 - - - - 119 - - - 0.50 - 0.25 - 0.50 0.24 - - - - Mb_tri2 138 0.50 - 0.27 - 1.00 0.50 - - - 0.50 0.50 0.39 - 1.00 0.50 144 - - - 0.50 - 0.22 - 1.00 0.50 0.50 0.50 0.61 1.00 - 0.50 147 0.50 1.00 0.73 - - - 0.50 - 0.43 - - - - 150 - - - 0.50 - 0.28 0.50 - 0.07 - - - - Mb_di5 83 - - - 0.50 - 0.28 0.50 - 0.30 0.50 0.50 0.53 89 - - - 0.50 - 0.26 - - - 0.50 - 0.26 91 0.50 - 0.19 - 0.50 0.24 - 0.50 0.24 - 0.50 0.27 - 0.50 0.21 95 - - - 0.50 0.26 - 0.50 0.23 - - - 97 - 0.50 0.27 0.50 - 0.24 - - - 0.50 - 0.20 - - - 105 0.50 0.50 0.54 - 0.50 0.26 0.50 - 0.22 - - - - Mb_tetra2 180 - - - - 0.50 0.29 - - - 0.50 - 0.28 188 - - - 0.50 0.20 - - - - 192 - - - 0.50 - 0.22 204 - 0.50 0.25 - 0.50 0.21 1.00 - 0.50 0.50 1.00 0.77 - 1.00 0.50 208 0.50 - 0.31 - - - - - 0.50 - 0.23 - - - 212 0.50 0.50 0.44 1.00 - 0.50 - - - - 256 - - - 0.50 0.30 - - - - Mb_tri3 133 0.50 0.50 0.56 1.00 0.50 0.76 1.00 1.00 1.00 0.50 1.00 0.72 1.00 1.00 1.00 142 0.50 0.50 0.44 - 0.50 0.24 - - - 0.50 - 0.28 - - - Mb_tri4 99 0.50 0.50 0.35 1.00 0.50 0.73 0.50 0.50 0.50 0.50 - 0.23 0.50 - 0.116 102 0.50 - 0.35 - 0.50 0.28 - 0.50 0.28 0.50 1.00 0.77 - 0.50 0.186 111 - 0.50 0.29 - - - 0.50 - 0.22 - - - 0.50 0.50 0.698
Appendix 2. Number of alleles per locus for each population
Locus Uter Lake
n=49 Ayamaru Lake n=28 Gusi farm n=34 Sukri farm n=30 Hasan farm n=30 Yahya farm n=30 Didi farm n=29 Warso farm n=30 Total number of alleles Mb_di1 9 14 8 8 10 9 9 8 19 Mb_di2 13 14 9 8 10 9 9 9 17 Mb_di3 10 8 7 5 7 7 5 6 18 Mb_penta1 6 8 8 7 7 7 6 6 10 Mb_di4 10 15 10 8 11 12 7 13 22 Mb_tetra1 6 7 3 4 6 5 2 3 10 Mb_tri1 4 4 4 3 3 2 2 2 6 Mb_tri2 3 4 4 4 4 5 3 4 6 Mb_di5 6 8 8 9 8 7 6 7 12 Mb_tetra2 10 18 10 11 12 6 6 7 21 Mb_tri3 3 3 3 3 4 2 3 2 5 Mb_tri4 2 4 5 4 4 4 4 4 5
Appendix 3. Allelic frequency for each population
Locus Uter Lake Ayamaru lake Gusifarm Sukri farm Hasan farm Yahya farm Didi farm Warso farm Mb_di1 87 0.010 0.000 0.000 0.000 0.000 0.000 0.000 0.000 89 0.020 0.036 0.000 0.000 0.000 0.000 0.000 0.000 95 0.357 0.125 0.206 0.183 0.117 0.067 0.017 0.050 97 0.061 0.018 0.044 0.083 0.017 0.000 0.000 0.000 101 0.000 0.018 0.000 0.000 0.000 0.000 0.000 0.000 103 0.000 0.000 0.147 0.050 0.100 0.033 0.000 0.017 105 0.000 0.036 0.000 0.000 0.017 0.000 0.052 0.000 107 0.000 0.089 0.000 0.000 0.000 0.000 0.000 0.000 109 0.378 0.018 0.088 0.067 0.067 0.150 0.103 0.233 111 0.031 0.000 0.000 0.000 0.000 0.033 0.017 0.050 113 0.071 0.250 0.235 0.450 0.433 0.500 0.448 0.367 115 0.010 0.036 0.029 0.000 0.000 0.050 0.069 0.000 117 0.061 0.304 0.221 0.117 0.100 0.050 0.121 0.083 119 0.000 0.018 0.029 0.033 0.117 0.100 0.138 0.133 121 0.000 0.000 0.000 0.017 0.017 0.017 0.000 0.067 125 0.000 0.018 0.000 0.000 0.000 0.000 0.000 0.000 127 0.000 0.018 0.000 0.000 0.000 0.000 0.000 0.000 137 0.000 0.000 0.000 0.000 0.017 0.000 0.035 0.000 139 0.000 0.018 0.000 0.000 0.000 0.000 0.000 0.000 Mb_di2 113 0.000 0.089 0.029 0.033 0.167 0.033 0.121 0.033 117 0.083 0.000 0.029 0.083 0.067 0.000 0.017 0.000 119 0.000 0.018 0.000 0.000 0.000 0.000 0.000 0.000 123 0.000 0.054 0.059 0.000 0.050 0.000 0.017 0.017 125 0.031 0.018 0.000 0.000 0.000 0.000 0.000 0.000 127 0.021 0.036 0.044 0.083 0.017 0.000 0.000 0.000 129 0.260 0.036 0.029 0.150 0.067 0.083 0.103 0.067 131 0.042 0.054 0.000 0.000 0.017 0.100 0.000 0.133 133 0.010 0.071 0.147 0.100 0.067 0.083 0.052 0.033 135 0.031 0.268 0.279 0.250 0.200 0.300 0.172 0.217 137 0.333 0.071 0.000 0.000 0.167 0.167 0.121 0.217 139 0.115 0.161 0.279 0.267 0.183 0.167 0.345 0.250 141 0.021 0.054 0.103 0.033 0.000 0.033 0.052 0.033 143 0.021 0.036 0.000 0.000 0.000 0.000 0.000 0.000 145 0.000 0.036 0.000 0.000 0.000 0.033 0.000 0.000 147 0.021 0.000 0.000 0.000 0.000 0.000 0.000 0.000 149 0.010 0.000 0.000 0.000 0.000 0.000 0.000 0.000 Mb-di3 145 0.000 0.000 0.015 0.000 0.000 0.000 0.000 0.000 153 0.160 0.107 0.061 0.167 0.133 0.100 0.086 0.117
155 0.021 0.000 0.000 0.000 0.000 0.000 0.000 0.000 157 0.000 0.000 0.015 0.033 0.050 0.017 0.000 0.033 159 0.000 0.107 0.000 0.000 0.000 0.017 0.000 0.000 161 0.000 0.179 0.015 0.000 0.017 0.033 0.035 0.017 163 0.000 0.446 0.788 0.650 0.650 0.550 0.603 0.433 165 0.021 0.071 0.030 0.000 0.033 0.033 0.017 0.067 167 0.000 0.018 0.000 0.033 0.033 0.000 0.000 0.000 169 0.011 0.054 0.000 0.000 0.000 0.000 0.000 0.000 171 0.000 0.000 0.076 0.117 0.083 0.250 0.259 0.333 173 0.000 0.018 0.000 0.000 0.000 0.000 0.000 0.000 175 0.064 0.000 0.000 0.000 0.000 0.000 0.000 0.000 179 0.011 0.000 0.000 0.000 0.000 0.000 0.000 0.000 181 0.521 0.000 0.000 0.000 0.000 0.000 0.000 0.000 183 0.032 0.000 0.000 0.000 0.000 0.000 0.000 0.000 185 0.096 0.000 0.000 0.000 0.000 0.000 0.000 0.000 187 0.064 0.000 0.000 0.000 0.000 0.000 0.000 0.000 Mb_Penta 1 160 0.644 0.268 0.368 0.167 0.133 0.017 0.018 0.000 165 0.000 0.018 0.000 0.000 0.000 0.000 0.000 0.000 170 0.000 0.054 0.000 0.000 0.000 0.000 0.000 0.000 175 0.000 0.000 0.147 0.067 0.083 0.067 0.036 0.069 180 0.000 0.071 0.074 0.100 0.167 0.283 0.286 0.138 185 0.011 0.214 0.044 0.083 0.217 0.217 0.232 0.259 190 0.078 0.232 0.191 0.267 0.200 0.017 0.036 0.138 195 0.167 0.125 0.029 0.033 0.133 0.067 0.000 0.017 200 0.033 0.018 0.132 0.283 0.067 0.333 0.393 0.379 205 0.067 0.000 0.015 0.000 0.000 0.000 0.000 0.000 Mb_di4 98 0.000 0.000 0.015 0.000 0.000 0.000 0.000 0.000 100 0.010 0.000 0.000 0.000 0.000 0.000 0.000 0.000 106 0.020 0.000 0.029 0.000 0.000 0.000 0.000 0.000 110 0.000 0.000 0.074 0.000 0.000 0.000 0.000 0.017 112 0.296 0.268 0.324 0.483 0.150 0.433 0.328 0.283 114 0.378 0.143 0.147 0.083 0.283 0.117 0.103 0.150 116 0.051 0.036 0.000 0.000 0.000 0.017 0.000 0.017 118 0.031 0.089 0.044 0.033 0.017 0.017 0.000 0.117 122 0.010 0.000 0.000 0.000 0.017 0.017 0.000 0.000 124 0.143 0.143 0.132 0.217 0.283 0.200 0.276 0.217 126 0.031 0.036 0.015 0.017 0.000 0.050 0.172 0.083 128 0.031 0.054 0.000 0.000 0.017 0.000 0.000 0.000 130 0.000 0.054 0.000 0.000 0.000 0.000 0.000 0.000 132 0.000 0.018 0.000 0.000 0.017 0.067 0.069 0.033 134 0.000 0.036 0.000 0.000 0.000 0.000 0.000 0.017 138 0.000 0.018 0.000 0.017 0.000 0.000 0.000 0.000
140 0.000 0.000 0.162 0.033 0.033 0.017 0.000 0.017 142 0.000 0.036 0.000 0.000 0.000 0.000 0.000 0.000 144 0.000 0.018 0.000 0.000 0.067 0.000 0.017 0.000 148 0.000 0.018 0.000 0.000 0.100 0.033 0.000 0.017 152 0.000 0.036 0.000 0.000 0.000 0.017 0.000 0.017 164 0.000 0.000 0.059 0.117 0.017 0.017 0.035 0.017 Mb_Tetra 1 131 0.020 0.000 0.000 0.000 0.000 0.000 0.000 0.000 135 0.010 0.036 0.000 0.000 0.017 0.000 0.000 0.000 137 0.000 0.000 0.000 0.000 0.035 0.000 0.000 0.000 139 0.184 0.036 0.000 0.000 0.000 0.000 0.000 0.000 143 0.735 0.607 0.779 0.717 0.741 0.767 0.931 0.833 147 0.031 0.125 0.177 0.217 0.052 0.150 0.069 0.117 149 0.000 0.071 0.044 0.000 0.000 0.000 0.000 0.000 151 0.020 0.018 0.000 0.000 0.035 0.033 0.000 0.000 157 0.000 0.107 0.000 0.050 0.121 0.033 0.000 0.050 169 0.000 0.000 0.000 0.017 0.000 0.017 0.000 0.000 Mb_Tri 1 107 0.000 0.018 0.044 0.000 0.000 0.000 0.000 0.000 113 0.000 0.839 0.882 0.900 0.931 0.817 0.948 0.862 116 0.702 0.071 0.015 0.017 0.052 0.000 0.000 0.000 119 0.043 0.071 0.059 0.083 0.017 0.183 0.052 0.138 122 0.096 0.000 0.000 0.000 0.000 0.000 0.000 0.000 125 0.160 0.000 0.000 0.000 0.000 0.000 0.000 0.000 Mb_Tri2 138 0.000 0.143 0.206 0.283 0.300 0.383 0.207 0.333 144 0.958 0.554 0.662 0.533 0.583 0.483 0.776 0.617 145 0.010 0.000 0.000 0.000 0.000 0.000 0.000 0.000 147 0.000 0.286 0.118 0.167 0.067 0.083 0.017 0.017 150 0.031 0.018 0.015 0.017 0.050 0.033 0.000 0.033 153 0.000 0.000 0.000 0.000 0.000 0.017 0.000 0.000 Mb_di5 83 0.000 0.000 0.059 0.167 0.250 0.172 0.103 0.100 85 0.010 0.018 0.162 0.017 0.000 0.000 0.000 0.000 87 0.000 0.071 0.000 0.000 0.067 0.052 0.069 0.067 89 0.000 0.089 0.000 0.033 0.033 0.000 0.000 0.000 91 0.500 0.446 0.427 0.433 0.317 0.328 0.431 0.417 93 0.000 0.143 0.000 0.083 0.067 0.035 0.000 0.017 95 0.398 0.161 0.059 0.067 0.200 0.259 0.224 0.200 97 0.010 0.054 0.088 0.067 0.050 0.121 0.069 0.167 99 0.051 0.018 0.000 0.000 0.000 0.000 0.000 0.000 101 0.031 0.000 0.132 0.017 0.017 0.035 0.103 0.033 105 0.000 0.000 0.059 0.117 0.000 0.000 0.000 0.000
Mb_Tetra2 156 0.000 0.000 0.029 0.000 0.000 0.000 0.000 0.000 160 0.051 0.000 0.000 0.000 0.000 0.000 0.000 0.000 168 0.000 0.000 0.044 0.017 0.033 0.000 0.000 0.052 172 0.010 0.054 0.000 0.000 0.000 0.000 0.000 0.000 176 0.010 0.036 0.000 0.000 0.000 0.000 0.000 0.000 180 0.020 0.196 0.338 0.207 0.200 0.133 0.155 0.241 184 0.214 0.054 0.118 0.017 0.017 0.000 0.000 0.000 188 0.133 0.089 0.088 0.086 0.050 0.000 0.000 0.000 192 0.388 0.161 0.015 0.052 0.017 0.000 0.000 0.000 196 0.092 0.071 0.044 0.017 0.017 0.067 0.000 0.000 200 0.071 0.018 0.029 0.035 0.050 0.033 0.017 0.017 204 0.010 0.071 0.162 0.310 0.300 0.283 0.379 0.293 208 0.000 0.071 0.000 0.121 0.217 0.383 0.259 0.276 212 0.000 0.036 0.132 0.121 0.033 0.100 0.172 0.035 220 0.000 0.036 0.000 0.000 0.017 0.000 0.000 0.000 224 0.000 0.018 0.000 0.000 0.000 0.000 0.000 0.000 228 0.000 0.018 0.000 0.017 0.050 0.000 0.017 0.086 232 0.000 0.018 0.000 0.000 0.000 0.000 0.000 0.000 240 0.000 0.018 0.000 0.000 0.000 0.000 0.000 0.000 248 0.000 0.018 0.000 0.000 0.000 0.000 0.000 0.000 252 0.000 0.018 0.000 0.000 0.000 0.000 0.000 0.000 Mb_Tri 3 127 0.000 0.000 0.000 0.000 0.035 0.000 0.000 0.000 133 0.684 0.857 0.794 0.767 0.776 0.867 0.857 0.900 142 0.306 0.089 0.162 0.183 0.121 0.133 0.107 0.100 148 0.010 0.000 0.000 0.000 0.000 0.000 0.000 0.000 154 0.000 0.054 0.044 0.050 0.069 0.000 0.036 0.000 Mb_Tri 4 99 0.796 0.446 0.221 0.317 0.283 0.133 0.138 0.233 102 0.204 0.214 0.368 0.250 0.250 0.600 0.603 0.550 108 0.000 0.000 0.029 0.000 0.000 0.000 0.000 0.000 111 0.000 0.268 0.294 0.367 0.400 0.217 0.241 0.183 114 0.000 0.071 0.088 0.067 0.067 0.050 0.017 0.033