Impact of local soil and subsoil conditions on inter-individual variations in tree responses to drought: insights from Electrical Resistivity Tomography
Texte intégral
Figure


Documents relatifs
The responses of soil respiration (R s ) of the 13 C isotopic signature of CO 2 respired from the whole soil (δ 13 CR s ), and its autotrophic (live roots and rhizosphere, δ 13 CR a
For this simulation the discharge hydrograph at the upstream end of the creek was used as physical boundary condition and subsequent hydrographs, entering Valdecarro Creek through
Thus, the present study aimed to evaluate the interactions between productivity, response to the drought of eucalyptus and the attributes of the Soils in Brazil (tropical
Elle accusait un grand retard et il était temps de se décider, elle opta donc pour une école à quelques pâtés de maisons et rendez-vous était pris pour le lendemain... La
The aim of this study was to discuss the feasibility of 3D electrical resistivity measurements to characterise the 3D structure of the cultivated layer in situ. Both the
Th e 2D profi les from the apparent and interpreted electri- cal resistivity values (WEN1 to WEN5) exhibited the same 3 classes for measurements near the soil surface: the WEN3
Here we show that differences in drought tolerance are associated with differences in ge- ographic distribution between the two species, but that the underlying differences
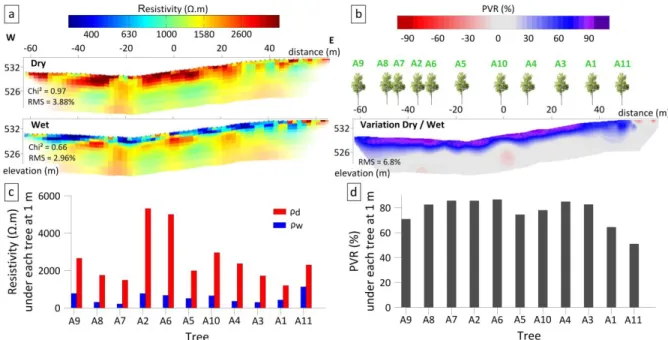
We observed the lateral heterogeneity of ERT-derived fraction of transpirable soil wa- ter (FTSW) variations, and differences in water uptake depend on grapevine water status
