HAL Id: hal-00959583
https://hal.archives-ouvertes.fr/hal-00959583
Submitted on 30 Jun 2019HAL is a multi-disciplinary open access archive for the deposit and dissemination of sci-entific research documents, whether they are pub-lished or not. The documents may come from teaching and research institutions in France or abroad, or from public or private research centers.
L’archive ouverte pluridisciplinaire HAL, est destinée au dépôt et à la diffusion de documents scientifiques de niveau recherche, publiés ou non, émanant des établissements d’enseignement et de recherche français ou étrangers, des laboratoires publics ou privés.
structure-activity relationships
Charlotte Drappier, Hugo de Oliveira, Olivier Sandre, Emmanuel Ibarboure,
Sophie Combet, Elisabeth Garanger, Sébastien Lecommandoux
To cite this version:
Charlotte Drappier, Hugo de Oliveira, Olivier Sandre, Emmanuel Ibarboure, Sophie Combet, et al.. Self-assembled core-shell micelles from peptide-b-polymer molecular chimeras towards structure-activity relationships. Faraday Discussions, Royal Society of Chemistry, 2013, 166, pp.83-100. �10.1039/c3fd00098b�. �hal-00959583�
Self-assembled core-shell micelles from peptide-b-polymer molecular
chimeras towards structure-activity relationships
Charlotte Drappier,§,a,b,c Hugo Oliveira,§,a,b Olivier Sandre,a,b Emmanuel Ibarboure,a,b Sophie Combet,d
Elisabeth Garanger*,a,b,c and Sébastien Lecommandouxa,b
a
Université de Bordeaux, ENSCBP, 16 avenue Pey Berland, Pessac 33607 Cedex, France.
b
CNRS, LCPO, UMR 5629, Pessac 33607, France.
c
Institut Européen de Chimie et Biologie, 2 rue Robert Escarpit, Pessac 33607, France.
d
Laboratoire Léon Brillouin, CEA-CNRS UMR 12, CEA-Saclay, Gif-sur-Yvette 91191, France.
* Fax: 33 54000 8487; Tel: 33 54000 3035; E-mail: [email protected].
§These authors contributed equally to this work.
Abstract
The aim of this contribution is to design, produce and characterize size-tuneable core-shell micelles from amphiphilic Tat-b-poly(trimethylene carbonate) (Tat-b-PTMC) molecular chimeras, and to explore their biological properties. Because the extensive characterization of nanomaterials is a pre-requisite to understand and rationalize their ensuing properties, we present a detailed description of Tat-b-PTMC micelles thanks to light scattering, AFM imaging and small angle neutron scattering analyses. In vitro, Tat-b-PTMC micelles were found to be rapidly and efficiently internalized by HeLa cells, with cellular uptake kinetics being mostly related to Tat peptide content and, in a lesser extent, to nanoparticle size. We also demonstrated that, after a first membrane-binding step, Tat-b-PTMC micelles were taken up by cells via an energy-dependent endocytotic process.
Introduction
Amphiphilic block copolymers have conquered the field of nanotechnology in a broad range of application domains such as health, communication and information, and energy, where the design of functional nanomaterials remains a major challenge. Synthetic block copolymers possess tremendous self-assembly propensities and have thus been extensively used in the past twenty years to generate by
spontaneous self-assembly complex and well-defined structures at the micro- and nano-scale.1, 2 In the
specific fields of biomimetic nanotechnologies and nanomedicine, specifically engineered amphiphilic block copolymers have been used for tissue engineering or for the design of bioactive surfaces and drug delivery vehicles.3 , 4 Among those, polypeptides are extremely attractive polymer segments
regarding their biomimetism, biocompatibility, biodegradability, secondary structures and self-assembly properties in aqueous solution.5 However, polypeptides (or more properly poly(amino
acids)) remain relatively primitive as compared with their natural counterparts, namely peptides and proteins, so that vesicular or micellar morphologies obtained from amphiphilic block copolypeptides can only possess limited interactions with biological environments. To overcome this limitation, a widely used strategy consists in incorporating bioactive molecules such as receptor-specific ligands (e.g. saccharides, peptides, full antibodies or fragments, aptamers, low-molecular weight organic molecules) by surface functionalization to promote specific interactions.6 However this process
presents significant pitfalls (scalability, batch-to-batch reproducibility, etc...) as discussed earlier.7 The
development of molecular chimeras, fully equipped at the molecular level with self-assembly properties and biological functions (similarly to biological molecules forming natural self-assemblies), thus represents an attractive alternative.8, 9, 10, 11, 12, 13
In this context, we have chosen to investigate amphiphilic peptide-b-polymer molecular chimeras that combine advantageous features of block copolymers (i.e. orthogonal block solubility, self-assembly propensity, elasticity) with those of peptides and protein domains (e.g. secondary structure, biological activity, molecular target specificity, diversity, biocompatibility). In the present work, we specifically focused on Tat-b-PTMC chimeras, featuring a biocompatible poly(trimethylene carbonate) (PTMC) polymer segment with compelling self-assembly properties,14 and the Tat
47-57 sequence from HIV-1
transcription transactivator protein (TAT), with well-established cell-penetrating properties,15 as the
bioactive peptide segment in order to access nano-assemblies specifically dedicated to cellular internalization. In a recent publication,16 we have described the precision synthesis, via a convergent
synthetic route involving a chemoselective Michael-type thiol-maleimide ligation of polymer and peptide segments synthesized separately beforehand, of a series of chimeras with different hydrophilic weight fractions, as well as their characterisation through advanced complementary techniques including DOSY NMR spectroscopy and MALDI mass spectrometry. Chimeras with a constant peptide block and an increasing polymer block length, self-assembled by a straightforward direct dissolution in Tris buffer, formed highly monodisperse and stable core–shell nanometer-sized particles with gradually increasing diameters, as revealed by microscopy (AFM, TEM) and multi-angle dynamic light scattering techniques. In the present study, we aimed at correlating nanoparticle physico-chemical characteristics with their biological properties. We selected two chimeras featuring PTMC blocks with polymerization degree (DPn) of 30 (Tat-b-PTMC30) and 66 (Tat-b-PTMC66)
forming micelles with respective hydrodynamic radii (RH) of 12 nm and 20 nm (Figure 1).16 We first
physico-chemical data and to provide a comprehensive characterization of nanoparticles. Presenting a Tat-rich corona, strongly positively charged, these micelles are expected to present remarkable cell transduction ability, but also substantial toxicity. We thus thoroughly investigated these two properties in vitro on HeLa cells using flow cytometry and confocal microscopy techniques. Finally, biological experiments were also conducted on nanoparticles of the same size but with varying Tat surface-density. Micelles obtained from the co-assembly of Tat-b-PTMC30 chimera and PEG2,000-b-PTMC38
were thus designed to point out the impact of the density of the bioactive Tat peptide on the surface of nanoparticles, and eventually to clarify their internalization mechanism.
Figure 1 Size-tuneable micelles obtained from amphiphilic Tat-b-PTMC molecular chimeras.
Hydrodynamic radius (RH) and polydispersity index (PDi) measured by multi-angle dynamic light
scattering, and tapping mode AFM images (1x1 µm) of Tat-b-PTMC30 (panel A) and Tat-b-PTMC66
(panel B) dispersions.
Experimental section
Materials and reagents
All cell culture reagents were purchased from Gibco® Life Technologies (Invitrogen). HeLa cells were kindly provided by Prof. Martin Teichmann (IECB, Bordeaux, France). Thiazolyl blue tetrazolium bromide (MTT) was supplied by Euromedex. 4',6-Diamidino-2-phenylindole (DAPI) and
5-((5-aminopentyl)thioureidyl)fluorescein (Fluorescein-cadaverine) were obtained from VWR. Fluoromount-G™ aqueous mounting medium was supplied by SouthernBiotech. Trimethylene
carbonate (1,3-dioxane-2-one; TMC) was kindly provided by Labso chimie fine (Boehringer Ingelheim) and purified by four successive recrystallizations in dry toluene. MeO-PEG2,000-OH was
supplied by Fluka. O-Benzotriazole-N,N,N’,N’-tetramethyl-uronium-hexafluoro-phosphate (HBTU) was obtained from Iris Biotech GmbH. Solvents (DMF, DMSO and dichloromethane) and all other chemical reagents were purchased from Sigma-Aldrich. Dichloromethane was thoroughly dried over calcium hydride and distilled under reduced pressure. PTMC homopolymers and Tat-b-PTMC chimeras were synthesized as described previously.16
Synthesis of PEG2,000-b-PTMC33 and PEG2,000-b-PTMC38 block copolymers
The procedure described below was adapted from Nederberg et al. for a target polymerization degree (DP) of 38 and adjusted for a DP of 33.17 In a flame-dried Schlenk flask, MeO-PEG
2,000-OH (1 g, 0.5
mmol) was freeze-dried in dioxane. Under inert atmosphere (argon, <0.5 ppm O2, <5 ppm H2O), TMC
(2 g, 20 mmol in 10 mL dichloromethane) and distilled DBU (1,8-diazabicyclo[5.4.0]undec-7-ene, 50 µL, 334 µmol) were subsequently added and the polymerization was allowed to proceed to full conversion at room temperature under vigorous stirring for 48 hrs. The reaction was quenched with an excess acetic acid. The polymer was precipitated twice in cold methanol and dried under vacuum. The block copolymer was characterized by 1H NMR spectroscopy in CD
2Cl2 and by size exclusion
chromatography (SEC) in THF as described previously.16 DP
n of PTMC block found as 38; Notation
PEG2,000-b-PTMC38; Mnexp=5876 g.mol-1; PD=1.04; Mass yield=87% (2.62 g); 1H NMR (CDCl3) δ
4.30 (t, 2H, CH2OCH2CH2OC(O)); 4.24 (t, 4(n-1)H, C(O)OCH2CH2CH2OC(O)); 3.74 (q, 2H,
OCH2CH2CH2OH); 3.64 (s, 4x45H, OCH2CH2O); 3.38 (s, 3H, CH3OCH2CH2O); 2.05 (qt, 2(n-1)H,
C(O)OCH2CH2-CH2OC(O)); 1.92 (qt, 2H, OCH2CH2CH2OH).
Synthesis of Fluorescein-labelled PTMC30 (Fluorescein-PTMC30)
i) Carboxylic acid end chain functionalization of PTMC30 (PTMC30 -COOH)
PTMC30 (500 mg, 0.16 mmol) was dissolved in 1.5 mL DMF. Separately, succinic anhydride (316 mg,
3.16 mmol) and DMAP (4-dimethylaminopyridine, 38.6 mg, 0.32 mmol) were dissolved in 1.5 mL DMF. The solutions were then mixed together and stirred overnight at room temperature. The polymer was precipitated 3 times in cold methanol to eliminate any trace of succinic acid, dried under-vacuum and characterized by 1H NMR spectroscopy and SEC in THF. Notation PTMC
30-COOH; Mnexp=3248
g.mol-1; PD=1.06; Mass yield=72% (250 mg); 1H NMR (CD
2Cl2) 4.18 (t, 4nH,
C(O)OCH2CH2CH2OC(O)); 4.12 (t, 2H, OCH2CH2CH(CH3)2); 2.60 (m, 4H,
C(O)OCH2CH2OC(O)OH); 2.01 (qt, 2nH, C(O)OCH2CH2-CH2OC(O)); 1.68 (m, 1H,
OCH2CH2CH(CH3)2); 1.53 (q, 2H, OCH2CH2CH(CH3)2); 0.91 (d, 6H, OCH2CH2CH(CH3)2). ii) Fluorescein coupling
PTMC30-COOH (15 mg, 4.6 µmol) was dissolved in 135 µL DMF and 54 µL HBTU in DMF was
added (5.2 mg, 14.2 µmol). Separately, Fluorescein-cadaverine (6.8 mg, 9.4 µmol) was dissolved in 137 µL DMSO containing 49 µL of DIEA (N,N-diisopropylethylamine, 2.5 µL, 14.2 µmol) in DMF. The solutions were then mixed together and stirred protected from light overnight at room temperature. Ultrapure water (1 mL) was poured under magnetic stirring and the resulting dispersion was then extensively dialyzed, using 25 kDa cut-off tubing, against water to remove unreacted dye. Quantitative coupling was assessed by 1H NMR spectroscopy. Notation Fluorescein-PTMC
30;
Mnexp=3882 g.mol-1; 1H NMR (DMSO-d6) 6.5-8 (8H, aromatic protons); 4.13 (t, 4nH,
C(O)OCH2CH2CH2OC(O)); 4.05 (t, 2H, OCH2CH2CH(CH3)2); 3.47 (q, 2H,
C(S)NHCH2CH2CH2CH2CH2NH); 3.05 (q, 2H, C(S)NHCH2CH2CH2CH2CH2NHC(O)); 2.67 (m, 2H,
C(O)OCH2CH2OC(O)NH); 2.33 (m, 2H, C(O)OCH2CH2OC(O)NH); 1.94 (qt, 2nH, C(O)OCH2CH
2-CH2OC(O)); 1.63 (m, 1H, OCH2CH2CH(CH3)2); 1.57 (m, 4H, C(S)NHCH2CH2CH2CH2CH2NHC(O));
1.49 (q, 2H, OCH2CH2CH(CH3)2); 1.32 (m, 2H, C(S)NHCH2CH2CH2CH2CH2NHC(O)); 0.88 (d, 6H,
OCH2CH2CH(CH3)2).
Preparation of nanoparticles – General procedure
Tat-b-PTMC30 and Tat-b-PTMC66 nanoparticles for SANS analysis were prepared in D2O at 10
mg.mL-1 concentration using a similar procedure as described previously.16
Fluorescent Tat-b-PTMC30 and Tat-b-PTMC66 nanoparticles used in the internalization and toxicity
studies were prepared by direct dissolution in aqueous buffer as described in the following. Fluorescein-PTMC30 (3 mg, 0.772 µmol) and Tat-b-PTMC chimera (9.7 mg) were separately
dissolved in 100 µL DMSO. Ten µL of the fluorescein-PTMC30 solution was then added to the later.
Ammonium acetate buffer (2 mL, 30 mM, pH 5) was poured under stirring. The resulting dispersion was extensively dialyzed against ammonium acetate buffer using 25 kDa cut-off tubing and lyophilized. The resulting bulk (97:3) w/w mix of Tat-b-PTMC/Fluorescein-PTMC30 (10 mg) was
self-assembled by direct dissolution at room temperature in 10 mM Tris buffer (1 mL) at pH 7.4 for 24 hrs.
Fluorescent PEG2,000-b-PTMC33 and mixed Tat-b-PTMC30/PEG2,000-b-PTMC38 nanoparticles were
prepared by a solvent-displacement process also called “nanoprecipitation”.18 Fluorescein-PTMC 30,
Tat-b-PTMC30 chimera and PEG2,000-b-PTMC block copolymer were dissolved separately in DMSO
and mixed together in variable proportions (detailed in the table below) so as to obtain 10 mg of the different blends in a final volume of 100 µL DMSO:
% w/w
Entry Tat-b-PTMC30 PEG2,000-b-PTMC38 PEG2,000-b-PTMC33 Fluorescein-PTMC30
100% Tat 97 0 0 3
75% Tat 73 24 0 3
25% Tat 24 73 0 3
0% Tat 0 97 0 3
PEG2,000-b-PTMC33 0 0 97 3
Tris buffer (600 µL, 10 mM, pH 7.4) was then poured in the mixture under stirring. The homogenous dispersions obtained were subsequently extensively dialyzed using 25 kDa cut-off tubing against Tris buffer to remove any trace of organic solvent.
Dispersions containing fluorescent nanoparticles were carefully handled protected from light and sterilized by filtration over sterile 0.22 µM pore-sized low-protein binding Millex® syringe filter units prior use. Final concentration was determined by dry extract weighing.
Dynamic light scattering and zeta potential measurements
Dynamic light scattering and zeta potential measurements were performed using a Malvern Nano ZS ZetaSizer equipped with a standard 632.8 nm HeNe laser. The data were recorded at 25°C with a scattering angle of 90°, and mean hydrodynamic diameters and size distributions were determined with the second order cumulant analysis method.
For zeta potential measurements, samples were diluted ten fold in 1 mM NaCl. Laser Doppler micro-electrophoresis was conducted using M3-PALS (Phase analysis Light Scattering) Malvern technology with sequential fast and slow field reversal applying a potential of ±150 V. The so-measured electrophoretic mobility (µ) was then converted to zeta potential (ζ) using the Smoluchowski approximation.
Small angle neutron scattering experiments
SANS measurements were performed on the PACE spectrometer of Laboratoire Léon Brillouin (CEA- Saclay, France) equipped with an isotropic BF3 detector made of 30 concentring rings of 1 cm width
each. We used three configurations: the first one with a sample-to-detector distance D of 4.7 m and a neutron wavelength λ of 13 Å to cover a q range of 3.2×10⁻³ – 1.4×10⁻² Å-1; the second one with D=4.7 m and λ=5 Å to cover a q range of 1.3×10⁻² – 8.8×10⁻² Å-1; and the third one with D=0.9 m and λ=5 Å
to cover a q range of 8.3×10⁻² – 0.5 Å-1. Tat-b-PTMC
30 (C81H136N37O19S + 30×(C5H6O3) + C5H11) and
Tat-b-PTMC66 (C81H136N37O19S + 66×(C5H6O3) + C5H11) chimeras both have a theoretical neutron
scattering length density (SLD) ρn of 1.47×1010 cm-2 significantly different from the value of PTMC
homopolymer (ρn=1.27×1010 cm-2). When dissolved in D2O (ρn=6.34×1010 cm-2), the theoretical
contrast is n=4.87×1010 cm-2. Measurements were performed at a concentration of 10 mg.mL-1 in a 2 mm thick quartz cuvette. Scattered intensities were corrected for the transmission factor and incoherent backgrounds. They were normalized by the flat signal of a cuvette filled with light water to correct the detector efficiency and converted into absolute units (cm-1).19 In order to fit the SANS
curves, the form factor of a polydisperse suspension of spheres of volume fraction Φ and SLD contrast ∆ρn was computed numerically using the following formulas20:
(Eq. 1) Using a Log-normal distribution to represent the size-dispersity:
(Eq. 2) In particular, when q→0, the intensity I(q) tends towards:
(Eq. 3) The scattering invariant was computed by numerical integration of the scattering curve:
(Eq. 4)
The knowledge of this invariant and of the volume fraction enables to determine the actual SLD contrast ∆ρn accurately. The volume-averaged volume <V2>/<V> of the particles can thus be deduced
from (Eq. 3). All these equations were computed numerically using MS Excel (data file provided in Supplementary Information). The parameters R0 and σ of the distribution of radii were determined by
least-squares fitting of the experimental curve Iexp(q) with the curve Icalc(q) calculated with equations
(1) and (2). The sum of squares Σ(Fexp-Fcalc)2/(∆F)2 (where the denominator is the experimental error)
was minimized both for F=I(q) and F=I(q)×q4 in order to fit the curve over the whole q-range.
Cell culture
The HeLa (Human cervical carcinoma) cell line was routinely cultured in Dulbecco’s Modified Eagle Medium (DMEM) supplemented with 10% (v/v) foetal bovine serum (FBS), 100 units.mL-1 penicillin
and 100 µg.mL-1 streptomycin. Cells were maintained at 37°C in a 5% CO
2 humidified incubator
using standard tissue culture protocols.
Cell viability assay – General procedure
Reporting to growth curves to ensure a constant exponential growth and prevent cell packing from introducing any bias, cells were seeded at a density of 7x10³ cells.cm-2 on 96-well plates and grown
for 24 hrs prior treatment. Cells were then exposed to the different nanoparticle dispersions diluted ten times in medium at designated times and concentrations. After 72 hrs, the medium was removed and cells were incubated at 37ºC for 3 hrs with 0.5 mg.mL-1 MTT in medium (5 mg.mL-1 solution in PBS
diluted 10 times in medium). The medium was subsequently discarded and the same volume of DMSO was added to dissolve formazan crystals formed. Optical density of the supernatant was
( )
(
)
( )
( )
( )
2 3 3 0 2 n 3 0 sin cos 4 (R)d ∆ 4 (R)d 3 qR qR qR R P R qR I q R P R π ρ π ∞ ∞ − = Φ ∫
∫
2 2 0 1 1 ( ) exp ln 2 2 R P R R R σ πσ = − ( )
(
)
(
)
2 3 2 0 2 2 n n 0 3 0 4 P(R)d 3 ∆ ∆ 4 P(R)d 3 q R R V I q V R R π ρ ρ π ∞ → ∞ → Φ = Φ ∫
∫
( )
2 2(
)(
)
2 n 0I q q dq 2π 1 ∆ρ ∞ = Φ − Φ∫
measured at 540 nm using a SpectraMaxTM Molecular Devices microplate UV-Vis spectrophotometerResults were expressed as the percentage of metabolic activity of treated cells relative to untreated cells. Independent experiments were carried out 3 times with 4 replicates per condition.
Cellular uptake studies - Flow cytometry analysis
HeLa cells were sub-cultured in 24-well plates for 24 hrs at a density of 15x103 cells.cm-2 and exposed
to the different nanoparticle dispersions diluted ten fold in medium (to a final 50 µg.mL-1
concentration) for variable times (i.e. 15 min, 30 min, 2 hrs and 4 hrs) at 37°C or 4°C. For 4°C experiments, plates were cooled down for 15 min prior to exposure. After medium removal, cells were rinsed twice with PBS, trypsinized with a 0.05% Trypsin/EDTA solution for 5 min at 37°C, recovered in medium and centrifuged for 4 min at 1,000 rpm. Cell pellets were then re-suspended in PBS containing 0.5% BSA and 1 mM EDTA and kept cold until analysis. Flow cytometry analysis were performed at UMS3033 (IECB, Bordeaux, France) using a FACS Aria cytometer (BD Biosciences, USA) equipped with Argon ion laser tuned to 488 nm. Ten thousand gated events were measured for each replicate and analysed by histogram for green fluorescence using the BD FACSDiva software (version 5.0.3, USA). Independent experiments were carried out 3 times with 3 replicates per condition.
Cellular uptake studies - Laser Scanning Confocal Microscopy (LSCM) analysis
HeLa cells were sub-cultured for 24 hrs at a density of 15x103 cells.cm-2 in 12-well plates containing
nitric acid-treated 18 mm glass coverslips. Cells were exposed to the different nanoparticle dispersions diluted ten fold in medium (to final 50 µg.mL-1 concentration) for 30 min at 37°C or 4°C. For 4°C
experiments, plates were cooled down for 15 min prior exposure. After medium removal, cells were rinsed twice with PBS and fixed with p-formaldehyde 3.7% (w/v) in PBS for 15 min at 37ºC. Cells were then washed with PBS, stained with DAPI (5 mg.mL-1) in PBS for 5 min at room temperature,
rinsed again with PBS and mounted for microscopy. Laser Scanning Confocal Microscopy images were acquired on an inverted Leica TCS SP5 microscope equipped with an HCX PL APO 63X, NA 1.4 oil immersion objective in fluorescence mode. The laser outputs were controlled via the Acousto-Optical Tunable Filter (AOTF) and the two collection windows using the Acousto-Acousto-Optical Beam Splitter (AOBS) and photomultiplicators (PMT) as follows: DAPI was excited with a diode laser at 405 nm (12.5%) and measured with emission settings at 416-463 nm, FITC was excited with an argon laser at 488 nm (15%) using a 498-549 nm window. The Helium-Neon laser at 633 nm (14%) was only used in transmission mode. Images were collected using the microscope in sequential mode with a line average of 4 and a format of 1024*512 pixels or 1024*256 pixels. A Z-stack of 50 frames covering a depth of 10 µm was recorded for assessment of label distribution across the section.
Photomutliplicators gain and offset configurations were set up on control cells so as to correct images from green auto-fluorescence signal.
Statistical analysis
Using the Graphpad Prism 5.0 software, statistically significant differences between two groups were analysed by non-parametric Man-Whitney test. Statistically significant differences between several groups were analysed by non-parametric Kruskal–Wallis test, followed by Dunns post-test. A p value lower than 0.05 was considered statistically significant.
Results and discussion
SANS analysis
Although our previous physico-chemical characterizations of Tat-b-PTMC self-assemblies left no doubt on their micellar morphology and low size dispersity,16 an extensive analysis of the internal
structure of micelles was rather impossible due to the low scattering intensity of solutions, preventing us from calculating radii of gyration and molecular weights of micelles. To bring a further insight into the structural characterization, and especially to determine relevant parameters regarding their biological properties such as aggregation numbers and densities of Tat peptide per particle, small angle neutron scattering experiments were thus performed on Tat-b-PTMC30 and Tat-b-PTMC66
self-assemblies in D2O. All resulting data are summarized in Table 1.
Table 1 Comprehensive physico-chemical characteristics of Tat-b-PTMC micelles.
Previous data from [16] SANS
Sample RH
a/nm
(PDI) ζb/mV RAFMc/nm RG/nm R0d/nm(σ) <V 2>/<V>
/cm3 Rave/nm Nagg N/nmagg/S-2ave ∆ρne/cm-2 N(D2O)
Tat-b-PTMC30 12 (0.09) +41±2 5.1±0.7 7.1 7.2 (0.15) 2.14×10⁻¹⁸ 8.0 253 0.32 3.43×10¹⁰ 126
Tat-b-PTMC66 20 (0.03) +37±2 10.7±0.7 9.9 11.0 (0.14) 7.34×10⁻¹⁸ 12.1 504 0.28 3.58×10¹⁰ 188 a Determined by multi-angle DLS. b Obtained by zeta potential measurements. c Calculated from area and height of discs spread on mica. d Parameters of Log-normal distribution. e Deduced from the invariant (Eq. 4).
In the low q-regime, the micelles radius of gyration (RG) can be calculated using the Guinier
approximation from the slope of ln(I(q)) plot as a function of q2. This resulted in 7.1 nm and 9.9 nm
RG values for Tat-b-PTMC30 and Tat-b-PTMC66 micelles, respectively. The ensuing ρ=RG/RH ratios,
precisely 0.59 for Tat-b-PTMC30 and 0.50 for Tat-b-PTMC66, were found a bit too low as compared to
the 0.775 ρ value usually expected for uniform spherical micelles.21 This can be ascribed to an
underestimation of RG due to repulsive interactions between micelles, leading to a structure factor
micelles reported in Table 1). In the mean time, the hydrodynamic radius (RH) is probably
over-estimated due to electrostatic repulsions within the shell. In the following, R values were thus re-estimated from the average sphere radii (Rave) deduced from the fit of the whole SANS curves rather
than on Guinier’s plateau. (Vide infra) Radii determined by SANS were nevertheless in line with radii previously calculated from AFM section dimensions (RAFM) for which the same important gap was
observed as compared to hydrodynamic dimensions. We assume that this originates from a significant hydration shell complying with the highly hydrophilic and charged peptide corona.
At intermediate wave-vectors, intensity oscillations with an envelope varying as q-4 were typical of
well-defined spherical structures with narrow size dispersity. (Figure 2, panel A) The curves present relative minima related to the radius R of nanoparticles as expected with monodisperse spheres at theoretical values q×R=4.5 (1st order) and 7.7 (2nd order). The curves were nicely fitted with the form
factor of filled spheres, with radii described by a Log-normal distribution law, of median R0=7.2 nm
for Tat-b-PTMC30 and R0=11.0 nm for Tat-b-PTMC66 micelles and respective widths of σ=0.15 and
σ=0.14. (Figure 2, panel B) The distributions being particularly narrow, was nearly identical to the coefficient of variation (ratio of standard width on mean radius), respectively 15 % and 14 %. From this Log-normal probability law obtained by curve fitting, we calculated the average volume of the volume-weighted distribution (<V2>/<V>) and deduced the volume-averaged radius of the particles
(Rave). New ratios ρ’=Rave/RH could thus be computed and were found as 0.67 for Tat-b-PTMC30 and
0.60 for Tat-b-PTMC66, which are closer to the expected value for homogeneous micelles. The number
of chains per particle, also called aggregation number (Nagg) could also be deduced. The value
Nagg=504 for Tat-b-PTMC66 was found to be about twice that of Tat-b-PTMC30, Nagg=253. When
divided by the average surface of the sphere Save=4π×Rave2, this gave an almost constant density of Tat
peptide per unit of surface area: Nagg/Save=0.30±0.02 unit.nm-2. This finding is consistent with the
hypothesis that electrostatic repulsions between cationic peptide blocks impose a limited and rather constant surface packing and a high curvature, explaining why micellar morphologies were found whatever the hydrophilic weight fraction.16 The length of the PTMC block only mainly impacts the
hydrophobic core dimension.
Finally, a non-negligible lowering was observed between the calculated scattering length density contrast based on the chemical formulas (see Experimental Section) and the experimental values deduced from the calculated scattering invariant reported in Table 1. This can be explained by the labile exchange from light to heavy protons in the hydration shell of micelles, D2O molecules
associated to the shell lowering the contrast with the solvent. Based on this assumption, we recalculated the effective neutron SLD values of hydrated molecules, ρn=2.91×1010 cm-2 for
Tat-b-PTMC30 and ρn=2.76×1010 cm-2 for Tat-b-PTMC66. We deduced that 126 and 188 D2O molecules per
chain were associated to Tat-b-PTMC30 and Tat-b-PTMC66 micelles, respectively. Considering the
surface area of the peptide Save/Nagg of 317 Å2 for Tat-b-PTMC30 and 362 Å2 for Tat-b-PTMC66, we
respectively. The projected area of a water molecule being around 9 Å2, we estimated the hydration
shell to be made of 4 molecular layers of water on average.
Figure 2 (A) SANS curves of Tat-b-PTMC30 (red circles) and Tat-b-PTMC66 (blue squares) at =1%
in D2O. Solid lines are fits with the form factor of polydisperse spheres with a Log-normal distribution
of radii (Table 1). (B) Log-normal distributions of radii deduced from the fits.
Cellular uptake studies
Regarding the powerful cell-penetrating properties of Tat47-57 peptide,15 originally stemming from the
protein transduction domain of the transcription transactivator protein (TAT) of HIV-1,22 Tat-b-PTMC30 and Tat-b-PTMC66 micelles were expected to present remarkable cell transduction ability due
to the multivalent presentation of the peptide in the corona.23 The cellular uptake process was thus
investigated in vitro on the HeLa cell line model. Micelles with a hydrodynamic diameter of 26 nm and 0.06 polydispersity index, obtained from the self-assembly of a PEG2,000-b-PTMC33 block
copolymer (further noted PEG-b-PTMC33), were used as negative control. In order to enable their
detection by fluorescence, nanoparticles were labelled by incorporating 3% w/w Fluorescein-PTMC30
into the bulk Tat-b-PTMC chimeras (or PEG-b-PTMC33 block copolymer) prior to self-assembly. This
amount of labelling was sufficient to ensure proper detection and low enough to prevent any deleterious effect on the self-assembly process. The procedure also insured equal fluorescence intensity per weight of particle for the three different formulations, namely Tat-b-PTMC30,
Tat-b-PTMC66 and PEG-b-PTMC33.
Cell internalization kinetics was first addressed by incubating HeLa cells with nanoparticles over a variable time course, from 15 min to 4 hrs. The effective intracellular uptake was qualitatively evidenced by laser scanning confocal microscopy (LSCM) imaging, and quantitatively assessed by flow cytometry. (Figure 3) The capacity of Tat-b-PTMC micelles to be readily internalized by cells was revealed by the green punctual intracellular pattern of fluorescence observed by LCSM,
0.001 0.01 0.1 1 10 100 0.01 0.1 In te n s it y I (q ) c m -1 Wavevector q Å-1 0 0.005 0.01 0.015 0.02 0.025 0.03 0.035 0.04 20 30 40 50 60 70 80 90100 200 P ro b a b ili ty P (R ) Radius R Å A) B)
suggesting nanoparticles accumulation in cytoplasmic vesicular compartments. (Figure 3, panel C) No signal was detected inside the nucleus indicating that, in the current experimental conditions, the tested formulations, most probably trapped in endosomes, were not given the chance to reach, and eventually to cross, the nuclear membrane. As measured by FACS, 100% cells were positive after 2 hrs of exposure, and their mean fluorescence intensity was at least 103 times higher for Tat-b-PTMC
micelle-treated cells as compared to non-treated cells. (Figure 3, panel A and B) Cell uptake occurred in homogenous fashion as evidenced by the presence of a single fluorescent cell population on FACS histograms. (Supplementary Information, Figure S1) However, nanoparticles with smaller size seemed to favour internalization in the tested conditions since cells treated with Tat-b-PTMC30 micelles
presented faster kinetics of internalization than those treated with the larger Tat-b-PTMC66 micelles as
evidenced by the faster increase of mean fluorescence intensity. (Figure 3, panel B) Nearly no fluorescence was detected by FACS and LCSM for PEG-b-PTMC33 micelles-treated cells, confirming
that the Tat47-57 segment is entirely responsible for the highly efficient cell-penetrating properties of
Tat-b-PTMC self-assemblies.
Fluorescein DAPI Merge
A) B)
Tat-b-PTMC30
Tat-b-PTMC66
PEG-b-PTMC33
Figure 3 (A) Percentage of fluorescein positive cells and (B) mean fluorescence intensity obtained
from flow cytometry analysis of HeLa cells incubated for 15, 30 min, 2 and 4 hrs with fluorescein-labelled Tat-b-PTMC30 (○), Tat-b-PTMC66 (∆), and PEG-b-PTMC33 (□) nanoparticles at 50 µg.mL-1
(optimal dose providing sufficient signal without saturating the totality of the cells). * denotes statistical significant differences between: (A) PEG-b-PTMC33 and Tat-b-PTMCformulations at the
same time points and (B) both Tat-b-PTMCformulations at the same time points, p<0.05. (C) Laser scanning confocal microscopy images of HeLa cells after 30 min-incubation with nanoparticle formulations. Cell nuclei were stained with DAPI (blue). Scale bar = 30 µm.
We secondly questioned whether the internalization mechanism of Tat-b-PTMC micelles was energy-dependent and thus involved in an active endocytotic process. Cells were thus incubated with nanoparticles for 30 min at 4°C instead of 37°C, low temperature conditions strongly inhibiting ATP-dependent processes. As observed by flow cytometry studies, a significant decrease of fluorescein-positive cells was measured when cells were incubated at 4°C in comparison with the 37°C condition. (Figure 4, panel A) Because the fluorescence signal at 4°C was not null, we used LCSM imaging in order to discriminate nanoparticles cellular localization in each condition. Z-stack 3D reconstructions clearly shows that when incubated at 4°C fluorescein-labelled Tat-b-PTMC micelles located at the cell membrane, while locating inside the cytoplasm at 37°C. (Figure 4, panel B and movies provided in Supplementary Information) We assume a 2-step mechanism for the uptake process to occur.24, 25
Regarding their highly cationic surface, nanoparticles are first adsorbed onto the cell membrane by means of electrostatic interactions with negatively charged species (e.g. glycoproteins, phospholipids).26 , 27 In a second step, they are internalized by an energy-dependent endocytotic
mechanism. At 4°C, the first step still occurs as measured by FACS, but the second one is completely inhibited as evidenced by microscopy. These experiments however do not permit to point out the exact mechanism of Tat-b-PTMC micelles internalization (e.g. clathrin-dependent, caveolae-mediated, macropinocytosis, etc…). Additional experiments with specific inhibitors are needed to address this point and will be reported in due time.
Figure 4 Cellular uptake inhibition study at 4°C. (A) Percentage of fluorescein-positive cells obtained
from flow cytometry analyses and (B) 3D LSCM reconstructions of HeLa cells incubated for 30 min at 37°C or 4°C with 50 µg.mL-1 fluorescein-labelled Tat-b-PTMC
30 and Tat-b-PTMC66 nanoparticles.
Cell nuclei were stained with DAPI (blue). * denotes statistical significant differences between indicated groups, p<0.05.
Cell viability evaluation
Presenting a strong positively charged surface as conveyed by highly positive zeta potential values (reported in Table 1), a substantial cellular toxicity can as well be expected from Tat-b-PTMC micelles considering previous studies of poly(L-lysine)-based drug delivery systems or poly(ethylenimine) (PEI) complexes.28 , 29 , 30 In parallel with cellular uptake studies, the long-term
viability of Tat-b-PTMC nanoparticles was thus assessed using the MTT cell metabolic activity assay. HeLa cells were incubated for 72 hrs (a time long enough to reveal eventual toxicity exerted by nanoparticles) with increasing nanoparticle concentrations. Metabolic activity, directly related to cell viability, was measured by spectrophotometry via the reduction of MTT into the colored formazan product by active mitochondrial dehydrogenases. Representative dose-response curves are presented in Figure 5 (panel A). A half maximal inhibitory concentration (IC50) of approximately 40 µg.mL-1
was calculated from 3 independent experiments for both Tat-b-PTMC30 and Tat-b-PTMC66
formulations, while control PEG-b-PTMC33 micelles did not affect cell metabolic activity. When
exposed over a variable time course, respectively 30 min, 4 hrs and 72 hrs, at a constant 50 µg.mL-1
nanoparticle concentration (near the IC50 value), HeLa cells did not show significantly different
metabolic activity (except for Tat-b-PTMC30 micelles between 30 min and 72 hrs time points). (Figure
5, panel B) This suggests that the “toxicity”31 of micelles is directly correlated to their rapid and A) 37°C 37°C 4°C 4°C B) Tat-b-PTMC30 Tat-b-PTMC66
complete cellular uptake mentioned above. Indeed, once exceeding the time for most nanoparticles to be taken up by cells (about 1 hr according to kinetics shown on Figure 3), the time of exposure of HeLa cells to Tat-b-PTMC nanoparticles has very little effect on cell viability.
Figure 5 Viability of HeLa cells incubated (A) for 72 hrs with increasing concentrations of
nanoparticles, and (B) with nanoparticle formulations at 50 µg.mL-1 for different time period. *
denotes statistical significant differences between indicated groups, p<0.05. NS indicates no statistical significant differences between groups at different times for the same formulation.
Modulation of Tat peptide-density in the corona of Tat-b-PTMC30 micelles
In order to understand the impact of the bioactive Tat peptide density on the surface of nanoparticles, and eventually to clarify their internalization mechanism, we prepared core-shell micelles with variable Tat-b-PTMC30 chimera content. This was achieved by formulating mixed nanoparticles from
a blend of Tat-b-PTMC30 chimera and PEG-b-PTMC38 block copolymer, with an increasing ratio of
Tat-b-PTMC30, presently 0, 25, 50, 75 and 100%. As PEG-b-PTMC38 self-assembly via direct
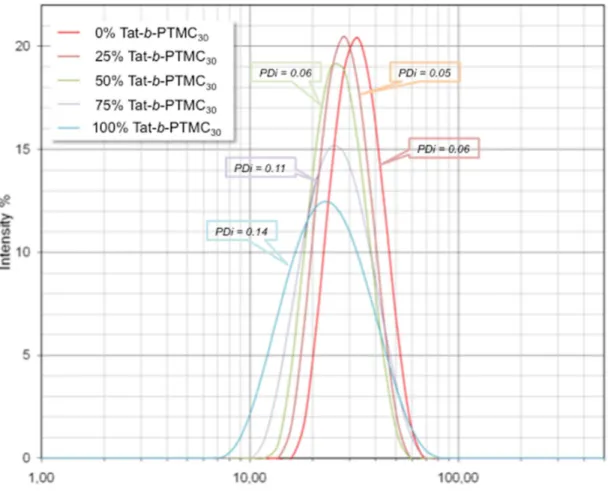
dissolution did not provide nanoparticle dispersions with sufficiently low polydispersity, the different formulations were prepared by a solvent displacement method.18 Spherical micellar nanoparticles were obtained with a hydrodynamic diameter size ranging from 20 to 31 nm depending on the ratio of Tat-b-PTMC30. (Figure 6, panel A) The high homogeneity of the dispersions with polydispersity indexes
between 0.05 and 0.15 indicated the formation of a sole population of nanoparticles with PEG- and Tat-containing blocks certainly randomly distributed within their hydrophilic corona. (Supplementary Information, Figure S2) Zeta potential values almost linearly increased with the amount of cationic Tat
A)
peptide in formulations containing 25% to 100% Tat, while a slightly negative value for plain PEG-b-PTMC38 micelles (0% Tat) was found. (Figure 6, panel A)
Figure 6 (A) Physico-chemical characteristics and (B) in vitro evaluation of mixed nanoparticles obtained with X% Tat-b-PTMC30 / (1-X)% PEG-b-PTMC38 blends. Cellular uptake by HeLa cells at
30 min was quantified by FACS, whereas metabolic activity at 72 hrs was evaluated by MTT assay.
The different nanoparticle formulations were further assayed in vitro in a similar fashion to plain Tat-b-PTMC core-shell micelles (vide supra) with the aim of correlating nanoparticle physico-chemical characteristics with their biological properties. As an enriched Tat-peptide corona implies a direct increase in guanidinium motifs at the surface of nanoparticles, one can expect implications at two different levels: at the molecular scale, the more Tat-peptide, the more interactions with cell-surface biomolecules through ionic association and hydrogen bonding, and at the nanoscale with an increase of nanoparticles global charge. 32, 33, 34
Cell internalization kinetics was studied as previously by incubating HeLa cells for 30 min with the different formulations of fluorescein-labelled Tat-b-PTMC30/PEG-b-PTMC38 mixed micelles at 50
µg.mL-1. As envisioned, the percentage of fluorescein-positive cells increased with Tat-b-PTMC 30
content, although not in a linear fashion. At 30 min, plain Tat-b-PTMC30 micelles were able to
internalize in nearly 100% cells, while the percentage of positive cells decreased from 51, 23 to 4% for 75, 50 and 25% Tat-containing nanoparticles, respectively. The same trend was observed when
A)
measuring mean fluorescence intensities confirming that increasing Tat ratio significantly enhances cellular uptake kinetics. (Supplementary Information, Figure S3) This behaviour is also consistent with the increase of zeta potential and the slight decrease of nanoparticle size observed with increasing Tat content, these two factors improving charge interactions with the cellular membrane and accelerating internalization kinetics, as mentioned before. However, regarding the faint size variation (6 nm difference between 25% and 100% Tat-containing micelles) and the wide difference in positive cells measured (4% and almost 100% positive cells, respectively), internalization kinetics enhancement is likely to be mostly due to Tat-peptide density of nanoparticle shell rather than to size difference.
Cellular toxicity was also addressed and assayed in the same conditions as previously, using a 50 µg.mL-1 nanoparticle concentration, close to the previously determined IC
50 of Tat-b-PTMC30 micelles
(40 µg.mL-1, vide supra), and over 72 hrs to insure maximum internalization of all formulations. The
percentage of Tat peptide was found to have little impact on cell toxicity, since 60% metabolic activity was measured for 50 and 75% Tat formulations and 70% for the 25% one. This supports the previous finding that internalization kinetics is simply delayed with lower Tat content. Additional experiments using different times of exposure will further address this mechanism.
Conclusion
Considering as a first-rate priority the extensive characterization of nanomaterials to pretend to understand and rationalize their ensuing properties, in-depth physico-chemical study of Tat-b-PTMC micelles of different size and Tat surface density was performed, especially by small angle neutron scattering combined with multi-angle dynamic light scattering and AFM microscopy. Interestingly, the morphology of self-assembled nanoparticles obtained from Tat-b-PTMC chimeras is imposed by the electrostatic repulsions in the micellar shell due to the cationic nature of the short Tat segment, and thus limited to core-shell micelles independently of the polymer block length, which only affects the core dimension.
As expected, regarding Tat47-57 peptide cell-penetrating properties, Tat-b-PTMC micelles were found
to be rapidly and efficiently internalized by HeLa cells. Regarding this powerful transduction ability, Tat-b-PTMC nanoparticles would be particularly suitable as drug carriers for local administration in pathological conditions where rapid cell internalization is crucial, such as stereotaxic administration after solid brain tumor surgical removal in order to target remaining tumor cells.
When comparing nanoparticle formulations with variable Tat content, we found cellular uptake kinetics to be strongly dependent on the density of Tat peptide per nanoparticle. Indeed, an exponential increase in labelled cells at short incubation time point was observed with gradually increasing Tat content. Cellular internalization of Tat-b-PTMC nanoparticles was also found to occur
through an energy-dependent endocytotic process since no intracellular labelling was detected under low temperature conditions. We suspect a two-step mechanism to be involved in the cellular uptake process of Tat-b-PTMC core-shell micelles: a first step membrane-binding event promoted by long-distance electrostatic interactions between the basic positively-charged residues of Tat segments and the acidic negatively-charged cell-surface biomolecules, followed by a second entry step through active endocytosis. The forces mediating the energy-dependent transport across the cellular membrane however still need to be elucidated, as well as the exact endocytotic mechanism involved. Extensive biophysical studies and additional in vitro experiments are currently in progress to shed light on this issue.
Acknowledgments
We particularly thank Alain Menelle from Laboratoire Léon Brillouin for providing us access to the PACE spectrometer during the annual training to neutron scattering techniques (Fan du LLB/Orphée). We are very grateful to Martin Teichmann from IECB for the access to his cell culture facility. We also greatly thank Julie Thevenot from LCPO for the synthesis of PEG-b-PTMC block copolymers, and Sabrina Rousseau from UMS 3033 at IECB for her help with FACS experiments. Aquitaine region council, CNRS, MENRT and CPER/FEDER are gratefully acknowledged for financial support. We also thank the program RNP “Precision Polymers Materials” P2M from ESF.
References
1 S. Jain and F. S. Bates, Science, 2003, 300, 460-464. 2 D. E. Discher, Science, 2002, 297, 967-973.
3 J. Rodríguez-Hernández, F. Chécot, Y. Gnanou and S. Lecommandoux, Progress in Polymer
Science, 2005, 30, 691-724.
4 A. Rösler, G. W. M. Vandermeulen and H.-A. Klok, Advanced Drug Delivery Review, 2001, 53,
95-108.
5 a) A. Carlsen and S. Lecommandoux, Current Opinion in Colloid & Interface Science, 2009, 14,
329-339; b) C. Cai, L. Wang and J. Lin, Chemical Communications, 2011, 47, 11189-11203; c) B. Tian, X. Tao, T. Ren, Y. Weng, X. Lin, Y. Zhang and X. Tang, Journal of Materials Chemistry, 2012, 22, 17404-17414; d) J. G. Ray, A. J. Johnson and D. A. Savin, Journal of Polymer Science Part B-Polymer Physics, 2013, 51, 508-523.
6 J. Shi, Z. Xiao, N. Kamaly, O. C. Farokhzad, Accounts Chemical Research, 2011, 44(10),
1123-1134.
7 E. Garanger and S. Lecommandoux, Angewandte Chemie International Edition, 2012, 51,
3060-3062.
8 J.-F. Lutz and H. G. Börner, Progress in Polymer Science, 2008, 33, 1-39. 9 H. G. Börner, Progress in Polymer Science, 2009, 34, 811-851.
10 a) H.-A. Klok, Macromolecules, 2009, 42, 7990-8000; b) M. A. Gauthier and H.-A. Klok, Chemical
Communications, 2008, 0, 2591-2611.
11 G. Fuks, R. Mayap Talom and F. Gauffre, Chemical Society Reviews, 2011.
12 I. C. Reynhout, J. J. L. M. Cornelissen and R. J. M. Nolte, Accounts of Chemical Research, 2009, 42, 681-692.
13 H. Robson Marsden and A. Kros, Macromolecular Bioscience, 2009, 9, 939-951.
14 C. Sanson, C. Schatz, J.-F. Le Meins, A. Brulet, A. Soum and S. Lecommandoux, Langmuir,
2010, 26, 2751-2760.
15 a) A. D. Frankel and C. O. Pabo, Cell, 1988, 55, 1189-1193; b) M. Green and P. M. Loewenstein,
Cell, 1988, 55, 1179-1188; c) E. Vivès, P. Brodin and B. Lebleu, Journal of Biological Chemistry, 1997, 272, 16010-16017; d) M. C. Morris, S. Deshayes, F. Heitz and G. Divita, Biology of the Cell, 2008, 100, 201-217.
16 C. Drappier, A.-L. Wirotius, K. Bathany, E. Ibarboure, O. Condassamy, E. Garanger, S.
Lecommandoux, Polymer Chemistry, 2013, 4(6), 2011-2018.
17 F. Nederberg, B. G. G. Lohmeijer, F. Leibfarth, R. C. Pratt, J. Choi, A. P. Dove, R. M. Waymouth,
and J. L. Hedrick, Biomacromolecules, 2007, 8(1), 153-160.
18 C. Sanson, C. Schatz, J.-F. Le Meins, A. Brulet,§ A Soum, and S Lecommandoux, Langmuir, 2010, 26(4), 2751-2760.
19 A. Brûlet, D. Lairez, A. Lapp, J.-P. Cotton, Journal of Applied Crystallography, 2007, 40, 165-177. 20 J. S. Pederson, Advances in Colloid and Interface Science, 1997, 70, 171-210.
21 D. Kunz, A. Thurn, and W. Burchard, Colloid and Polymer Science, 1983, 261(8), 635-644. 22 S. Debaisieux, F. Rayne, H. Yezid and B. Beaumelle, Traffic, 2012, 13, 355-363.
23 V. P. Torchilin, Advanced Drug Delivery Reviews, 2008, 60, 548-558. 24 E. Vives, Journal of Molecular Recognition, 2003, 16, 265-271.
25 J. M. Gump and S. F. Dowdy, Trends in Molecular Medicine, 2007, 13, 443-448.
26 M. Tyagi, M. Rusnati, M. Presta and M. Giacca, Journal of Biological Chemistry, 2001, 276,
3254-3261.
27 J. M. Gump, R. K. June and S. F. Dowdy, Journal of Biological Chemistry, 2010, 285, 1500-1507. 28 Z. Kadlecova, L. Baldi, D. Hacker, F. M. Wurm and H.-A. Klok, Biomacromolecules, 2012, 13,
29 H. Lv, S. Zhang, B. Wang, S. Cui and J. Yan, Journal of Controlled Release, 2006, 114, 100-109. 30 S. M. Moghimi, P. Symonds, J. C. Murray, A. C. Hunter, G. Debska and A. Szewczyk, Molecular
Therapy, 2005, 11(6), 990-995.
31 We here stress out that the MTT assay provides information on cell metabolic activity, and thus cell
viability, but does not enable to discriminate the cell fate (i.e. cell proliferation inhibition, cell mortality by necrosis or apoptosis) or the mechanism of toxicity.
32 D. J. Mitchell, L. Steinman, D. T. Kim, C. G. Fathman and J. B. Rothbard, The Journal of Peptide
Research, 2000, 56, 318-325.
33 P. A. Wender, D. J. Mitchell, K. Pattabiraman, E. T. Pelkey, L. Steinman and J. B. Rothbard,
Proceedings of the National Academy of Sciences, 2000, 97, 13003-13008.
34 J. B. Rothbard, T. C. Jessop, R. S. Lewis, B. A. Murray and P. A. Wender, Journal of the American
Self-assembled core-shell micelles from peptide-b-polymer molecular
chimeras towards structure-activity relationships
Charlotte Drappier,§,a,b,c Hugo Oliveira,§,a,b Olivier Sandre,a,b Emmanuel Ibarboure,a,b Sophie Combet,d Elisabeth Garanger*,a,b,c and Sébastien Lecommandouxa,b
a
Université de Bordeaux, ENSCBP, 16 avenue Pey Berland, Pessac 33607 Cedex, France.
b
CNRS, LCPO, UMR 5629, Pessac 33607, France.
c
Institut Européen de Chimie et Biologie, 2 rue Robert Escarpit, Pessac 33607, France.
d
Laboratoire Léon Brillouin, CEA-CNRS UMR 12, CEA-Saclay, Gif-sur-Yvette 91191, France.
* Fax: 33 54000 8487; Tel: 33 54000 3035; E-mail: [email protected].
§
Authors contributed equally to the work.
Figure S1 Flow cytometry dot plots and histograms of HeLa cells after 30 min incubation with 50
µg.mL-1 fluorescein-labelled Tat-b-PTMC30, Tat-b-PTMC66 and PEG-b-PTMC33 nanoparticles.
Tat-b-PTMC 30 Tat-b-PTMC 66 PEG-b-PTMC 33 Control cells
Figure S2 Light scattering intensity distributions and polydispersity indexes of mixed
Figure S3 Mean fluorescence intensity measured by flow cytometry of HeLa cells exposed for 30 min