HAL Id: halshs-00586284
https://halshs.archives-ouvertes.fr/halshs-00586284
Preprint submitted on 15 Apr 2011HAL is a multi-disciplinary open access archive for the deposit and dissemination of sci-entific research documents, whether they are pub-lished or not. The documents may come from teaching and research institutions in France or abroad, or from public or private research centers.
L’archive ouverte pluridisciplinaire HAL, est destinée au dépôt et à la diffusion de documents scientifiques de niveau recherche, publiés ou non, émanant des établissements d’enseignement et de recherche français ou étrangers, des laboratoires publics ou privés.
How populist democracy promotes market liberalization
Pauline Grosjean, Claudia Senik
To cite this version:
Pauline Grosjean, Claudia Senik. How populist democracy promotes market liberalization. 2008. �halshs-00586284�
WORKING PAPER N° 2008 - 39
How populist democracy promotes market liberalization
Pauline Grosjean
Claudia Senik
JEL Codes: D63, H1, H53, I38, O1, P26
Keywords: Democracy, income inequality, redistribution,
market liberalization, trust
P
ARIS-
JOURDANS
CIENCESE
CONOMIQUESL
ABORATOIRE D’E
CONOMIEA
PPLIQUÉE-
INRA48,BD JOURDAN –E.N.S.–75014PARIS TÉL. :33(0)143136300 – FAX :33(0)143136310
www.pse.ens.fr
CENTRE NATIONAL DE LA RECHERCHE SCIENTIFIQUE –ÉCOLE DES HAUTES ÉTUDES EN SCIENCES SOCIALES
1
How Populist Democracy Promotes Market Liberalization
Pauline Grosjean (University of California at Berkeley) and Claudia Senik (Paris School of Economics)
July 22, 2008
Abstract
Using a new set of micro evidence from an original survey of 28 transition countries, we show that democracy increases citizens’ support for the market by guaranteeing income redistribution to inequality-averse agents. Our identification strategy relies on the restriction of the sample to inhabitants of open borders between formerly integrated countries, where people face the same level of market development and economic inequality, as well as the same historically inherited politico-economic culture. Democratic rights increase popular support for the market. This is true, in particular, of inequality-averse agents, provided that they trust political institutions. Our findings suggest that one solution to the recent electoral backlash of reformist parties in the former socialist block lies in a deepening of democracy.
JEL codes: D63, H1, H53, I38, O1, P26.
Keywords: Democracy, income inequality, redistribution, market liberalization, trust.
We thank participants in the UC Berkeley development lunch, the UC Berkeley Positive Political seminar, the Midwest Political Science Association Annual National Conference. We are grateful to Bryan Graham, Ethan Ligon, Daniel O’Neill, Robert Powell, Gerard Roland and Hiroki Takeuchi for helpful comments and suggestions. All errors are ours. This research has benefited from the support of the Institut Universitaire de France, the CEPREMAP and the Ciriacy-Wantrup Foundation.
2
1. Introduction
Is democracy an obstacle to development, market liberalization and growth, or does it eventually appear as a necessary condition to these evolutions? An important body of economic literature, largely inspired by the example of China and other South-East Asian countries, claims that postponing political liberalization gives more leeway to reformers when reform measures potentially hurt important groups of the population (Aslund, Boone and Johnson, 2001; Dewatripont and Roland, 1992; Roland, 2001; Roland and Verdier 2003). The belief that concentrating power in the hands of one party, forbidding the expression of political opposition, is a more efficient way to conduct a development strategy is sometimes referred as the Lee’s hypotheses, from the name of Singapore’s leader Lee Kuan Yew (Sen 1999). This idea is also present in the “public choice” theory of the relationship between democracy and capitalism. According to Dan Usher (1981), a disciple of Hayek, universal suffrage and majority rule endanger the capitalist system, for the majority may vote to expropriate the rich minority.
By contrast, the idea that democracy can be a fertile ground for market liberalization is more rarely found. An important channel through which democracy is supposed to help market development is via its expected effects on income redistribution. More precisely, the contestability of the ruling party, put in competition with other organized political groups, appears as the necessary condition for a party to credibly commit to the provision of social insurance and income redistribution1. This is because political
1
3 competition creates the possibility that the ruling party loses his constituency in case he does not live up to his promises. Acemoglu and Robinson (2000, 2002), Acemoglu, Bautista, Querubin and Robinson (2007a) and Robinson (2006) have developed the idea that when economic development unlashes income inequality, which itself triggers backlash against reforms, extending democratic rights appears as a credible promise of future income redistribution. Absent such institutional safeguards, rising inequality, in itself, would generate opposition to further market reform and may even impose a threat to the regime (Alesina and Perotti 1996).
In the case of Latin America, for example, where economic liberalization has not been accompanied by adequate social safety nets, the ensuing economic insecurity has been identified as one major cause of the recent reform backlash (Rodrik 2000). This view also seems relevant to the experience of transition countries. The rise in economic inequality that has been triggered by the transition from a planned to a market economy is well-documented. Fleming and Micklewright (2000), Milanovic (1998, 1999) and Keane and Prasad (2000), among other papers, have described how market forces have driven wage differentiation and the rising share of income from self-employment and property. Rising inequality in turn, has been shown to generate popular opposition to market reforms (Denisova, Eller, Frye and Zhuravskaya, 2008; Desai and Olofsgard, 2006; Grosfeld and Senik, 2008; Krastev, 2007). The denunciation of widespread corruption, of confiscation of power by the elite, and of lack of transparency in the distribution of the aggregate gains from transition, has undermined popular adhesion to the process of reforms and brought back to power former communist candidates or radically conservative anti-European parties (Krastev 2007; Rupnik 2007). It thus seems that in transition countries, restoring popular support to the strategy of development based on market liberalization now implies increasing political transparency and the commitment of the government to keep income differentiation under control.
4 However, this supposes that democracy performs efficiently its instrumental role in keeping governments responsible and accountable to the majority (Sen 1999), and is not subverted by the wealthy and politically powerful (Glaeser, Scheinkman and Shleifer 2003). In a recent paper, Acemoglu, Ticchi and Vindingli (2007b) present a model of democratic capture, where the rich, in young democracies, may promote an inefficient state structure in order to limit income redistribution. Hence, not only does the formal transition to democracy matter, but also the degree of capture of democratic institutions by the elite and the bureaucracy, and more generally the degree of effectiveness and reliability of the procedures associated with formal rights. This qualitative element can be captured by the trust that the majority of people place in democratic institutions. Political trust has indeed been described as the link between citizens and the institutions that represent them (Bianco, 1994). In sum, the subjective perception of the quality of democracy depends on popular trust in the country’s institutions as much as on formal rights. This is particularly true in new democracies, such as those of the former socialist bloc (Mishler and Rose 1997).
Accordingly, the present paper investigates the impact of democratic rights on citizens’ support for the market, assuming that the relation is mediated by the degree of political trust that citizens place in political institutions. It hinges on a new set of micro evidence from an original survey of 28 transition economies, the Life in Transition Survey, which was implemented in 2006 (see EBRD, 2007a). In a companion paper, Grosjean and Senik (2007) proposed a new identification strategy based on frontier-zones, and found that democracy reinforces individuals’ belief in the market as a superior form of economic system. This paper starts from this finding and proposes a mechanism explaining this relationship.
5 Recent empirical work points to a reinforcing effect of political liberalization on economic liberalization at the macroeconomic level (Giavazzi and Tabellini 2005). Studies related to Central and Eastern Europe, with the exception of Finifter and Mickiewicz (1992), find that democracy facilitates economic liberalization (Fidrmuc, 2003; Hayo, 2004). However, demonstrating empirical relations of causality between democracy and market liberalization is a daunting task (Persson and Tabellini, 2007). This is because of the identification problem, which is contained in the very idea of the modernization theory (Lipset 1959) that the same development dynamics favor both democracy and market development. Subjective support to the market may be due both to the degree of democracy and to the degree of market development itself, which are difficult to disentangle as they are likely to develop at a parallel pace. Moreover, these subjective political attitudes altogether are likely to be influenced by common cultural and historical factors which are difficult to capture. Hence, assessing the direction of causality between the advancement of economic freedom and the degree of political freedom appears to be an almost impossible exercise in the absence of a valid exogenous instrument. Example of such instruments are legal origins (La Porta, Lopez-de-Silanes, Shleifer and Vishny, 1999) or colonial origins (Acemoglu, Johnson and Robinson, 2001).
In order to overcome these difficulties, we propose an identification strategy based on the specificities of frontier-zones. Our main assumption is that people who live in an integrated frontier-zone (in terms of labor and product mobility) share the same experience of the market and, often, the same historically inherited “cultural attitudes” towards the market and democracy, on both sides of the frontier. The assumption that frontier-zones are culturally and economically highly integrated is particularly plausible for the often artificial frontiers of the former USSR and for some formerly integrated regions such as the Ottoman Empire or the Austro-Hungarian Empire. This allows us to identify the pure influence of different levels of democracy across nations, avoiding the simultaneity and omitted variable bias.
6 Our main focus is on the effect of a three way interaction between democracy, political trust and the demand for income redistribution by the state. We find a positive and significant impact of this triple interaction on the support for market liberalization. The main result of this paper is that inequality-averse individuals are more supportive of the market when they live in more democratic states and trust democratic institutions (even though the direct effect of inequality aversion is to reduce support to the market).
This mechanism provides a possible explanation of the link between democracy and support for the market that was identified by Grosjean and Senik (2007) in a companion paper, or by Giavazzi and Tabellini (2005). Our interpretation is also consistent with the optimal sequencing of reforms as described by Dewatripont and Roland (1995). The authors show that implementing a first reform that benefits a majority with small gains increases the ex ante acceptability of a second reform that benefits a minority with large gains. Reinterpreting the first reform as democracy and the second as market reform, our results confirm this prediction. Our interpretation is also consistent with theoretical considerations of a complementarity between democracy and the market (Lindblom 1995).
This paper suggests that democratic governance can play an instrumental role in overcoming redistributive conflicts that could block the construction of a viable market economy. The same is true of income redistribution. The first order negative effect of redistributive policies on growth (Persson and Tabellini 1994; Alesina and Rodrik 1994) must be weighted by the further acceptance of market reforms.
2. Data
Our study hinges on the Life in Transition Survey (LITS), a survey conducted by the European Bank for Reconstruction and Development and the World Bank in 2006, in 28 post-transition countries and
7 Turkey2. Respondents to the survey were drawn randomly, using a two stage sampling method, with census enumeration areas as Primary Sampling Units (PSUs), and households as secondary sampling units. The survey includes 1000 observations per country, making a total of 29000 observations. Descriptive statistics are presented in Appendix.
Frontier zones
The Life in Transition survey is based on PSUs3, each containing 20 observations (surveyed persons). We used the geographical map of the survey to identify groups of PSUs that are located on both sides and in the immediate vicinity of a political frontier. We identified 36 valid frontier-zones that contain between 40 and 460 observations, concentrated in 2 (Slovak Republic-Ukraine) to 24 (Croatia-Slovenia) PSUs.
Because the validity of our identification strategy relies on the intensity of market integration on either side of borders, we excluded frontiers that are impaired by geographical obstacles or restricted because of political tensions and disputed territories. We thus excluded the frontiers between Georgia and Russia, Armenia and Azerbaijan, Moldova and Ukraine, as well as all Uzbek borders. We verified that the degree of market development is more similar between two adjacent frontier-zones than it is on average between two adjacent countries. We constructed an index of market development that reflects the share in regional
2
Turkmenistan was not included in the survey, neither was Kosovo. We exclude Turkey from our sample because its borders with the other countries were closed during the whole socialist period, which is in contradiction with our identification assumption.
3
8 employment of small and medium sized, private and newly created enterprises (since 1989). On average, the correlation between indices of industrial market development is twice as high between adjacent frontier-zones as it is between adjacent countries. If one restricts the analysis to subsets of formerly more integrated countries, the proximity between adjacent frontier-zones appears even higher. For instance, in Central Asia, the correlation between two adjacent frontier-zones is 0.78 against 0.34 in two adjacent countries. We also checked that the structure of industrial employment in terms of occupation and industry is identical on either side of the borders, whereas this is not true of entire adjacent countries (for more details see Grosjean and Senik 2007).
Support for the market and demand for income redistribution
Support for the market is proxied by the probability of choosing the first item of the following survey question:
Which of the following statements do you agree with most?
- A market economy is preferable to any other form of economic system
- Under some circumstances, a planned economy may be preferable to a market economy
- For people like me, it does not matter whether the economic system is organized as a market economy or as a planned economy
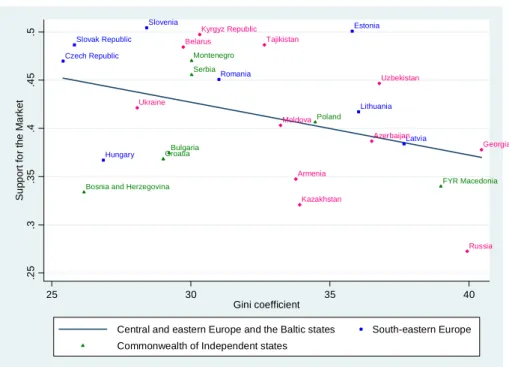
9 Support for the market is rather low in the region. Averaging across countries4 of the sample, support for the market as defined above reaches 43% (see Denisova, Eller, Frye and Zhuravskaya 2008, for possible explanations). Descriptive statistics based on our data confirm the negative association between income inequality and support for the market at the country level (see figure 1).
We measure the demand for redistribution using the following question:
Do you think the state should be involved in reducing the gap between the rich and the poor?
Scale: not involved at all/let the market play =1; Somewhat/moderately involved =2; strongly involved=3
There is overwhelming support in favor of state intervention across the region. On average, 5% of respondents favor no intervention, 26% support a moderate intervention and 69% desire a strong intervention of the state to reduce income gaps. Support for the market is particularly low among those who favor more state intervention, as can be seen in Figure 2. People are also particularly favorable to strong state intervention in countries where inequalities are large, as can be seen in Figure 3. For example in the FYR Macedonia, one of the most unequal countries of the region, with a Gini coefficient of 39 in 2003 (World Development Indicators), the market is thought to be “preferable to any other form of
economic system” by only 34% of respondents, and 85% of respondents are in favor of the state being
“strongly” involved in the reduction of inequalities. By contrast, in adjacent Serbia, where inequality is lower (the Gini coefficient in 2003 was 30), 45% of respondents support the market and “only” 80% are favorable to a strong state intervention to reduce income gaps.
4
10
Indices of Democracy and Trust
In order to build a score of democracy, we mainly rely on the Freedom House Nations in Transit democracy index (Freedom House, 2006a), which is constructed as an average of measures of the electoral process, civil society, independent media, independence of the judicial system, and corruption. It takes values from 1 to 7, with 1 representing the highest level of democratic progress and 7 the lowest. (We have recoded it in order to present the score of democracy in an ascending order). This index of democracy is the best suited for our purpose for several reasons. Firstly, it is the most comprehensive and detailed indicator for the transition region. In particular, it is the only index that provides a separate score for Serbia and Montenegro; it allows discriminating among countries of our sample better than other indicators, such as Polity IV (CIDCM 2006). Secondly, it is more focused on democratic rights than many other indices. For example, the Freedom in the World (Freedom House 2006b) indicator takes into account such things as freedom of associational rights, and personal autonomy, which do not directly assess the ability of the regime to satisfy the demand for redistribution of agents; while the Bertelsmann
Transformation Index (BTI) takes into account the development of the market economy, hence does not
fit our identification strategy.
Nevertheless, an important drawback of all these indicators is that they rely principally on expert ratings. They may not reflect adequately the average opinion of citizens about the quality of democratic institutions, in particular in young political regimes of the CIS. The quality of formal rights may not matter without the actual feeling of empowerment and control by the majority over political institutions.
11 We hence exploit, in addition to standard democracy scores, a measure of individuals’ trust in institutions that are characteristics of a functioning democracy, using responses to the following question5:
To what extent do you trust the following institutions?
Scale: Complete distrust=1, Some distrust=2, Neither trust nor distrust=3, Some trust=4, Complete trust=5, Difficult to say=6
- The government/cabinet of ministers
- The parliament
- Courts
- Political parties6
5
The question explores trust in a larger number of institutions, such as religious institutions, armed forces, the police, foreign investors, etc. However, we only select those institutions that reflect a functioning democracy.
6
The question explores trust in a larger number of institutions. The survey question also included other political institutions, such as religious institutions, foreign investors, the presidency, the army or the police. We only selected those institutions that reflect a functioning democracy, excluding the army and the police, which are not directly related to a democratic regime, and not at all related to the ability of such regimes to conduct redistributive policies. We also excluded the presidency because of the possible ambiguity between the presidential institution and the man who takes up the position. Actually, because
12 We construct an index that takes value 1 if the respondent either has “some trust’ or ‘complete trust in any of the above item. Our trust score is then the sum of these individual indices. It takes an average value of 1.21.
This measure of trust in institutions tends to be higher in countries of the CIS and, particularly in Central Asia, although these countries fare rather badly in terms of political rights. It reaches a maximal value of 2.93 in Tajikistan; and a minimum value of 0.59 in Croatia. However, national differences are not central to our identification strategy, which relies on the attitudes of individuals located in frontier-zones, inside historically integrated cultural zones. Focusing on pairs of adjacent countries, the index of trust seems to reflect more accurately the quality of institutions: it is higher in Slovenia (1.18), the Slovak Republic (1.12) and Hungary (1.09) compared with their neighbors; Among Central Asian countries, Tajikistan has made noticeable progress in terms of political accountability, as compared with its neighbors (EBRD 2007b)7.
Interacting the index of institutional trust and the Freedom House Nations in Transit (Freedom House 2006a) index of democracy, we intend to capture not only the formal quality of institutions, but also people’s perception of their empowerment, which is what ultimately determines their belief in the government’s ability to ensure redistributive justice.
of this confusion, the question was censored in Belarus. In addition, this would have raised comparability problems.
7
Although Tajikistan ranks below Kyrgyzstan in the Freedom House indicator, the country has known none of the political agitation that took place in Kyrgyzstan or Uzbekistan in the last few years.
13
3. Empirical Strategy
The purpose of this paper is to investigate the link between democracy and the subjective support for market development. We test the conjecture that there is a complementarity between popular support for market development and the ability of a democratic system to correct the negative outcomes of the market, ability that must be sanctioned by popular trust. There are three elements to this conjecture. Firstly, it supposes that income inequality arises as a negative outcome of market development (Milanovic 1999), and, in turn, undermines popular support for further market liberalization (Grosfeld and Senik 2008). Secondly, it relies on the hypothesis that a democratic government provides a better commitment to redistribution than an autocratic government (cf. Acemoglu and Robinson 2002). Thirdly, it implies that not only formal rights matter but also the trust in the ability of democratic institutions to channel the demands of the majority. We are thus specifically interested in the effect of a three way interaction between democracy, political trust and attitudes towards the role of the state in reducing inequalities. Finding a positive and significant impact of this interaction on the support for market liberalization would show that when people trust that the government can correct the inequality generated by market development, their subjective support for the market is enhanced.
We would thus like to estimate the following relation:
Support for market ij = a0 + a1 Democracy j + a2 Trustij + a3 Preferences for Redistributionij + a4
Democracyj*Trustij* Preferences for Redistributionij + a5 Xij + a6Cj + ui (1)
where pair-wise interactions between the three variables of interests are controlled for; Democracyj
corresponds to the level of democracy in country j, Trustij corresponds to the level of political trust of
14 of respondent i in country j, Xijk stands for the socio-demographic characteristics of respondent i in
country j, Cj is a vector of country dummies and ui the error term.
We are particularly interested in the sign and significance of the coefficient of the above three way interaction. Our hypothesis is that: a4 >0.
However, as detailed in the next paragraph, estimating equation (1) would run into serious identification problems.
Empirical challenges: endogeneity and omitted variable biases
The identification of the relation sketched in equation (1) faces two major empirical challenges. Firstly, omitted cultural factors are likely to be essential determinants not only of attitudes towards the market, but also of attitudes towards inequality, as well as of political trust8. Second, all the variables under consideration (political trust, subjective support for the market, as well as the current level of economic inequality and consequently people’s attitudes to inequality) are certainly endogenous to the level of market development itself.
In order to overcome this endogeneity bias, we need to find individuals, who, in an exogenous way, face the same level of market development, and thus the same level of economic inequalities, but live under
8
Two main theories explain the origin of political trust (Mishler and Rose 1997). Cultural theories consider that trust is mainly exogenous, in that it is deeply rooted in beliefs and cultural norms and is generated though early-life socialization (Putnam 1993). By contrast, institutional theories consider that political trust is endogenous to the performance of institutions.
15 different democratic institutions, in terms of both formal and effective rights. In order to overcome the cultural bias, we need to restrict our sample to people who also share a common cultural heritage. In other words, the relation that we must consider is not equation 1 but the following system of equations:
Support for the Market ij = a0 + a1 Democracy j + a2 Trustij + a3 Preference for Redistributionij + a4
Democracyj* Trustij* Preference for Redistributionij + a6 Degree of Market Development j + a7 Cultural
Factors j +a8 Xij + a9Cj + ui (2.1)
Trustij= b0 +b1 Degree of Market Development j + b2 Cultural Factors j +b3 Xij + b4Cj + vi (2.2)
Preference for Redistributionij = c0 +c1 Degree of Market Development j + c2 Cultural Factors j +c3 Xij +
c4Cj + wi (2.3)
where Xij stands for the socio-demographic characteristics of respondent i in country j, Cj is a vector of
country dummies, ui, vi and wi are the error term and pair-wise interactions between the three variables of
interest are controlled for in equation (2.1).
Identification strategy
The idea is to match observations in frontier-zones. We assume that spatial economic integration across open political borders and labor mobility imply that inhabitants of border zones share the same experience of the market even when they live in different countries with different political institutions. We refer the reader to Grosjean and Senik (2007) for a discussion of this assumption and empirical evidence. In a nutshell, the arguments are the following: (i) the high level of inter-regional trade in frontier zones, (ii) frequent migration flows across borders, (iii) the specific historical integration of the countries of the
16 former USSR. Clearly, the validity of the assumption relies on the level of market integration across the borders of the surveyed countries. As stressed in Section 2, we only retain open borders.
The assumption of market integration at frontier-zones eliminates the risk that the support for market liberalization that is measured reflects the actual market development and is contaminated by the level of economic inequality. What about “cultural” omitted variables? We hinge on the idea that citizens of countries that have belonged to formerly highly integrated zones (the USSR, the Ottoman empire, the Austro-Hungarian empire, etc.) share a common culture, i.e. common inherited general attitudes towards the market and democracy (cf. Alesina and Fuchs-Schundeln 2007). Beyond this remark, we rely on the fact that current frontiers of many transition countries, especially countries of the Commonwealth of Independent States (CIS), are more or less artificial divisions of formerly integrated jurisdictions, whose citizens have developed common attitudes concerning both market development and political freedom. Again, we refer to Grosjean and Senik (2007) for an extensive discussion of these assumptions.
As explained in section 2, using the LITS survey, we identify frontier-zones as groups of Primary Sample Units (PSUs) that are quasi-adjacent and located on both sides of a frontier (less than 30 km from each other). In order to measure the degree of democratization of a country, we use the democracy score established by the Freedom House Nations in Transit survey (Freedom House, 2006a).
Our test therefore consists, for observations at frontier-zones between two countries, of regressing individual support for the market on an interaction between the index of democratization, political trust and demand for redistribution by the state, controlling for frontier-zone dummies and other socio-demographic characteristics of respondents.
17 Assuming that the level of market development and cultural factors are constant inside a given frontier-zone, these two terms drop out of each equation of system (2), which can be rewritten as:
Support for Market ijk = a0 + a1 Democracy j + a2 Trust ijk + a3 Preferences for Redistributionijk + a4
Democracyj* Trustijk* Preferences for Redistribution ijk + a5 X ijk + + a6 Zk + ui (3)
where pair-wise interactions between the three variables of interest are controlled for; Democracyj
corresponds to the democracy score of country j, Trustijk is the level of political trust of individual i in
frontier-zone k of country j, Attitudes to Inequalitiesijk measures individual preferences for redistribution
of respondent i in frontier-zone k of country j, Xijk stands for the socio-demographic characteristics of
respondent i, Zk is a vector of frontier-zone dummies and ui is the error term.
Estimating equation (3) is thus a direct test of our main hypothesis (a4 >0), on the sub sample of
frontier-zones.
We check that pair-wise relations between demand for redistribution, democracy, trust and support for the market are signed in the way we hypothesized. As a robustness test, we also verify that we do not obtain the same result with another left-hand-side variable instead of support for the market. As possible candidates, we consider the subjective support to alternative economic policies, such as state ownership of large enterprises, price regulation or guarantee of employment by the state.
4. Results
We estimate equation (3) with a linear probability model. Despite some drawbacks of linear probability models to estimate limited dependent variables, namely because they may give negative or higher than unity predicted values, they make the estimation and analysis of interaction terms much more tractable
18 than non linear models (Ai and Norton 2003) 9. We checked that it makes little difference to estimate equation (3) using a linear probability model or a logistic regression model10. This is in line with the results of Ferrer-i-Carbonell and Frijters (2004) or Pohlman and Leitner (2003).
Table 1 presents the regression of support for the market on scores of democratization, political trust and individual support for income redistribution for the sub-sample of respondents living in open frontier-zones, controlling for frontier-zone dummies, and clustering at the frontier zone level (equation (3)).
Column (1) displays Grosjean and Senik (2007)’s earlier result that the direct effect of democratic rights is to enhance support for the market, so that political liberalization may “cause” economic liberalization (as in Giavazzi and Tabellini 2005). The quantitative effect is quite large: an increase in one standard deviation of the Freedom House indicator increases the probability of supporting the market over any
9
In non linear models, in contrast to linear models, the interaction effect is different from the marginal effect of the interaction term. Moreover, it is conditional on the independent variables, unlike in linear models (Ai and Norton 2003).
10
Both models perform similarly in terms of overall goodness of fit and significance of individual independent variables. Predicted values of the dependent variable by the two models are highly correlated (correlation coefficient of 0.9964). One of the main drawbacks of the linear probability model is that it may predict values below 0 or higher than 1. However, this is not an important issue in the linear estimation of equation (3), where only four negative values and three values higher than 1 are predicted. Figure 4 in the Appendix plots the predicted values for the logistic regression and OLS. Predicted means of the dependent variable are reported in Table 1.
19 other form of economic system by 7.6 percentage points (1.58*0.048). Columns (2), (3) and (6) show that more democratic institutions and higher trust increase individuals’ support to the market. However, the effect of political trust alone is hardly significant and quantitatively marginal: an increase in one standard deviation of our trust index increases the probability of supporting the market by just over 1 percentage point (column 2).
Column (3) shows that respondents who support income redistribution by the state are precisely those who oppose the market: a one standard deviation increase in the demand for redistribution decreases the probability of supporting the market by 4 percentage points. Columns (4) and (5) show that trust and democracy alone are not enough to turn inequality-averse individuals in favor of the market. However, as shown in column (7), among those agents who strongly favor income redistribution by the state and who would thus otherwise oppose the market, those who live in a more democratic state and who trust their political institutions, favor the market more. Here again, the effect is quite large: an increase in one standard deviation of the interaction between the Freedom House indicator, political trust and the demand for redistribution increases the probability of supporting a market economy by 7.6 percentage points (0.005*15.15).
Table 1 also displays the effect of other covariates on support for the market. We distinguish three income categories (the richest, middle and poorest quintiles inside each country), six educational levels, nine occupational categories and employment status (self-employed versus employees). We also control for age, age squared and residence in an urban, metropolitan or rural area. The only significant effects are those of income, education, employment status and gender. Self-employed workers, male respondents and those who hold a university degree tend to be more supportive of the market. Other levels of education
20 have no significant impact. The poorest third of respondents clearly oppose the market and the effect is unaffected by whether preferences for redistribution are controlled for or not.
21 Table 1: Democracy and Trust increases the Support for the Market of Inequality Averse Agents
Dependent variable Support for the Market
(1) (2) (3) (4) (5) (6) (7) Democracy 0.048*** 0.073** 0.049*** 0.084** [0.012] [0.029] [0.014] [0.032] Trust 0.010* 0.017* 0.006 0.013 [0.006] [0.008] [0.015] [0.016] -0.069*** -0.041 -0.064*** -0.043
State intervention against
inequalities [0.018] [0.048] [0.018] [0.046] -0.009 -0.012 Democracy*State intervention against inequalities [0.011] [0.011] -0.017** -0.022*** Trust*State intervervention against inequalities [0.009] [0.008] Democracy*Trust 0.001 -0.012* [0.004] [0.006] 0.005** Democracy*Trust*State intervention against inequalities [0.002] Poor -0.077*** -0.075*** -0.074*** -0.076*** -0.073*** -0.076*** -0.074*** [0.019] [0.019] [0.019] [0.019] [0.019] [0.019] [0.019] Rich 0.011 0.006 0.003 0.009 0.004 0.012 0.008 [0.019] [0.019] [0.019] [0.019] [0.019] [0.020] [0.020] Age -0.001 -0.001 0 -0.001 0 -0.001 -0.001 [0.003] [0.003] [0.003] [0.003] [0.002] [0.003] [0.002] Male 0.045*** 0.050*** 0.048*** 0.042*** 0.048*** 0.045*** 0.043*** [0.011] [0.012] [0.011] [0.009] [0.011] [0.010] [0.009] Compulsory education -0.04 -0.032 -0.036 -0.042* -0.034 -0.039 -0.039 [0.024] [0.024] [0.024] [0.024] [0.024] [0.025] [0.025] Secondary education 0.007 0.022 0.014 0.002 0.018 0.01 0.006 [0.030] [0.032] [0.031] [0.029] [0.031] [0.030] [0.029] Professional education 0.019 0.023 0.018 0.017 0.021 0.022 0.022 [0.028] [0.027] [0.027] [0.027] [0.026] [0.027] [0.026] University degree 0.070** 0.078** 0.069** 0.063** 0.071** 0.072** 0.066** [0.030] [0.029] [0.030] [0.029] [0.029] [0.029] [0.028] Post graduate degree -0.036 -0.022 -0.023 -0.032 -0.019 -0.032 -0.026
[0.072] [0.073] [0.074] [0.072] [0.074] [0.071] [0.071]
Unemployed -0.008 -0.002 -0.003 -0.007 0.001 -0.006 -0.005
[0.025] [0.024] [0.025] [0.026] [0.024] [0.025] [0.025] Self-employed 0.079*** 0.088*** 0.084*** 0.071*** 0.081*** 0.076*** 0.070***
[0.026] [0.027] [0.027] [0.025] [0.027] [0.026] [0.025] White collar employee 0.044 0.045 0.037 0.038 0.04 0.046 0.04
[0.032] [0.031] [0.031] [0.032] [0.030] [0.032] [0.031] Blue collar employee -0.005 -0.008 -0.01 -0.006 -0.007 -0.003 -0.005
22
[0.028] [0.028] [0.028] [0.028] [0.028] [0.028] [0.029] Service sector employee 0.035 0.045 0.044 0.037 0.048 0.038 0.039
[0.029] [0.029] [0.029] [0.029] [0.028] [0.029] [0.028] Farmer or farm worker 0.113* 0.118* 0.118** 0.116* 0.123** 0.116* 0.119*
[0.065] [0.061] [0.058] [0.062] [0.058] [0.065] [0.061] Pensioner 0.011 0.016 0.017 0.012 0.018 0.011 0.013 [0.028] [0.027] [0.028] [0.028] [0.027] [0.027] [0.027] Student 0.009 0.004 0.001 0.002 0 0.009 0 [0.052] [0.051] [0.050] [0.050] [0.050] [0.052] [0.051] Housewife 0.033 0.041 0.038 0.031 0.038 0.034 0.03 [0.049] [0.049] [0.049] [0.049] [0.049] [0.049] [0.048] Observations 5726 5916 5916 5722 5912 5722 5718 R2 0.096 0.097 0.102 0.103 0.103 0.097 0.105 Log likelihood -3790.5 -3932.98 -3916.43 -3766.54 -3908.78 -3784.88 -3755.07 Predicted mean of dep. variable 0.419 0.429 0.428 0.419 0.429 0.418 0.418
Notes to Table 1: Democracy is built on the basis of Freedom House (2006a). Controls: frontier zone
dummies, age squared, urban, rural or metropolitan areas. Omitted categories: young (17 to 34 years old), middle income group, lowest education, employee, occupation in army. Robust standard errors adjusted for clustering on frontier zones. *** Significant at 1%, ** significant at 5%, * significant at 10%.
The implications of our results are that, as suggested by Acemoglu and Robinson (2000, 2002), democracy and trust in the institutions turn people in favor of market reform, by acting in the same way as a credible commitment to compensating the negative outcomes of income differentiation. Nevertheless, the transfer of formal political power from the elite to the majority during the process of democratization is not sufficient. A crucial role is played by political trust, which reflects the feeling of confidence in the ability of democratic institutions to perform their instrumental role in keeping governments responsible and accountable to the majority.
Robustness
In order to go further in the attempt to overcome the omitted variable problem, we run the estimation of equation (3) within formerly integrated cultural zones, as discussed in Section 3. This is meant to exclude
23 the influence of politico-economic attitudes inherited from the past, which would create an upward bias on the estimation of the relation between democracy, trust and support for the market.
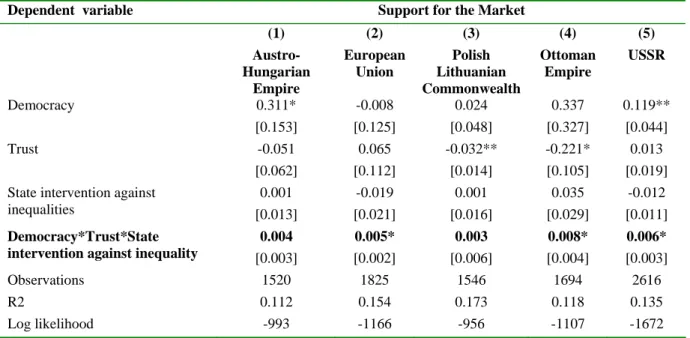
Table 2 replicates, within each cultural zone, the same regression as shown in column (7) of Table 1, with a three way interaction between democracy, political trust and preferences for redistribution (controlling for main effects and two way interactions). The (triple) interaction is positive and significant in the new members of the European Union, the former USSR and the former Ottoman Empire.
Table 2: Support for the Market within Cultural Zones
Dependent variable Support for the Market
(1) (2) (3) (4) (5) Austro-Hungarian Empire European Union Polish Lithuanian Commonwealth Ottoman Empire USSR Democracy 0.311* -0.008 0.024 0.337 0.119** [0.153] [0.125] [0.048] [0.327] [0.044] Trust -0.051 0.065 -0.032** -0.221* 0.013 [0.062] [0.112] [0.014] [0.105] [0.019] 0.001 -0.019 0.001 0.035 -0.012
State intervention against
inequalities [0.013] [0.021] [0.016] [0.029] [0.011]
0.004 0.005* 0.003 0.008* 0.006*
Democracy*Trust*State
intervention against inequality [0.003] [0.002] [0.006] [0.004] [0.003]
Observations 1520 1825 1546 1694 2616
R2 0.112 0.154 0.173 0.118 0.135
Log likelihood -993 -1166 -956 -1107 -1672
Notes to Table 2: Controls: frontier zone dummies; income categories (rich, middle class, poor); age; age
squared; gender; occupation categories; self-employed; education categories; urban, rural or metropolitan areas. Robust standard errors adjusted for clustering on frontier zones. *** Significant at 1%, ** significant at 5%, * significant at 10%. Democracy is built on the basis of Freedom House (2006a). Pair-wise interactions between democracy, trust and demand for redistribution are controlled for.
24 The central element of our interpretation of the link between democracy and support for the market is the role of inequality and the demand for income redistribution. We thus try to check whether the effect of democratic institutions that we observe actually relies on the redistributive ability of the state and not in state intervention in general. The LITS survey contains other questions on state intervention that allow distinguishing the demand for income redistribution by the state from other dimensions of state intervention in the economy. We use the following set of questions:
Do you think the state should be involved in the following?
- Guaranteeing employment
- Guaranteeing low prices for basic goods and food
- Ownership of large companies in this country
- Ownership of gas and electricity companies
Scale: not involved at all/let the market play =1; somewhat/moderately involved =2; strongly involved=3
We run four independent regressions of a modified equation (3) where each item of the above question is successively substituted to the demand for redistribution. Results are displayed in Table 3. Each column presents the regression results for each of the above elements of economic policy. The three way interactions between democracy, political trust and the chosen element of state intervention in the economy are never significant. We conclude that the effect that we observe in section 4 lies specifically in the redistributive ability of democratic institutions and not in other elements of state intervention.
25 Table 3: Robustness: other element of state intervention rather than redistributive justice
Dependent variable Support for the Market
(1) (2) (3) (4)
Employment Low price
food Ownership large companies Ownership gas & electricity companies Democracy 0.087** 0.083*** 0.015 0.057 [0.037] [0.023] [0.027] [0.035]
State guarantee employment 0.000
[0.054]
State guarantee low prices 0.004
[0.040]
State ownership large companies -0.092*
[0.049]
State ownership gas & electricity companies -0.065
[0.052]
Trust -0.023 -0.024 -0.015 -0.063**
[0.022] [0.023] [0.020] [0.029]
[0.009] -0.001
Democracy*Trust*State guarantee employment
[0.001]
-0.002
Democracy*Trust*State guarantee low prices
[0.001]
-0.001
Democracy*Trust*State ownership large
companies [0.002]
-0.001
Democracy*Trust*State ownership gas &
electricity companies [0.001]
Observations 5717 5714 5713 5714
R2 0.104 0.104 0.103 0.105
Log likelihood -3759 -3757 -3759 -3754
Notes to Table 4:Controls: frontier zone dummies; income categories (rich, middle class, poor); age; age
squared; gender; occupation categories; self-employed; education categories; urban, rural or metropolitan areas. Robust standard errors adjusted for clustering on frontier zones. *** Significant at 1%, ** significant at 5%, * significant at 10%. Democracy is built on the basis of Freedom House (2006a). Pair-wise interactions between democracy, trust and each element of state intervention are controlled for.
26
5. Discussion and Conclusion
This paper sheds light on the relationship between political democracy and economic liberalism. Democratic rights increase popular support for the market. This is true, in particular, of inequality-averse agents, provided that they trust political institutions. These findings are consistent with studies that find a positive link from political to economic liberalization (Giavazzi and Tabellini 2005; Grosjean and Senik 2007), or claim that democracy makes economic growth more sustainable by delivering better distributional outcomes (Rodrik 2000).
To be sure, this paper only illustrates a static relationship between democracy and income redistribution on the one hand and support for market reforms on the other hand. Nevertheless, it is consistent with a dynamic view of historical evolution. An example is nineteen century’s Europe, where the extension of voting rights that led to unprecedented redistributive programs can be viewed as a strategy of the elite to avoid political unrest and revolution, which in turn was fed by rising inequalities due to economic development and industrialization (Acemoglu and Robinson 2000). This paper points to a strong complementarity between democratization and market reforms. It sheds some light on the “death of the liberal consensus” in central Europe: according to Krastev (2007) or Rupnik (2007), the latter is attributable to the lack of democracy. The authors describe the transition period as one characterized by a tight control by political elites and a lack of political debate or of any real alternative opposition: “voters could change governments, but could not change policies” (Krastev, 2007, p59). For example, as described by Krastev (2007), the reform of the welfare state was never really an issue of the political
27 debate; political elite colluded over strict liberal economic policies11. This conjunction between the lack of real political alternative and the rising economic inequality has certainly reinforced the appeal of populist policies.
However, the recent success of populist parties in many central European countries does not necessarily imply the death of the reform process; it could also exert a positive impact, on both democracy and market reform, by creating the formerly missing political debate (Schmitter 2006). In Ralf Dahrendorf’s words: “one man’s populism is another’s democracy” (cited in Krastev 2007, p59). Furthermore, the establishment of social safety nets and redistributive policies may in turn allow for a deepening of market reforms, as is illustrated in this paper.
In sum, this paper suggests that democracy and market reforms are complementary; as better distributional outcomes can be guaranteed by democracy. A possible counter-example is provided by the experience of some East Asian countries, where market reforms were accomplished without democratization. However, as noted by Acemoglu, Johnson and Robinson (2001), development in many Asian countries was not accompanied by rising inequalities, which is identified here as the main stall to economic reform that has to be overcome by a deepening of democracy. Countries like Taiwan or South Korea have developed along a non-democratic but egalitarian reform path, a strategy that is more the exception than the rule in developing and transition countries.
11
Krastev (2007, p 60) describes the “victory of the anti-egalitarian consensus”, which united the ex-communist elite, motivated by self-interest, and the anti-ex-communist counter-elite, motivated by ideology.
28
6. Annex
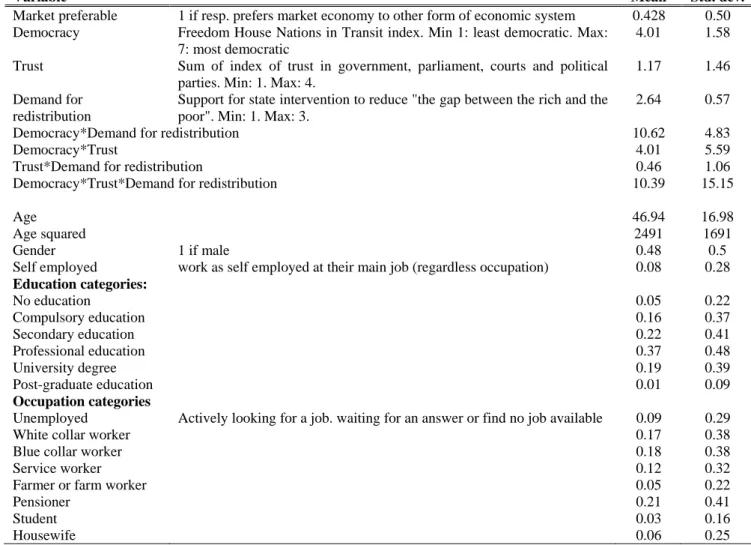
Table A1: Descriptive Statistics
Variable Mean Std. dev.
Market preferable 1 if resp. prefers market economy to other form of economic system 0.428 0.50 Democracy Freedom House Nations in Transit index. Min 1: least democratic. Max:
7: most democratic
4.01 1.58 Trust Sum of index of trust in government, parliament, courts and political
parties. Min: 1. Max: 4.
1.17 1.46 2.64 0.57 Demand for
redistribution
Support for state intervention to reduce "the gap between the rich and the poor". Min: 1. Max: 3.
Democracy*Demand for redistribution 10.62 4.83
Democracy*Trust 4.01 5.59
Trust*Demand for redistribution 0.46 1.06
Democracy*Trust*Demand for redistribution 10.39 15.15
Age 46.94 16.98
Age squared 2491 1691
Gender 1 if male 0.48 0.5
Self employed work as self employed at their main job (regardless occupation) 0.08 0.28 Education categories: No education 0.05 0.22 Compulsory education 0.16 0.37 Secondary education 0.22 0.41 Professional education 0.37 0.48 University degree 0.19 0.39 Post-graduate education 0.01 0.09 Occupation categories
Unemployed Actively looking for a job. waiting for an answer or find no job available 0.09 0.29
White collar worker 0.17 0.38
Blue collar worker 0.18 0.38
Service worker 0.12 0.32
Farmer or farm worker 0.05 0.22
Pensioner 0.21 0.41
Student 0.03 0.16
29 Figure 1: Support for the Market and Income Inequality
Latvia Estonia Slovenia Czech Republic Hungary Lithuania Romania Slovak Republic Montenegro FYR Macedonia Bulgaria
Bosnia and Herzegovina Croatia Serbia Poland Tajikistan Georgia Belarus Kazakhstan Azerbaijan Moldova Kyrgyz Republic Ukraine Uzbekistan Armenia Russia .2 5 .3 .3 5 .4 .4 5 .5 Su p p ort f o r t h e M a rk e t 25 30 35 40 Gini coefficient
Central and eastern Europe and the Baltic states South-eastern Europe Commonwealth of Independent states
Figure 2: Support for the Market and Preferences for Income Redistribution by the State
Slovak Republic Slovenia Latvia Lithuania Hungary Romania Czech Republic Estonia Bulgaria Croatia Montenegro FYR Macedonia Poland
Bosnia and Herzegovina Serbia Russia Armenia Belarus Moldova Azerbaijan Kyrgyz Republic Ukraine Kazakhstan Tajikistan Georgia Uzbekistan .2 5 .3 .3 5 .4 .4 5 .5 S u pp or t fo r th e Ma rk e t .4 .5 .6 .7 .8 .9
Preferences for reducing inequalities
Central and eastern Europe and the Baltic states South-eastern Europe Commonwealth of Independent states
30 Figure 3: Preferences for Redistribution and Income Inequality
Estonia Romania Hungary Lithuania Slovak Republic Czech Republic Latvia Slovenia Serbia
Bosnia and Herzegovina FYR Macedonia
Croatia Poland Bulgaria Montenegro Armenia Ukraine Russia Belarus Georgia Uzbekistan Kazakhstan Tajikistan Moldova Kyrgyz Republic Azerbaijan .4 .5 .6 .7 .8 .9 R e du ce i n eq ua lit ie s 25 30 35 40 Gini coefficient
Central and eastern Europe and the Baltic states South-eastern Europe Commonwealth of Independent states
Figure 4: Plot of Predicted Values for OLS and Logistic Regression for the Estimation of Equation (3) 0 .2 .4 .6 .8 1 Pr (f avm a rket ) 0 .2 .4 .6 .8 1 Linear prediction
31
References
Acemoglu, Daron and James A. Robinson (2000). Why Did The West Extend The Franchise? Democracy, Inequality, And Growth In Historical Perspective," The Quarterly Journal of Economics, MIT Press, vol. 115(4), pages 1167-1199, November.
Acemoglu, Daron, Simon Johnson and James A. Robinson (2001). The Colonial Origins of Comparative Development: An Empirical Investigation. The American Economic Review, vol. 91(5), pages 1369-1401.
Acemoglu, Daron and James A. Robinson (2002). The Political Economy of the Kuznets Curve," Review of Development Economics, Blackwell Publishing, vol. 6(2), pages 183-203, June.
Acemoglu, Daron, Maria Angelica Bautista, Pablo Querubin and James A. Robinson (2007a). Economic and Political Inequality in Development: The Case of Cundinamarca, Colombia. Working paper, June 2007.
Acemoglu, Daron, Davide Ticchi and Andrea Vindingli (2007b). Emergence and Persistence of Inefficient States, National Bureau of Economic Research, Working Paper No. 12748.
Ai, Chunrong and Edward C. Norton (2003). Interaction terms in logit and probit models. Economics
Letters, Elsevier, vol. 80(1), pages 123-129, July.
Alesina, Alberto and Nicola Fuchs-Schundeln (2007), Goodbye Lenin (or Not?): The Effect of Communism on People, The American Economic Review, Vol. 97(4), pages 1507-1528.
Alesina, Alberto and Roberto Perotti (1996). Income distribution, political instability, and investment.
32 Alesina, Alberto and Dani Rodrik (1994). Distributive Politics and Economic Growth, The Quarterly
Journal of Economics, MIT Press, vol. 109(2), pages 465-90, May.
Aslund, Anders, Peter Boone and Simon Johnson (2001). Escaping the Under Reform Trap. IMF Staff
Papers, International Monetary Fund, vol. 48(4).
Bertelsmann Stiftung (2005). Bertelsmann Transformation Index 2006: Political Management in International Comparison, http://www.bertelsmann-transformation-index.de/fileadmin/pdf/BTI_2006_Brosch_re_GB.pdf
Bianco, William T. (1994). Trust: Representatives and Constituents. Ann Arbor, MI.: University of Michigan Press.
Centre for International Development and Conflict Management (CIDCM) (2006), Polity IV: Political Regimes Characteristics and Transition: 1800-2004, University of Maryland
Desai, Raj M. and Anders Olofsgard (2006). Political Constraints and Public Support for Market Reform. IMF Staff Papers, vol. 53, Special Issue.
Denisova, Irina, Eller, Markus, Frye, Timothy and Zhuravskaya, Ekaterina. (2008). Who Wants to Revise Privatization and Why? Evidence from 28 Post-Communist Countries. CEFIR and NES working paper n°113, available at SSRN: http://ssrn.com/abstract=1008212
Dewatripont, Mathias and Gerard Roland (1995). The Design of Reform Package under Uncertainty.
American Economic Review, vol. 85, Issue 5, pp 1207-1223.
33 EBRD (2007b). Transition Report 2007.
Ferrer-i-Carbonell, Ada and Paul Frijters (2004). How Important is Methodology for the estimates of the Determinants of Happiness? Economic Journal, Royal Economic Society, vol. 114(497), pages 641-659, 07.
Fleming, J.S. and John Micklewright (2000). Income distribution, economic systems and transition. In A.B. Atkinson & F. Bourguignon (ed.), Handbook of Income Distribution, edition 1, volume 1, chapter 14, pages 843-918. Elsevier.
Fidrmuc, Jan (2003). Economic reform, democracy and growth during post-communist transition.
European Journal of Political Economy, vol. 19(3), pages 583-604.
Finifter, Ada and Ellen Mickiewicz (1992). Redefining the Political System of the USSR: Mass support for Political Change. American Political Science Review, vol 23, pages 857-874.
Freedom House (2006a). Nations in Transit 2006: Democratization from Central Europe to Eurasia, Rowman and Littlefield Publishers.
Freedom House (2006b). Freedom in the World 2006: The Annual Survey of Political Rights and Civil Liberties, Rowman and Littlefield Publishers.
Giavazzi Francesco and Guido Tabellini (2005). Economic and Political Liberalizations. Journal of
Monetary Economics, Vol. 52(7), pp. 1297-1330.
Glaeser, Edward, Jose Scheinkmanand Andrei Shleifer (2003). The injustice of inequality. Journal of
34 Grosfeld, Irena and Claudia Senik (2008). Does Inequality Spoil the Welfare Benefits of Growth? Evidence from a Long Polish Survey. Paris School of Economics Working Paper n°2008-19.
Grosjean, Pauline and Claudia Senik (2007). Should Market Liberalisation Precede Democracy? Causal Relations Between Political Preferences and Development. EBRD working paper no. 103, June 2007.
Hayo, Bernd (2004). Public support for creating a market economy in eastern Europe. Journal of
Comparative Economics, vol. 32(4), pages 720-744.
Keane, Michael P. and Eswar S. Prasad (2000). Poland: Inequality, Transfers and Growth in Transition.
Finance and Development, March 2001, Vol 38(1).
Krastev, Ivan (2007). The Strange Death of the Liberal Consensus. Journal of Democracy, vol. 18 (4), pages 56-63.
La Porta Rafael, Fiorencio Lopez-de-Silanes, Andrei Shleifer and Robert Vishny (1999). The Quality of Government. Journal of Law, Economics and Organization 15(1), 1113-1155.
Lindblom Charles E. (1995). Market and Democracy. Obliquely. Political Science and Politics, Vol. 28(4), pages. 684-688.
Lipset, Seymour M. (1959). Some Social Requisites of Democracy: Economic Development and Political Legitimacy. The American Political Science Review, vol. 53(1), pages 69-105
Milanovic, Branko (1998). Income, Inequality, and Poverty during the Transition from Planned to Market
35 Milanovic, Branko (1999). Explaining the increase in inequality during the transition. Economics of
Transition, 7(2), 299-341.
Mishler, William and Richard Rose (1997). Trust, Distrust and Skepticism: Popular Evaluations of Civil and Political Institutions in Post-Communist Societies, The Journal of Politics, Vol. 59(2), pages 418-451, May.
Persson, Torsten and Guido Tabellini (1994). Is Inequality Harmful for Growth? American Economic
Review, Vol. 84 (1994), pages 600–621.
Persson, Torsten and Guido Tabellini (2007). Democratic Capital: The Nexus of Political and Economic Change. NBER working paper 12175.
Pohlmann, John T. and Dennis W. Leitner (2003). A comparison of ordinary least squares and logistic regression. The Ohio Journal of Science, Dec.
Przeworski, Adam and Fernando Limongi (1993). Political Regimes and Economic Growth. The Journal
of Economic Perspectives, Vol. 7(3), pages 51-69.
Putnam , Robert D . (1993). Making Democracy Work. With Robert Leonardi an d Raffaella Y. Nanetti. Princeton, NJ: Princeton University Press
Robinson, James A. (2006). Economic Development and Democracy. Annual Review of Political
Sciences, Vol. 9, pages 503-27.
Rodrik, Dani (1999). Democracies Pay Higher Wages. Quarterly Journal of Economics, vol. 114(3), pages 707-738.
36 Rodrik, Dani (2000). Institutions for High Quality Growth: What They Are and How to Acquire Them.
Studies in International Comparative Development, vol. 35 (3), pages 3-31.
Roland, Gérard (2001). The Political Economy of Transition. The Journal of Economic Perspectives, vol. 16(1): 29-50.
Roland, Gérard and Thierry Verdier (2003). Law Enforcement and Transition. European Economic
Review, vol. 47(4): 669-685.
Rupnik, Jacques (2007). From Democracy Fatigue to Populist Backlash. Journal of Democracy, vol. 18 (4), pages 17-25.
Sen, Amartya K. (1999). Democracy as a Universal Value, Journal of Democracy, vol. 10(3), pages 3-17.
Schmitter, Philippe C. (2006). A Balance Sheet of the Vices and Virtues of Populism. Paper prepared for “The Challenge of the New Populism” conference, 10-11 May 2006, Sofia, Bulgaria.