HAL Id: hal-01945362
https://hal.inria.fr/hal-01945362
Submitted on 5 Dec 2018
HAL is a multi-disciplinary open access
archive for the deposit and dissemination of
sci-entific research documents, whether they are
pub-lished or not. The documents may come from
teaching and research institutions in France or
abroad, or from public or private research centers.
L’archive ouverte pluridisciplinaire HAL, est
destinée au dépôt et à la diffusion de documents
scientifiques de niveau recherche, publiés ou non,
émanant des établissements d’enseignement et de
recherche français ou étrangers, des laboratoires
publics ou privés.
Distributed under a Creative Commons Attribution| 4.0 International License
SiSEC 2018: State of the art in musical audio source
separation - subjective selection of the best algorithm
Dominic Ward, Russel D. Mason, Chungeun Kim, Fabian-Robert Stöter,
Antoine Liutkus, Mark Plumbley
To cite this version:
Dominic Ward, Russel D. Mason, Chungeun Kim, Fabian-Robert Stöter, Antoine Liutkus, et al..
SiSEC 2018: State of the art in musical audio source separation - subjective selection of the best
algo-rithm. WIMP: Workshop on Intelligent Music Production, Sep 2018, Huddersfield, United Kingdom.
�hal-01945362�
Proceedings of the 4thWorkshop on Intelligent Music Production, Huddersfield, UK, 14 September 2018
SISEC 2018: STATE OF THE ART IN MUSICAL AUDIO SOURCE SEPARATION
-SUBJECTIVE SELECTION OF THE BEST ALGORITHM
Dominic Ward
1, Russell D. Mason
2, Chungeun Kim
1, Fabian-Robert St¨oter
3, Antoine Liutkus
3and Mark
D. Plumbley
1CVSSP
1/ IoSR
2, University of Surrey, Guildford, UK
Inria and LIRMM
3, University of Montpellier, France
r.mason@surrey.ac.uk
ABSTRACT
The Signal Separation Evaluation Campaign (SiSEC) is a large-scale regular event aimed at evaluating current progress in source separation through a systematic and reproducible comparison of the participants’ algorithms, providing the source separation community with an invaluable glimpse of recent achievements and open challenges. This paper fo-cuses on the music separation task from SiSEC 2018, which compares algorithms aimed at recovering instrument stems from a stereo mix. In this context, we conducted a subjective evaluation whereby 34 listeners picked which of six com-peting algorithms, with high objective performance scores, best separated the singing-voice stem from 13 professionally mixed songs. The subjective results reveal strong differ-ences between the algorithms, and highlight the presence of song-dependent performance for state-of-the-art systems. Correlations between the subjective results and the scores of two popular performance metrics are also presented.
1. INTRODUCTION
High-quality separation of the singing voice from accompa-nying instruments is an important yet difficult task serving many applications, including soloing, karaoke, remixing and upmixing music [1], and even for studying music production techniques [2]. Despite the plethora of musical applications that audio source separation affords, separation quality is often far from perfect, introducing distortions and artefacts that degrade the perceived quality of the extracted source. Another issue is interference, whereby the unwanted sources remain present to some extent. Nevertheless, notable im-provements in signal separation have been made in recent years, particularly due to the surge of deep-learning tech-niques which have proved to outperform traditional signal processing methods, as documented by the Signal Separation Evaluation Campaign (SiSEC) [3].
SiSEC was initiated to compare the performance of separ-ation systems on a voluntary and community basis by prepar-ing, organisprepar-ing, deploying and evaluating signal separation challenges that target different domains [3]. The MUS(ic) task of SiSEC is designed to assess systems that extract mu-sical instruments from popular music mixes. It has gained rapid interest from algorithm proponents over recent years, due to the development of high-quality and freely-available
audio datasets, as well as its unified platform for training, testing, and submitting source separation algorithms for fair comparison. Separation quality is typically evaluated using objective metrics that quantify distortions between the target and estimated sources; the most common being the blind source separation evaluation (BSS Eval) toolkit [4], followed by the Perceptual Evaluation methods for Audio Source Sep-aration (PEASS) toolkit [5]. Although these metrics show some predictive ability for singing-voice separation qual-ity [6], generalisation to other sources and algorithms has been questioned [7], indicating that further refinement is warranted in order for them to be used for general purpose performance measurement. However, for most applications, subjective qualityof the separation result is key; therefore it is imperative that auditory assessments are conducted to measure quality as judged by human listeners.
Accordingly, we have conducted a perceptual experiment using the most recent set of songs and separation algorithms in the SiSEC 2018 MUS task dataset. This paper presents the results of the experiment, with the goal of identifying the separation algorithms that can most successfully extract the singing-voice from a range of song mixtures.
2. SUBJECTIVE ASSESSMENT 2.1. MUSDB18
The MUSDB18 dataset [8] is a freely-available set of 150 professionally mixed songs from a range of genres, each comprising four stereo sources (bass, drums, vocals and a group of other instruments) that sum to produce typical song mixes. For the MUS task, MUSDB18 was divided into 100 songs for training and 50 songs for testing, and 30 systems were evaluated using BSS Eval metrics applied to each of the estimated sources [3].
2.2. Selecting the stimuli
For the listening test, we limited the selection of test stim-uli to the singing-voice (vocals) from the test portion of MUSDB18. As a starting point, we first selected one al-gorithm from participants with multiple submissions, and then selected the six algorithms (see Table 1) with the highest median source-to-distortion ratios (SDR), a global perform-ance metric provided by the BSS Eval v4 toolkit [3]. The
Proceedings of the 4thWorkshop on Intelligent Music Production, Huddersfield, UK, 14 September 2018
songs were selected with the goal of obtaining content of varying separability. Among the 50 test songs, 10 were se-lected to yield a wide range of SDR values; a further three were selected from an informal pilot experiment as contain-ing atypical artefacts. The original vocals were included as reference material for listeners to compare against. Stimuli were segmented into seven-second portions where all instru-ments were most active [9], and then loudness normalised according to ITU-R BS.1770 [10].
Algorithm Description
TAK2 Multi-scale multi-band DenseLSTM [11]
TAU1 Blending of MMDenseNets and LSTM (UHL3) [12, 13] UHL3 Bi-directional LSTM with 3 BLSTM layers [12] JY3 Denoising auto-encoder with skip connections [14] STL1 Wave-U-Net for end-to-end audio source separation [15] MDL1 Recurrent inference algorithm with masker and denoiser
architecture [16]
Table 1: Overview of the six deep-learning based musical audio source separation algorithms evaluated, in descending order of median SDR for the vocals of the MUSDB18 test set.
2.3. Procedure
Participants of the listening assessment were delegates of the 14th LVA ICA conference1, and the assessments were
undertaken in edit rooms with good acoustic isolation and minimal visual distractions. The stimuli were reproduced over professional-grade studio headphones. Forty-two listen-ers undertook at least part of the experiment at the confer-ence, and two listeners completed the full experiment online, giving a total of 44 participants. Of these, 34 completed the full experiment.
For each of the 13 songs, participants were asked to select one of six extracted vocals (each corresponding to one of the algorithms listed in Table 1) that they perceived to be most similarto the original vocals. A short training stage involving audio examples informed listeners about the music source separation task and explained what audible deviations should be taken into account as promoting dissimilarity from the original vocals, e.g. the presence of other instruments and artificial noise. The presentation order of both songs (on separate pages) and algorithms (within each page) was randomised for each listener. Participants were able to end the session at any time.2
3. RESULTS
The analysis was undertaken using the data from the 34 par-ticipants that completed the full experiment. The count data, obtained by summing the number of times each stimulus was selected, were subject to a Chi-Square analysis to test the null-hypothesis that all algorithms are equally likely to be se-lected for a given song (of 13). If the probability of obtaining a Chi-Square statistic at least as extreme as the one calculated
1http://cvssp.org/events/lva-ica-2018/
2The test is available athttps://cvssp.github.io/sisec-mus-18-pick-the-best/
was less than 0.05/13, the null-hypothesis was rejected. The standardised residuals (difference between observed count and expected count under the null-hypothesis, divided by square-root of the expected count) were then used to identify algorithms with counts that systematically differed from the expected value, based on a z-score threshold of 2.64 (corres-ponding to α = 0.05/6). The results are shown in Figure 1.
Figure 1: Subjective results indicating the number of times each algorithm (x-axis) was selected for each song (y-axis), shown in greyscale. Algorithms in ascending order, from left to right, of aver-age count. Blue triangles identify stimuli selected more frequently than expected under the null-hypothesis. Values of ρ indicate the Spearman rank correlation between a given song and the combined results.
The blue triangles highlight the algorithms with higher counts than expected if the counts were uniform within each song, suggesting that listeners perceived specific separated vocals as being more similar to the reference vocals. Of the 34 participants, none selected MDL1 in any of the songs, and STL1 received a highest count of only 3. TAU1 was selected most often for seven songs, and joint-top in two. TAK2 and UHL3 were selected most often for two and three songs, respectively, both joint-top with TAU1 for one song. Interestingly, the leading algorithms UHL3, TAK2 and TAU1 were rarely selected for the Sunshine Garcia Band track, where JY3 was chosen by 16 of the 34 listeners (flagged as being systematically higher than the expected count).
This difference in the results for some songs is high-lighted by the Spearman correlation ρ (in green; Figure 1) between the results across separation algorithms for each song with the sum of the results across songs. The Sun-shine Garcia Bandtrack has a correlation of only 0.49, with the Ben Carrigan, Buitraker, and James Elder & Mark M Thompsontracks also showing a weaker correlation with the overall results.
3.1. Comparison with objective measures
The subjective results were compared with the SDR metric from BSS Eval v3 [4] and with the Overall Perceptual Score (OPS) from PEASS [5]: both are intended to reflect the
Proceedings of the 4thWorkshop on Intelligent Music Production, Huddersfield, UK, 14 September 2018
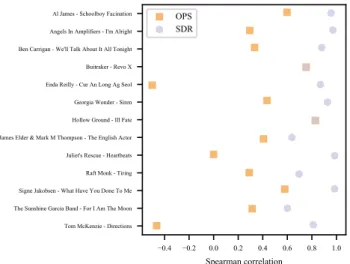
all separation quality. The loudness-normalised stimuli were input to both metrics, using the vocal accompaniment as the true interfering source. Figure 2 shows the (song-wise) Spear-man rank correlation between the observed frequency counts of the test stimuli, and the SDR and OPS measures. The plot suggests that stimuli with higher SDR are more likely to be selected; for seven songs the most frequently selected algorithm (or joint-top) had the highest SDR. OPS is less correlated with the subjective results, including some moder-ate negative correlations; the algorithm with the highest OPS was most frequently selected in only two songs.
0.4 0.2 0.0 0.2 0.4 0.6 0.8 1.0
Spearman correlation Al James - Schoolboy Facination
Angels In Amplifiers - I'm Alright Ben Carrigan - We'll Talk About It All Tonight Buitraker - Revo X Enda Reilly - Cur An Long Ag Seol Georgia Wonder - Siren Hollow Ground - Ill Fate James Elder & Mark M Thompson - The English Actor Juliet's Rescue - Heartbeats Raft Monk - Tiring Signe Jakobsen - What Have You Done To Me The Sunshine Garcia Band - For I Am The Moon Tom McKenzie - Directions
OPS SDR
Figure 2: Spearman correlation between the observed frequency counts of the test stimuli, and the corresponding OPS/SDR values, separated by song.
4. CONCLUSIONS
A listening experiment was performed to identify source separation algorithms that can most successfully extract the singing-voice from a range of song mixtures (defined as the separated vocals perceived as most similar to the original vocals), and whether the success is accurately predicted by the objective measures.
The results show that for many of the songs the TAU1 al-gorithm was most successful, but there was a certain amount of dependence on song, suggesting that specific algorithms may need further enhancement to generalise across genres. For seven songs, the algorithms with notably high counts also had the highest SDR value (BSS Eval toolkit). Spear-man correlations between subjective results and SDR were consistently higher than those with OPS (PEASS toolkit), which included some moderate negative correlations. These results indicate that some refinement of objective measures, primarily OPS, is required to accurately reflect the similarity judgements of human listeners.
5. REFERENCES
[1] G. Roma, E. M. Grais, A. J. R. Simpson and M. D. Plumbley, “Music remixing and upmixing using source separation”, in 2nd WIMP, AES, Sep. 2016.
[2] D. Ward, H. Wierstorf, R. D. Mason, M. D. Plumbley and C. Hummersone, “Estimating the loudness balance of musical mixtures using audio source separation”, in 3rd WIMP, AES, Sep. 2017.
[3] F.-R. St¨oter, A. Liutkus and N. Ito, “The 2018 signal sep-aration evaluation campaign”, in Latent Variable Analysis and Signal Separation, Y. Deville, S. Gannot, R. Mason, M. D. Plumbley and D. Ward, Eds., Cham: Springer, Jul. 2018, pp. 293–305.
[4] E. Vincent, R. Gribonval and C. F´evotte, “Performance measurement in blind audio source separation”, IEEE Trans. Audio, Speech and Language Processing, vol. 14, no. 4, pp. 1462–1469, 2006.
[5] V. Emiya, E. Vincent, N. Harlander and V. Hohmann, “Sub-jective and ob“Sub-jective quality assessment of audio source separation”, IEEE Trans. on Audio, Speech, and Language Processing, vol. 19, no. 7, pp. 2046–2057, Sep. 2011. [6] D. Ward, H. Wierstorf, R. D. Mason, E. M. Grais and M. D.
Plumbley, “BSS EVAL or PEASS? Predicting the Percep-tion of Singing-Voice SeparaPercep-tion”, in 43rd ICASSP, IEEE, Apr. 2018.
[7] E. Cano, D. FitzGerald and K. Brandenburg, “Evaluation of quality of sound source separation algorithms: Human per-ception vs quantitative metrics”, in 24th EUSIPCO, IEEE, Aug. 2016.
[8] Z. Rafii, A. Liutkus, F.-R. St¨oter, S. I. Mimilakis and R. Bittner, The MUSDB18 corpus for music separation, Dec. 2017.DOI: 10.5281/zenodo.1117372.
[9] R. Bittner, J. Salamon, M. Tierney, M. Mauch, C. Can-nam and J. P. Bello, “MedleyDB: A multitrack dataset for annotation-intensive MIR research”, in 15th ISMIR, Oct. 2014.
[10] ITU-R BS.1770, “Algorithms to measure audio programme loudness and true-peak audio level”, International Telecom-munication Union, Tech. Rep. 4, 2015.
[11] N. Takahashi, N. Goswami and Y. Mitsufuji, “MMDenseL-STM: An efficient two way modeling for audio source sep-aration”, in arXiv pre-print, 2018.
[12] S. Uhlich, M. Porcu, F. Giron, M. Enenkl, T. Kemp, N. Taka-hashi and Y. Mitsufuji, “Improving music source separation based on deep neural networks through data augmentation and network blending”, in 42nd ICASSP, IEEE, Mar. 2017. [13] N. Takahashi and Y. Mitsufuji, “Mitsufuji: Multi-scale multi-band densenets for audio source separation”, in WASPAA, IEEE, Oct. 2017.
[14] A. Jansson, E. Humphrey, N. Montecchio, R. Bittner, A. Kumar and W. T., “U-net convolutional networks”, in 18th ISMIR, Oct. 2017.
[15] D. Stoller, S. Ewert and S. Dixon, “Wave-u-net: A multi-scale neural network for end-to-end source separation”, in 19th ISMIR, Sep. 2018.
[16] S. Mimilakis, K. Drossos, J. Santos, G. Schuller, T. Virtanen and Y. Bengio, “Monaural singing voice separation with skip-filtering connections and recurrent inference of time-frequency mask”, in 43rd ICASSP, IEEE, Apr. 2018.