Can you see what you feel? Color and folding properties
affect visual–tactile material discrimination of fabrics
The MIT Faculty has made this article openly available.
Please share
how this access benefits you. Your story matters.
Citation
Xiao, Bei et al. “Can You See What You Feel? Color and Folding
Properties Affect Visual–tactile Material Discrimination of Fabrics.”
Journal of Vision 16.3 (2016): 34. © 2015 Association for Research in
Vision and Ophthalmology
As Published
http://dx.doi.org/10.1167/16.3.34
Publisher
Association for Research in Vision and Opthalmology
Version
Final published version
Citable link
http://hdl.handle.net/1721.1/110625
Terms of Use
Creative Commons Attribution-NonCommercial-NoDerivs License
Can you see what you feel? Color and folding properties affect
visual–tactile material discrimination of fabrics
Bei Xiao
Department of Computer Science, American University,Washington, DC, USA#
$
Wenyan Bi*
Department of Computer Science, American University,Washington, DC, USA$
Xiaodan Jia*
#
Computer Science and Artificial Intelligence Laboratory (CSAL), Massachusetts Institute of Technology, Cambridge, MA, USA Present address: Oracle Corporation, Redwood City, CA, USA
Hanhan Wei
Computer Science and Artificial Intelligence Laboratory (CSAL), Massachusetts Institute of Technology, Cambridge, MA, USA TCL Corporation, Shenzhen, Guangdong, China
Edward H. Adelson
#
$
Computer Science and Artificial Intelligence Laboratory (CSAL) and Department of Brain and Cognitive Sciences, Massachusetts Institute of Technology, Cambridge, MA, USA
Humans can often estimate tactile properties of objects from vision alone. For example, during online shopping, we can often infer material properties of clothing from images and judge how the material would feel against our skin. What visual information is important for tactile perception? Previous studies in material perception have focused on measuring surface appearance, such as gloss and roughness, and using verbal reports of material attributes and
categories. However, in real life, predicting tactile properties of an object might not require accurate verbal descriptions of its surface attributes or
categories. In this paper, we use tactile perception as ground truth to measure visual material perception. Using fabrics as our stimuli, we measure how
observers match what they see (photographs of fabric samples) with what they feel (physical fabric samples). The data shows that color has a significant main effect in that removing color significantly reduces accuracy, especially when the images contain 3-D folds. We also find that images of draped fabrics, which revealed 3-D shape information, achieved better matching accuracy than images with flattened fabrics. The data shows a strong interaction between color and folding
conditions on matching accuracy, suggesting that, in 3-D folding conditions, the visual system takes
advantage of chromatic gradients to infer tactile properties but not in flattened conditions. Together, using a visual–tactile matching task, we show that humans use folding and color information in matching the visual and tactile properties of fabrics.
Introduction
In daily life, we can make predictions about the tactile and mechanical properties of objects that have not yet been touched (Adelson, 2001). For example, when we reach to pick up a glass of milk, we have already automatically made predictions about the weight and rigidity of the glass as well as the fluidity of the milk. The facts that glass is rigid and water is fluid are crucial in planning the initial grip and lift force. What allows the visual prediction of tactile and mechanical properties of objects?
Different categories of materials, such as different types of food, wood, plastic, stone, and fabrics, exhibit different visual attributes that are characteristic of the materials (Fleming,2014). Surface cues, such as color, texture, and reflectance patterns as well as 3-D shape, are
Citation: Xiao, B., Bi, W., Jia, X., Wei, H., & Adelson, E. H. (2016). Can you see what you feel? Color and folding properties affect visual–tactile material discrimination of fabrics.Journal of Vision,16(3):34, 1–15, doi:10.1167/16.3.34.
often informative about the tactile and mechanical property of an object, such as its mass, stiffness, hardness, and surface friction, as well as functional properties, such as wetness, edibility, thermal conductivity, etc. Until recently, however, the field of material perception has concentrated on the passive perception of visual proper-ties, such as surface gloss, translucency, and roughness, and material categories by measuring only visual responses (Anderson & Kim, 2009; Fleming, Wiebel, & Gegenfurtner, 2013; Giesel & Zaidi, 2013; Kawabe, Maruya, Fleming, & Nishida, 2015; Maloney & Brai-nard, 2010; Sharan, Rosenholtz, & Adelson, 2014). These studies revealed important image cues that are associated with material perception under a variety of contexts.
However, in reality, humans often use multiple senses to judge material properties of objects. Previous literature has shown that inputs from multiple senses often interact during material perception (Bonneel, Suied, Viaud-Delmon, & Drettakis,2010; Buckingham, Cant, & Goodale, 2009; Fujisaki, Goda, Motoyoshi, Komatsu, & Nishida, 2014; Fujisaki, Tokita, & Kariya, 2015; Mart´ın, Iseringhausen, Weinmann, & Hullin, 2015; Tiest & Kappers, 2007). The majority of multisensory studies of human material perception have focused on measuring one or certain specific attributes, such as surface roughness (Tiest & Kappers, 2007). A few studies have looked at the dimensionality of haptic and visual perception of material properties and found that the roles of visual modalities and haptic modalities were both overlapping and complementary (Bhushan, Rao, & Lohse, 1997; Hollins, Bensma¨ıa, Karlof, & Young, 2000; Rao & Lohse, 1993).
Baumgartner, Wiebel, and Gegenfurtner (2013) asked observers to categorize and rate several material properties of 84 different material samples. The experiments were done with both visual-alone and haptic-alone conditions. They found that haptic and visual perception of material properties are highly correlated such that the principal component analysis shows that material samples are similarly organized within both sensory modalities. Mart´ın et al. (2015)
compared visual and auditory perception of material properties by rating perceptual qualities (pairs of adjectives) using visual and auditory channels sepa-rately or together. Their results revealed that auditory cues have strong bias toward tactile qualities of the materials.
Most of these multisensory studies used attribute rating as the main task. Hence, the results depended on observers’ ability of using language to describe
material properties. In reality, however, we often directly access an object’s properties by touching without verbally describing its properties (see Klatzky & Lederman, 2010; Lederman & Klatzky, 2009; Tiest, 2010, for reviews). To test whether the bread you see in the market has a good crust but is still soft inside, the best way is to squeeze it by hand. Even when we cannot touch the object (such as during online shopping), visual information can wordlessly convey tactile properties that allow us to predict the tactile properties of an object. For example, when we choose to buy a silk scarf, we look at its surface gloss, color, surface texture, and folds presented in the images to judge its material properties. Previous studies have shown that vision is sufficient to directly recognize tactile properties, such as surface roughness, and can guide the selection of a haptic exploration procedure (Lederman & Klatzky, 1993; Plaisier, Kappers, Tiest, & Ernst, 2010; Tiest & Kappers, 2007). In this study, we aim to use tactile sensation as ground truth to evaluate the success of visual perception of material properties. In addition, we wish to explore what visual information, such as shape and color, can efficiently convey tactile properties.
Figure 1A shows that different photographs of the same fabrics from different online vendors exhibit different tactile and mechanical properties. The image that shows a human hand rubbing the fabric provides a much better sense of the fabric’s mechanical and tactile properties than the other photos.
Figure 1. Folding configuration plays an important role in estimating material properties of objects from images. Photographs of the same fabric with different folding configuration reveal different aspects of its material properties. From left to right: A fabric is (A) being flattened, revealing color and texture information; (B) being rippled, showing surface glossiness; (C) being draped from a rod, providing both optical and mechanical properties of the fabric (amazon.com); and (D) being manipulated by a hand, providing tactile, mechanical, and optical properties (ebay.com).
The present study
In summary, past studies in material perception focused on measuring visual attributes with verbal reports. However, understanding material perception of objects in the real world requires multisensory inputs and natural tasks without verbal report. In this paper, restricting the stimuli to fabrics, we designed a natural task in which observers were asked to match what they see (without touching) to what they feel (without looking). Figure 2shows the experiment task and apparatus. We manipulated the 3-D folding conditions of the fabrics as well as the color of the photographs and measured how well observers matched the photo-graphs to the physical samples. Our goal was to discover image regularities that contribute to the prediction of tactile properties of fabrics from images.
Experiment 1
In Experiment 1, we aimed to investigate whether color information and folds of fabrics in an image affect tactile perception of fabrics. We began by photographing fabrics under various folding conditions so that the photographs conveyed different shape information: 2D_Flat, 3D_Draping, and 3D_Hanging. We then created two color conditions, the original color (red-green-blue) RGB condition and the grayscale condition in which we converted the color images to gray scale. We thus created six experimental conditions: 2D_Flat_RGB, 2D_Flat_Grayscale, 3D_Draping_RGB, 3D_Draping_-Grayscale, 3D_Hanging_RGB, 3D_Hanging_Grayscale (Figure 3). In a tactile–visual matching task, we asked observers to arrange the two pieces of fabrics using their hands inside a box (without looking) so that their
Figure 2. Experimental apparatus and task. (A) Our stimuli are everyday apparel fabrics. (B) Front view of the experimental chamber. (C) A demonstration of the tactile–visual paired comparison task: An observer is asked to arrange two pieces of fabrics inside a box (without looking) with his or her hands so that the positions of the fabrics are matched to the same pair of fabrics displayed outside the box (without touching). (D) Instead of using real fabrics as visual stimuli, the experiment is conducted using the images of the fabrics displayed on a monitor.
positions matched the images of the same pair of fabrics displayed on the monitor (Figure 2D). If the images can reveal sufficient tactile properties, then observers will be able to tell which photo is corresponding to which piece of the physical sample they feel.
Methods
Observers
Forty-two observers participated in this experiment with seven observers in each of the six experimental conditions. Among them, there were 23 women and the median age was 24.
Materials
Materials were 34 common apparel fabrics pur-chased from the website www.fabrics.com(Figure 4). The size of each fabric sample was about 13 3 13 in. The fabrics were chosen from 12 categories: satin, silk, linen, broadcloth, corduroy, velvet, denim, jersey, shirting cotton, flannel, chambray, and twill. We chose fabrics that had obvious textures, such as corduroy and twill, as well as relatively flat fabrics, such as jersey and shirt cotton. For each type of fabric, we prepared four pieces: one piece was used for the tactile exploration; three were used to make the visual stimuli for the three shape conditions.
Fabric pair selection: If we used all combinations of the 34 fabrics (see Figure 4), there would be 561 pairs of fabrics. This would be redundant and might create a memory carryover effect. Also, from empirical
obser-vations, we noticed that some fabric pairs, such as those that differ greatly in both reflective and tactile properties, were easy to discriminate even for the stimuli for which the visual information had been reduced substantially. Due to the ceiling effect, it would be impossible to discover any effects of folding shape and color information. For example, a piece of shiny satin and a flannel (e.g., fabrics 31 and 9) were distinctive in multiple dimensions, such as reflective properties, thickness, and texture. Observers had no problem telling them apart even with flat fold and in gray scale. To avoid ceiling effects, we conducted a pilot study in order to select fabric pairs that are slightly challenging to distinguish on average.
In the pilot experiment, all the possible 561 pairs of the 34 fabrics were compared by four observers (three female, median age 25) using the same tactile–visual matching task but with real samples (observers were presented with fabrics laid over the convex objects on the box instead of images). The accuracy of the pilot study was about 86%. We included the fabric pairs that had resulted in at least one mistake. For the pairs without errors, we manually chose those that were within similar categories (such as both satin or both linen with slightly different smoothness and thickness). In this way, 60 pairs were finalized as stimuli for Experiment 1 (see Supplementary Materials for all stimuli).
Photographs and display
Photographs of the fabric samples were used as visual stimuli. Figure 3 shows examples of photo-graphs of the fabrics in six experimental conditions. For the 2D_Flat conditions, the fabric was mounted on a flat board (edges not visible). For the
3D_Draping conditions, the photo was taken while a convex object was centered in the image frame. The fabric was arranged so that it draped over the object. For the 3D_Hanging conditions, the fabric was hung up at its two corners from the same side using safety pins.
Each photograph contained one fabric sample. The fabric sample was draped on top of a black cloth– covered table. The camera stood at the edge of the table above the fabric sample with its objective perpendicular to the sample. There were three light sources: fluorescent lights on the ceiling at a distance 1 m from the table surface, a Diva-Lite floor lamp (Kino Flo Diva-Lite 401; Kino Flo, Burbank, CA) on the right side 458 above the table horizon at a distance of 1 m from the table surface, and a tungsten bulb light source right above the fabrics at 1 m from the table surface. The height of the camera was aimed at the center of the fabric. The photographs were white-balanced with a common white point defined by a photograph of a Macbeth color checker in the same Figure 3. Example photographs of stimuli used in Experiment 1.
Top: Fabrics are draped over a round object. Left pair was in 3D_Draping_RGB condition; right pair was in 3D_Draping_-Grayscale condition. Middle: Fabrics are hung from two corners. Left pair was in 3D_Hanging_RGB condition; right pair was in 3D_Hanging_Grayscale condition. Bottom: Fabrics are flattened and mounted onto cardboard. Left pair was in 2D_Flat_RGB condition; right pair was in 2D_Flat_Grayscale condition.
lighting environment. The camera was a Canon EOS Rebel T2i (Canon, Tokyo, Japan) with EF 24-105 mm f/4L IS USM lens.
The photographs were shot in raw format and then converted to .dng files after being white-balanced using a calibration target. We then created the grayscale images by removing the color from the RGB images. There are many methods to convert color images to gray scale. In the current study, our method was based on the lightness dimension in the CIElab color space. The images were transformed from RGB to CIELab space, and the lightness dimension was extracted and normalized. Then the inverse CIElab was converted back to RGB as stimuli. This method has been demonstrated to be suitable for texture recognition from images (Kanan,2012).
During the experiment, two images of the fabrics were displayed side by side on an LCD monitor (Apple OS 21.5-in. iMac, ME087LL/A; Apple, Inc., Cuperti-no, CA) in each trial at a 50-cm distance from the observer. The images measured spread visual angles 68 35.58 when they were displayed on the monitor (Figure
2D).
Apparatus and procedure
Figure 2B shows an illustration of the experimental apparatus. An experiment chamber was installed on top of a table with curtains covered from four sides. A box (30.5 3 24 3 10 in.) with two openings, one at each end, was positioned on top of the table. It was covered
by a black cloth, which draped over the opening so the inside of the box was invisible. The LCD monitor was mounted on top of the box.
Figure 2C illustrates the experimental procedure with real samples, but the images used in the actual experiment were displayed on a calibrated LCD monitor (Figure 2D). At the beginning of the
experiment, the observer was sitting behind the closed curtain. An experimenter sitting at the other side of the curtained chamber put two pieces of fabric into the box through an opening. At the start of each trial, the observer was signaled to open the curtain and put his or her hands into the box and get ready. At the same time, the observer was presented with two images of the same two pieces of fabric from one of the six experimental conditions. The task was to arrange the fabrics inside the box so that their relative positions were the same as the images showed (e.g., ‘‘left’’ in the box is corresponding to the ‘‘left’’ image). The
observer was instructed to only touch the fabrics inside the box without looking into the box. The images were presented for 12 s. The time for the observer to feel and arrange the fabrics was unlimited. On average, each trial took 10 s. Once the observer made the arrangement, the observer closed the curtain, and the experimenter registered the choice (either correct or incorrect). Then the experimenter started to prepare for the next trial. The order as well as the relative positions (left, right) of the fabric pairs were randomized for each subject.
Results
We began by looking at mean matching accuracy of all 60 fabric pairs. Figure 5Ashows the mean accuracy across all observers for the three folding conditions of both RGB and grayscale conditions. Overall, the observers were good at this task. The mean accuracy across all conditions was 76% rounded to the nearest integer. Figure 5A also shows a significant effect of color on matching accuracy. The effect of folding on accuracy depends on color conditions. Folding
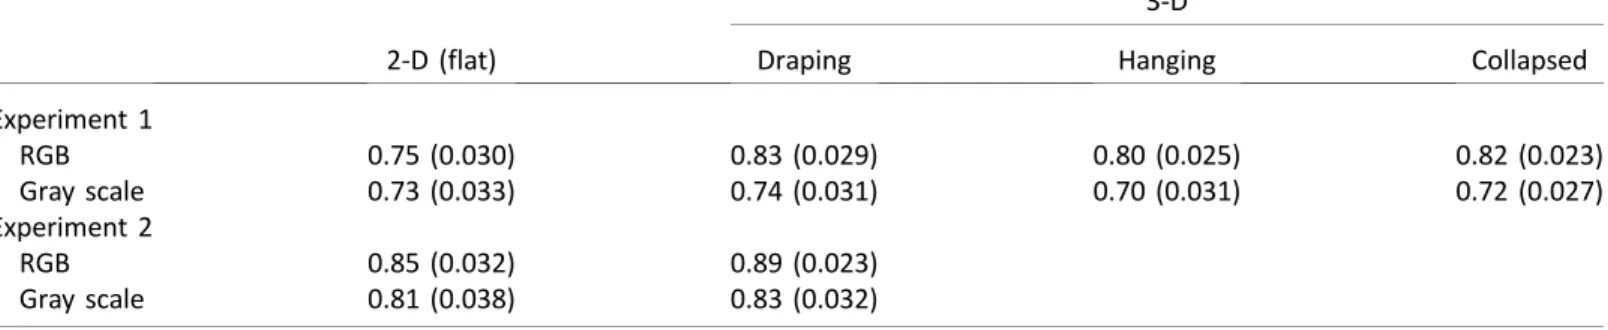
condi-tion has a significant effect on color images but not on grayscale images. The upper panel of Table 1 summa-rizes mean percentage accuracy (and standard errors) for all conditions in Experiment 1.
To further understand the effects, we performed a two-way ANOVA with repeated measure of color (RGB and gray scale) and folding conditions (3D_Draping, 3D_Hanging, 2D_Flat). Overall, the accuracy in the RGB condition was significantly higher than gray scale (0.79 vs. 0.72), F(l, 59)¼ 16.35, p ¼ 0.000, g2
p¼ .22. The interaction between color and
folding conditions was also marginally significant, F(2, 58)¼ 2.46, p ¼ 0.09, g2
p¼ .08.
Figure 5A explains the interaction between color and folding conditions. The accuracy in the RGB condition was significantly higher than that in the grayscale condition only for the 3D_Draping condi-tion, F(1, 59)¼ 8.51, p ¼ 0.005, g2
p¼ .13, and
3D_Hanging condition, F(1, 59)¼ 11.89, p ¼ 0.001, g2 p
¼ .17, but not for the 2D_Flat condition, F(1, 59) ¼ 0.52, p . 0.10, g2
p¼ .01. It also showed that folding
conditions had a significant effect in the RGB condition, F(2, 118)¼ 3.84, p , 0.05, g2
p¼ .06. Pairwise
comparisons using the Bonferroni method further revealed that the effect resulted from the difference of accuracy between the 3D_Draping condition and 2D_Flat conditions ( p , 0.05). But there was no difference between other pair comparisons.
Because there were no significant differences in results patterns between 3D_Hanging and 3D_Draping conditions ( ps . 0.10), we collapsed the two folding conditions and conducted another 2 (RGB, gray scale) 32 (3-D, 2-D) ANOVA with a repeated measure (upper panel of Table 2). The results showed that color had a significant main effect, F(l, 59)¼ 10.61, p , 0.002, g2
p¼ .15, on matching accuracy.
In addition, when the two folding conditions were collapsed, it was found that the interaction between color and folding conditions became significant, F(l, 59) ¼ 4.88, p , 0.05, g2
p¼ .08. As shown by Figure 5B, the accuracy in the RGB condition was significantly higher than in the grayscale condition for the 3-D condition (0.82 vs. 0.72), F(l, 59)¼ 19.14, p ¼ 0.000, g2
p¼ .25, but
not for the 2-D condition ( p . 0.10). Likewise,
Figure 5. Tactile and visual matching results from Experiments 1
and 2. (A) Mean matching accuracy (6SEM) of comparing three color conditions and two folding conditions (across all trials and all observers) of Experiment 1. X-axis represents three folding conditions. Dark blue bar represents RGB color condition, and light blue represents grayscale condition. (B) Same as (A), but 3D_Draping and 3D_Hanging conditions have been collapsed into 3-D condition. (C) Same as (A) but plotted for data of Experiment 2. *p, 0.05, **p , 0.005, ***p, 0.001.
2-D (flat)
3-D
Draping Hanging Collapsed
Experiment 1 RGB 0.75 (0.030) 0.83 (0.029) 0.80 (0.025) 0.82 (0.023) Gray scale 0.73 (0.033) 0.74 (0.031) 0.70 (0.031) 0.72 (0.027) Experiment 2 RGB 0.85 (0.032) 0.89 (0.023) Gray scale 0.81 (0.038) 0.83 (0.032)
accuracy in the 3-D condition was significantly higher than in the 2-D condition for the RGB condition (0.82 vs. 0.75), F(l, 59)¼ 6.46, p , 0.05, g2
p¼ .10, but not for
the grayscale condition ( p . 0.10). No other effects were found ( ps . 0.10).
Experiment 2
In Experiment 1, we discovered that both color and folding shape have effects on visual and tactile
matching. Our fabric pairs were chosen based on a pilot experiment using real samples in the draping condition to avoid a ceiling effect. However, this preselection may have favored the draping condition because the subset was selected to allow for errors under this condition. Additionally, we used a between-subjects design in Experiment 1 to minimize the carryover effects. It raises the question of whether the differences between the groups of observers also contributed to the results. Finally, we were interested in whether our results would generalize to other types of apparel fabrics.
In Experiment 2, we aimed to solve the above issues by (a) using a different set of fabric samples that had the same size and similar thickness as those in
Experiment 1, (b) choosing the fabric pairs from all possible combinations using a tactile similarity rating experiment, and (c) including a control experiment that involved all observers performing the matching task on the same set of fabrics.
Experiment 2 used the same tactile and visual matching task as in Experiment 1. We measured the same experimental conditions, RGB versus grayscale
images for draping and flat conditions. Because in Experiment 1 we did not discover significant differences between the 3D_Draping and 3D_Hanging conditions, we only used the 3D_Draping condition in Experiment 2. Thus, we got four conditions in this experiment: 3D_RGB, 3D_Grayscale, 2D_RGB, and 2D_Gray-scale.
Methods
Observers
Sixteen observers participated in this experiment with four observers in each of the four experimental conditions. Among them, there were 11 women, and the median age was 20.
Materials
Materials were 15 new common apparel fabrics purchased from the website www.fabrics.com (Figure 6). But the categories of the fabrics were similar to those used in Experiment 1. The size of each fabric sample was about 13 3 13 in.
Fabric pair selection: Different from Experiment 1, we conducted a pilot study using a pairwise tactile
similarity rating procedure to select the fabric pairs. No visual information about the fabrics was presented during the selection procedure.
Five undergraduates from American University with a median age of 19 years participated in the pilot experiment. The experimental apparatus was exactly the same as in Experiment 1. After the experiment began, the experimenter put two pieces of fabric into the box through an opening and then verbally notified the observer to start the trial. The observer was instructed to put his or her hands into the box to feel the two fabrics and verbally rated the dissimilarity of the two fabrics on a scale from 1 (extremely similar) to 10 (extremely different). After each report, the observer closed the curtain, and the experimenter wrote down the rating. Then the experimenter started to prepare for the next trial. There were, in total, 105 pairs, and the sequences of fabric pairs were randomized among the five observers.
We computed the average rating across observers for each pair. The fabric pairs were then ranked according to the average rating across observers. We chose the 65
Color Folding
Interaction
RGB Gray scale F (p) 3-D 2-D F (p)
Experiment 1 0.79 (0.023) 0.72 (0.027) 10.61**(0.002) 0.77 (0.022) 0.74 (0.029) 2.24 (0.140) 4.89* (0.031) Experiment 2 0.87 (0.026) 0.82 (0.031) 4.68* (0.034) 0.86 (0.025) 0.83 (0.031) 3.21 (0.078) 0.52 (0.472) Table 2. The effect of folding and color conditions on tactile and visual matching performance for Experiments 1 and 2.Notes: Descriptive results are presented asM6SEM. *p, 0.05, **p, 0.005.
pairs for which the ratings were between two and eight. This eliminated the fabric pairs that were too easy or too hard for the observers to discriminate, thus avoiding the ceiling and floor effects (see Supplementary Materialsfor all stimuli).
Photographs and display
We prepared our stimuli in a similar way as in Experiment 1by taking photographs of fabric samples by draping them over a bumpy object as well as mounting them onto a flat foam board. The fabric sample was displayed on a table. We used a slightly different lighting environment. There were three light sources: fluorescent lights on the ceiling at a distance 1 m from the table surface and two fluorescent umbrella lights (LimoStudio Digital Full Spectrum Light Bulb 45 W) on both sides of the table, and another two photo studio lights (studio barn door light head with JDD light bulb, 120 V, 150 W) were placed closer to the fabric samples on each side of the display table. The photographs were white-balanced with a common white point defined by a photograph of a Macbeth color checker in the same lighting environment. The camera was a Canon EOS Rebel T3i with EF 24-105 mm f/4L IS USM lens.
Apparatus and procedure
The procedure for Experiment 2 was exactly the same as Experiment 1 except that the number of trials was 65 instead of 60. Following the main experiment, the observer participated in another control experi-ment. The apparatus was very similar to the one used in Experiment 1.
In the control experiment, each participant did the tactile matching task on all four conditions: 3D_RGB, 3D_Grayscale, 2D_RGB, 2D_Grayscale. There were, in total, three pairs, one each of low, medium, and high difficulty, to match in each condition. The mean dissimilarity rating was 1.5 (SD¼ 0.12) for low-difficulty pairs, 4.4 (SD¼ 0.00) for the medium-difficulty pairs, and 7.8 (SD¼ 0.00) for the high-difficulty pairs. We used separate blocks to measure matching for different folding conditions. Half of the observers in each main experimental group finished the 2-D conditions first followed by the 3-D
condi-tions. The other half finished the control experiment in the reversed order, i.e., first finished the 3-D condi-tions followed by the 2-D condicondi-tions. Sequences of trials within each block were randomized for each observer.
Results
Table 1 (lower panel) summarizes the mean accuracy for all conditions. Overall, this experiment yielded higher accuracy (85%) than Experiment 1, but the patterns of the result were very similar. Figure 5C shows the mean matching accuracy across all ob-servers for the two folding conditions for both RGB and grayscale conditions. The results were very similar to those in Experiment 1 (Figure 5B). The effect of color was significant on the matching accuracy, revealed by the difference between the dark blue and light blue bars. We also observed a
significant effect of folding shape on matching accuracy for the RGB conditions. Within the gray-scale conditions, folding shape had no significant effects on matching accuracy.
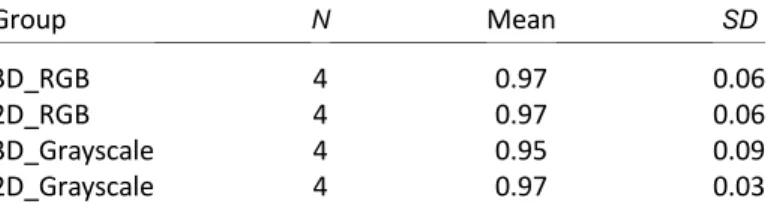
The results of the control experiment showed no statistically significant differences of matching accuracy between the four groups, F(3, 33)¼ 1.42, p ¼ 0.25, g2
p¼
.12 (see Table 3).
Effects of color and folding on all fabric pairs Similar to Experiment 1, we used a two-way repeated-measures ANOVA to test the effects of color (RGB, gray scale) and folding (draping, flat) on the matching data. The result is summarized in Table 2 (lower panel). The statistics revealed a main effect of color: The RGB condition achieved higher accuracy than the grayscale condition (0.87 vs. 0.82), F(l, 64)¼ 4.68, p , 0.05, g2
p¼ .07. A marginal main effect of the
folding conditions was also observed, indicating that the 3D_Draping conditions had higher matching accuracy than the 2D_Flat conditions (0.87 vs. 0.82), F(l, 64)¼ 3.21, p ¼ 0.08, g2
p¼ .05. No interaction effect
was found ( p . 0.10). Further analysis of simple main effects suggested that under the 3D_Draping condi-tion, performance in the RGB conditions was better than in the grayscale conditions (0.89 vs. 0.83), F(l, 64) ¼ 4.76, p , 0.05, g2
p¼ .07. No such difference was
found under the 2D_Flat condition ( p . 0.10). Likewise, performance in the 3D_Draping condition was significantly better than in the 2D_Flat condition for the RGB condition (0.89 vs. 0.85), F(l, 64)¼ 5.99, p ,0.05, g2
p¼ .08, but not for the grayscale condition ( p
.0.10). No other significant effects were found ( ps . 0.10). Group N Mean SD 3D_RGB 4 0.97 0.06 2D_RGB 4 0.97 0.06 3D_Grayscale 4 0.95 0.09 2D_Grayscale 4 0.97 0.03
Table 3. Tactile and visual matching mean accuracy of control experiments in each condition group.
Effects of color and folding on different types of fabric pairs
During data collection, we observed the color and folding effects might be unevenly distributed among fabric pairs. Thus, we did a breakdown analysis of how the matching accuracy of different types of fabric pairs was affected by color and folding information.
We used the multidimensional scaling (MDS) method to analyze the tactile similarity rating experi-mental results we obtained in the pilot experiment (see fabric selection and pilot study in Experiment 2). Figure 7 shows the 2-D MDS solution for the 15 fabrics. The 2-D embedding suggested that the stimuli were grouped into two categories. By overlaying the stimuli images onto the 2-D embedding, we discovered that the matte stimuli were clustered together on the left, and the shiny stimuli were clustered on the right. Therefore, we could divide the fabric pairs used in this experiment into three categories: glossy–glossy (two glossy fabrics), matte–matte (two matte fabrics), and glossy–matte (one glossy fabric and one matte fabric).
One-way ANOVA with categories as the indepen-dent variable showed a significant main effect, F(2, 62) ¼ 7.24, p , 0.01, g2
p¼ .10. The post hoc Tukey test
found that matching accuracy of glossy–matte pairs was higher than matte–matte pairs ( p , 0.05), which was also higher than glossy–glossy pairs ( p , 0.05). This suggests that when the tactile properties of the two fabrics were very different, color and folding informa-tion were less influential in the visual–tactile matching task.
We further performed a 2 (color: RGB, gray scale) 3 2 (folding: 2-D, 3-D) ANOVA with repeated measures for the three categories. Figure 8 shows that for both color and folding conditions, there were little effects on glossy–matte fabric pairs (Fs , 1). Figure 8A shows that folding had a significant effect only when both fabrics were glossy, F(1, 62)¼ 12.02, p , 0.001, g2
p¼ .17.
But the effect was not significant when both fabrics were matte ( p . 0.10). In contrast, Figure 8B shows that color had significant effects on matte–matte pairs, F(1, 62)¼ 6.78, p ¼ 0.01, g2
p¼ .10, as well as glossy–
glossy pairs, F(1, 62)¼ 3.97, p ¼ 0.05, g2 p¼ .05.
In conclusion, Experiment 2 repeated the results in Experiment 1 even though we used a new set of fabric stimuli and selected the fabric pairs based on a tactile similarity experiment. We also verified that the differ-ence between the groups of observers contributed little to the matching results. More interestingly, we found that color and folding had uneven influences on different types of fabric pairs. Specifically, color had significant effects on both matte–matte pairs and glossy–glossy pairs, and folding information only influenced the matching accuracy of glossy–glossy pairs.
Discussion
The current study was inspired by the observation that humans were good at predicting how objects would feel just by looking (such as judging clothing Figure 7. The 2-D perceptual space of the 15 fabrics in Experiment 2. They are positioned in the 2-D space according to the pair-dissimilarity rating. Two distinct categories of fabrics are seen: matte fabrics and glossy fabrics.
properties during online shopping). Of particular interest is the question of what visual information affects the prediction of tactile properties of objects. Previous work in multisensory material perception primarily measured perception separately for each sensory modality using verbal report to describe material attributes. Here, we used the tactile sensation as ground truth to evaluate the visual perception of the fabric materials by manipulating the photographic conditions of the fabrics.
In both Experiments 1 and 2, we found that observers matched their tactile perception of the materials to visual perception of the materials with lower accuracy if the color information was removed from the images. Furthermore, we discovered that removing color information significantly worsened the matching accuracy of the results that involved the 3D_Folding conditions but not the 2D_Flat conditions. In addition, we observed that images containing fabrics with 3-D folding information significantly improved the matching accuracy if the color information was also preserved. When the color information was removed, the matching accuracy was no longer affected by the folding conditions. Although the same results were obtained using different sets of fabrics and observers, the within-subject control experiment didn’t replicate the main findings of Experiments 1 and 2 (Table 3). We think that this might be due to (a) the reduced set of stimuli—there were only three matching pairs in each of the four conditions—and (b) carryover and ceiling effects: The control experiment was conducted after the main experiment, and observers might have developed an efficient strategy to do this task. The high mean accuracy of the four conditions (all above 95%) confirmed this possibility, indicating that it is the
ceiling effect that makes the differences between the four conditions seems to disappear.
Effect of color
Interestingly, both Experiments 1 and 2 found that removing color significantly decreased accuracy for the 3-D folding conditions but had little effect on the 2-D conditions (Figure 5). It is possible that in the 2D_Flat conditions, observers mainly relied on texture infor-mation to visually distinguish the fabrics so that color information became irrelevant. In the 3-D folding conditions, by contrast, the texture information was less dominant (due to lower spatial resolution of the 3D_Draping images in comparison to 2D_Flat images) so that color played a significant role. Under this hypothesis, we would expect that color had stronger effects on the fabric pairs that were similar in textures but different in mechanical aspects (e.g., two satins that are different in stiffness). Figure 8B confirmed this hypothesis by showing that color has significant effects when both of the fabrics are within the same categories, such as when both fabrics are shiny (glossy–glossy) and when they are both matte (matte–matte).
Our first question is which are the fabric pairs that resulted in the biggest effects of color on the matching accuracy? Figure 9shows examples of stimuli pairs that achieved large errors in grayscale images but small errors in RGB images. We see that color improves performance when both fabrics are shiny but with different degrees of shininess. For example, fabric pair 12 showed two pieces of shiny fabric, a ripstop and a satin, that had no error in the RGB conditions but two
Figure 8. Effects of color and folding conditions across different fabric categories. (A) Effects of color conditions across three fabric categories. Matte-matte indicates the two matching fabrics both belong to the matte category, glossy-glossy indicates the two matching fabrics both belong to the glossy category, and glossy-matte indicates one fabric belongs to the glossy category and the other belongs to the matte category. (B) Effects of folding conditions across three fabric categories. *p, 0.05, ***p, 0.001.
error counts in the grayscale conditions. This is possible because specular highlights on the folded surface might be easier to detect and separate from the diffuse reflectance in the RGB images than in the grayscale images. More importantly, specular highlights inform the geometry of the folded fabric sample, hence indirectly affecting its display of mechanical properties, such as stiffness. The effects of color on perception of surface gloss has been discussed in several articles, but systematic research is needed (Chadwick & Kentridge, 2015; Hanada, 2012; Leloup, Pointer, Dutr´e, & Hanselaer, 2012; Nishida, Motoyoshi, & Maruya, 2011).
Even when the fabrics do not have apparent specular highlights, chromaticity variation within the surface caused by mutual reflections within the folds can also provide cues to surface properties. For example, fabric pair 17 in Figure 9is two pieces of corduroy and linen. Corduroy has tiny fibers that have distinctive reflective properties (there are strong color gradients from shaded areas to bright areas), but this information is reduced when color information is removed. One possibility is that the inter-reflectance between the folds in the color images could be characteristic of material properties and thus provide information about the
lighting geometry (Fleming, Holtmann-Rice, & Bulth-off, 2011; Harding, Harris, & Bloj, 2012; Ruppertsberg, Bloj, & Hurlbert, 2008). To further understand the effects of color on the perception of complex materials, one can use computer-rendered stimuli to systemati-cally measure material perception by isolating surface reflection, textures, and lighting parameters.
Color information can also indicate high-level representation of material categories. For example, on average, upholstery fabrics tend to have darker color than jersey shirts. If this was the only information that was removed when we used the grayscale images, we would expect the accuracy for the 2D_Flat conditions to also decrease. But the data shows removing color has little effect on the 2D_Flat conditions. Giesel and Zaidi (2013) found no effect of color on the material
classification of images of fabrics. It is possible the stimuli used in their study resembled our stimuli in the 2D_Flat images, in which the fabrics were flat in the image and have few wrinkles and folds. However, we cannot rule out the possible role of high-level color association in the tactile–visual matching task, which is suggested by previous research (Maloney & Brainard, 2010; Olkkonen, Hansen, & Gegenfurtner, 2008).
Effect of the 3-D folds
Our study found that folding condition affects matching accuracy for RGB image conditions. We also found that folding had significant effects on the fabric pairs when both were shiny, and this effect was independent of color condition (Figure 8). The explanation could be that 3-D drape improved the impression of glossiness. Surface glossiness is related to surface smoothness, which is a tactile property. Hence, being able to perceive glossiness leads the observers to feel the smoothness of the fabric. Figure 9 shows examples of fabric pairs that achieved large errors in the 2D_Flat conditions but small errors in the 3D_Folding conditions. Several examples were com-posed of two glossy samples. For example, fabric pair 11 in Figure 10 was composed of a red ripstop nylon and yellow satin. The satin fabric is much shinier than the ripstop fabric. But this difference is difficult to see in the flat conditions in which there were no specular highlights. Previous findings showed that the visual system used shading cues to estimate reflective prop-erties of the surface and materials, and 3-D shape influenced material perception (Giesel & Zaidi, 2013; Ho, Landy, & Maloney, 2008; Kerrigan & Adams, 2013; Kim, Marlow, & Anderson, 2011, 2012; Marlow, Kim, & Anderson, 2011; Motoyoshi, 2010; Radonjic & Gilchrist, 2013; Vangorp, Laurijssen, & Dutr´e, 2007; Wijntjes, Doerschner, Kucukoglu, & Pont, 2012). A recent study also shows that presence of specular
Figure 9. Comparison of errors of RGB and grayscale conditions in Experiment 2.
highlights also increased perceived surface convexity (Adams & Elder, 2014). It is possible that the presence of specular highlights helps recovering the 3-D shape of the fabrics, hence improving material understanding of the mechanical properties, such as softness and rigidity, of the fabrics.
However, the folding condition also affects fabrics that are not glossy, which was revealed by individual examples shown in Figure 10. When two pieces of fabric are similar in their textures, visible draping folds help to infer the difference in mechanical properties, such as stiffness. The effect also goes beyond glossy fabrics. The fabric pair 9 in Figure 10 was two pieces of linen that have different stiffness. The shape of the draping folds revealed that the blue linen was a little stiffer than the gray linen. This effect was difficult to infer in the 2-D flat conditions.
We also discovered that there was an interaction between the effects of color and folding conditions. In the grayscale conditions, the effects of folding on matching accuracy became small. During the visual– tactile matching experiment, multiple cues were present for the observer to use, such as chromatic gradients, specular highlights, contrast between bright and shadow part, and 3-D textures. It was possible that
observers weighted these cues differently for different stimuli. When the image was in color, chromaticity gradients and specular highlights might be as important as texture information. However, when color informa-tion was removed, observers might choose to only focus on texture information, ignoring the shape-related intensity gradients. This could be the reason why in grayscale images the matching accuracy of 3-D and 2-D conditions were similar. In the future, it would be interesting to isolate these cues and construct a cue-combination model on visual and tactile matching.
Role of 3-D textures
We discovered that both effects of color and folding condition have strong effects on fabric pairs that are similar in texture, such as both being shiny and smooth (Figures 9 and 10). When two fabrics are in different categories (glossy and matte), 3-D texture cues (not only the patterns of the fabrics but also the thread counts, woven patterns, surface relief, etc.) are very important for discrimination of fabrics independent of folding conditions. In our fabric samples, there were many fabric pairs with different 3-D textures, such as corduroy and linen. Observers could use 3-D textures to predict roughness, friction, and undulation of the fabrics. This information was also present in the 2D_Flat conditions. This could also explain why the matching accuracy was high in the current study (around 75% on average for both Experiments 1 and 2). This is consistent with the findings of Giesel and Zaidi (2013), which showed that the visual system could use the 2-D luminance variations that arise from the 3-D textures of the materials to perceive fabric attributes, such as thickness, undulation, and roughness.
Effect of lighting
In this study, we kept the lighting conditions constant across the folding conditions. However, we recognize the potential effect of lighting geometry on the results. It has recently been shown that for image-based illumination (Debevec & Malik, 1997) the geometry of the light field determines the level of perceived gloss (Doerschner, Boyaci, & Maloney, 2010; Olkkonen & Brainard, 2010). The direction of lighting also affects perception of material properties. It has been shown that direction of lighting affects perception of surface roughness (Ho, Serwe, Trommersh¨auser, Maloney, & Landy, 2009) and translucency (Xiao et al., 2014). It was also shown that the discrimination of 3-D shape is improved when specular highlights are present (Norman, Todd, & Orban, 2004). Even though we do not suspect the primary result of the effect of color and
Figure 10. Comparison of errors of 3-D and 2-D conditions in Experiment 2.
shape would change if we varied the lighting geometry, it is possible that changing lighting geometry would have a similar effect as including 3-D shading cues for visual and tactile matching. Searching for an optimal lighting geometry to improve prediction of tactile properties of materials would be a valuable next step.
The role of tactile exploratory procedure
The current study focused on the effect of visual stimuli on tactile and visual matching. We have not restricted the exploration mode of tactile perception in this study. But in the postexperiment survey we conducted, all observers reported they used one hand for each of the fabrics to feel the fabrics. They also reported using hand movements such as ‘‘scratching,’’ ‘‘rubbing,’’ and ‘‘lifting up’’ as their tactile strategy. In Experiment 2, we required observers to write down which of these three strategies they used to match each pair. Overall, mean percentage of using scratching was 25.7%, rubbing was 88.8%, and lifting up was 21.2% across all conditions. More interestingly, we found that use of a tactile exploratory procedure interacted with color conditions. Removing color information signifi-cantly increased the use of lifting up, F(1, 64)¼ 24.13, p ¼ 0.000, g2
p¼ .17, and scratching, F(1, 64) ¼ 4.24, p ,
0.05, g2
p¼ .06, and had no influence on the use of
rubbing, F(1, 64)¼ 0.91, p . 0.10, g2 p¼ .01.
Seminal work by Lederman and Klatzky (1987) showed that human observers are very good at using optimal exploratory procedures (such as lateral motion, contour following, etc.) to acquire different knowledge of objects. Recent studies also show that visual
perception of material properties affects planning of lifting and grasping movements of hands (Buckingham et al., 2009). It would be interesting to explore the relationship between visual information and tactile exploration mode in future studies.
Conclusions
The central question in this article concerns how visual information of a soft, deformable object (such as its color, folds, and textures) affects prediction and judgment of its tactile properties. Empirical observa-tions show that people are good at predicting object tactile properties. Using a natural tactile–visual matching task, we found that images of draped fabrics that reveal 3-D shape information allowed for better matching accuracy than images only containing flat-tened fabrics, which reveal mainly textural information. We also found that color played an important role in predicting tactile properties from images in the 3-D
conditions. This suggests that color might be an important visual cue for material perception possibly through interaction with 3-D shape. By analyzing the effects on different categories of fabric, we found that the effects of color and folding condition were both stronger when fabrics were similar in 3-D textures, especially when both fabrics were glossy.
In conclusion, different images of the same object can influence tactile prediction of the object’s material properties. Three-dimensional shape features, such as wrinkles and folds and color gradients across the surface as well as 3-D textures provide useful infor-mation to predict tactile and mechanical properties of soft, deformable objects from images.
Keywords: material perception, 3-D shape, tactile, color, multisensory perception
Acknowledgments
The authors wish to thank Dr. Hendrkje Nienborg for valuable feedback on the manuscript and the data analysis and Dr. Ruth Rosenholz for very useful discussions for data analysis. We also wish to thank undergraduate students Alex Perepechko and Laura Uribe Tuiran at American University for preparing the stimuli. The work was partially supported by the Google Faculty Research Award to EA in 2012–2013 and the MIT I2intelligence initiative postdoctoral fellowship to BX in 2013–2014 and American Univer-sity faculty startup funding (Experiment 2).
* WB and XJ contributed equally to this article. Commercial relationships: none.
Corresponding author: Bei Xiao. Email: bxiao@american.edu.
Address: Department of Computer Science, American University, Washington, DC, USA.
References
Adams, W. J., & Elder, J. H. (2014). Effects of specular highlights on perceived surface convexity. PLoS Computational Biology, 10(5), e1003576.
Adelson, E. H. (2001). On seeing stuff: The perception of materials by humans and machines. In Photonics West 2001-electronic Imaging(pp. 1–12). San Francisco, CA: International Society for Optics and Photonics.
Anderson, B. L., & Kim, J. (2009). Image statistics do not explain the perception of gloss and lightness.
Journal of Vision, 9(11):10, 1–17, doi:10.1167/9.11. 10. [PubMed] [Article]
Baumgartner, E., Wiebel, C. B., & Gegenfurtner, K. R. (2013). Visual and haptic representations of mate-rial properties. Multisensory Research, 26(5), 429– 455.
Bhushan, N., Rao, A. R., & Lohse, G. L. (1997). The texture lexicon: Understanding the categorization of visual texture terms and their relationship to texture images. Cognitive Science, 21(2), 219–246. Bonneel, N., Suied, C., Viaud-Delmon, I., & Drettakis,
G. (2010). Bimodal perception of audio-visual material properties for virtual environments. ACM Transactions on Applied Perception (TAP), 7(1), 1. Buckingham, G., Cant, J. S., & Goodale, M. A. (2009).
Living in a material world: How visual cues to material properties affect the way that we lift objects and perceive their weight. Journal of Neurophysiology, 102(6), 3111–3118.
Chadwick, A. C., & Kentridge, R. W. (2015). The perception of gloss: A review. Vision Research, 109, 221–235.
Debevec, P. E., & Malik, J. (2008, August). Recovering high dynamic range radiance maps from photo-graphs. In ACM SIGGRAPH 2008 classes (p. 31). New York: ACM.
Doerschner, K., Boyaci, H., & Maloney, L. T. (2010). Estimating the glossiness transfer function induced by illumination change and testing its transitivity. Journal of Vision, 10(4):8, 1–9, doi:10.1167/10.4.8. [PubMed] [Article]
Fleming, R. W. (2014). Visual perception of materials and their properties. Vision Research, 94, 62–75. Fleming, R. W., Holtmann-Rice, D., & Bulthoff, H. H.
(2011). Estimation of 3D shape from image orientations. Proceedings of the National Academy of Sciences, USA, 108(51), 20438–20443.
Fleming, R. W., Wiebel, C., & Gegenfurtner, K. (2013). Perceptual qualities and material classes. Journal of Vision, 13(8):9, 1–20, doi:10.1167/13.8.9. [PubMed] [Article]
Fujisaki, W., Goda, N., Motoyoshi, I., Komatsu, H., & Nishida, S. (2014). Audiovisual integration in the human perception of materials. Journal of Vision, 14(4):12, 1–20, doi:10.1167/14.4.12. [PubMed] [Article]
Fujisaki, W., Tokita, M., & Kariya, K. (2015).
Perception of the material properties of wood based on vision, audition, and touch. Vision Research, 109, 185–200.
Giesel, M., & Zaidi, Q. (2013). Frequency-based heuristics for material perception. Journal of Vision,
13(14):7, 1–19, doi:10.1167/13.14.7. [PubMed] [Article]
Hanada, M. (2012). Difference between highlight and object colors enhances glossiness. Perceptual and Motor Skills, 114, 3.
Harding, G., Harris, J. M., & Bloj, M. (2012). Learning to use illumination gradients as an unambiguous cue to three dimensional shape. PLoS One, 7(4), e35950.
Ho, Y. X., Landy, M. S., & Maloney, L. T. (2008). Conjoint measurement of gloss and surface texture. Psychological Science, 19(2), 196–204.
Ho, Y. X., Serwe, S., Trommersh¨auser, J., Maloney, L. T., & Landy, M. S. (2009). The role of visuohaptic experience in visually perceived depth. Journal of Neurophysiology, 101(6), 2789–2801.
Hollins, M., Bensma¨ıa, S., Karlof, K., & Young, F. (2000). Individual differences in perceptual space for tactile textures: Evidence from multidimen-sional scaling. Perception & Psychophysics, 62(8), 1534–1544.
Kanan, C., & Cottrell, G. W. (2012). Color-to-grayscale: Does the method matter in image recognition. PloS One, 7(1), e29740.
Kawabe, T., Maruya, K., Fleming, R. W., & Nishida, S. (2015). Seeing liquids from visual motion. Vision Research, 109, 125–138.
Kerrigan, I. S., & Adams, W. J. (2013). Highlights, disparity, and perceived gloss with convex and concave surfaces. Journal of Vision, 13(1):9, 1–10, doi:10.1167/13.1.9. [PubMed] [Article]
Kim, J., Marlow, P., & Anderson, B. L. (2011). The perception of gloss depends on highlight congru-ence with surface shading. Journal of Vision, 11(9): 16, 1–12, doi:10.1167/11.9.16. [PubMed] [Article]
Kim, J., Marlow, P. J., & Anderson, B. L. (2012). The dark side of gloss. Nature Neuroscience, 15(11), 1590–1595.
Klatzky, R. L., & Lederman, S. J. (2010). Multisensory texture perception. In M. N. Johannes & J. Kaiser (Eds.), Multisensory object perception in the primate brain (pp. 211–230). New York: Springer.
Lederman, S. J., & Klatzky, R. L. (1987). Hand movements: A window into haptic object recogni-tion. Cognitive Psychology, 19(3), 342–368.
Lederman, S. J., & Klatzky, R. L. (1993). Extracting object properties through haptic exploration. Acta Psychologica, 84(1), 29–40.
Lederman, S. J., & Klatzky, R. L. (2009). Haptic perception: A tutorial. Attention, Perception, & Psychophysics, 71(7), 1439–1459.
P. (2012). Overall gloss evaluation in the presence of multiple cues to surface glossiness. Journal of the Optical Society of America A: Optics, Image Science, and Vision, 29(6), 1105–1114.
Maloney, L. T., & Brainard, D. H. (2010). Color and material perception: Achievements and challenges. Journal of Vision, 10(9):19, 1–6, doi:10.1167/10.9. 19. [PubMed] [Article]
Marlow, P., Kim, J., & Anderson, B. L. (2011). The role of brightness and orientation congruence in the perception of surface gloss. Journal of Vision, 11(9): 16, 1–12, doi:10.1167/11.9.16. [PubMed] [Article]
Mart´ın, R., Iseringhausen, J., Weinmann, M., & Hullin, M. B. (2015). Multimodal perception of material properties. In S. Spencer (Ed.), Proceed-ings of the ACM SIGGRAPH symposium on applied perception (pp. 33–40). Toulouse, France: ACM. Motoyoshi, I. (2010). Highlight-shading relationship as
a cue for the perception of translucent and
transparent materials. Journal of Vision, 10(9):6, 1– 11, doi:10.1167/10.9.6. [PubMed] [Article]
Nishida, S., Motoyoshi, I., & Maruya, K. (2011). Luminance-color interactions in surface gloss perception. Journal of Vision, 11(9):4, 1–19, doi:10. 1167/11.9.4. [PubMed] [Article]
Norman, J. F., Todd, J. T., & Orban, G. A. (2004). Perception of three-dimensional shape from spec-ular highlights, deformations of shading, and other types of visual information. Psychological Science, 15(8), 565–570.
Olkkonen, M., & Brainard, D. H. (2010). Perceived glossiness and lightness under real-world illumina-tion. Journal of Vision, 10(9):5, 1–19, doi:10.1167/ 10.9.5. [PubMed] [Article]
Olkkonen, M., Hansen, T., & Gegenfurtner, K. R. (2008). Color appearance of familiar objects: Effects of object shape, texture, and illumination changes. Journal of Vision, 8(5):13, 1–16, doi:10. 1167/8.5.13. [PubMed] [Article]
Plaisier, M. A., Kappers, A. M. L., Tiest, W. M. B., &
Ernst, M. O. (2010). Visually guided haptic search. Haptics, IEEE Transactions on, 3(1), 63–72. Radonjic, A., & Gilchrist, A. L. (2013). Depth effect on
lightness revisited: The role of articulation, prox-imity and fields of illumination. i-Perception, 4(6), 437.
Rao, A. R., & Lohse, G. L. (1993, August). Towards a texture naming system: Identifying relevant di-mensions of texture. In Visualization, 1993, Visu-alization ’93, Proceedings, IEEE Conference (pp. 220–227). San Jose, CA: IEEE.
Ruppertsberg, A. I., Bloj, M., & Hurlbert, A. (2008). Sensitivity to luminance and chromaticity gradients in a complex scene. Journal of Vision, 8(9):3, 1–16, doi:10.1167/8.9.3. [PubMed] [Article]
Sharan, L., Rosenholtz, R., & Adelson, E. H. (2014). Accuracy and speed of material categorization in real-world images. Journal of Vision, 14(9):12, 1–14, doi:10.1167/14.9.12. [PubMed] [Article]
Tiest, W. M. B. (2010). Tactual perception of material properties. Vision Research, 50(24), 2775–2782. Tiest, W. M. B., & Kappers, A. M. L. (2007). Haptic
and visual perception of roughness. Acta Psycho-logica, 124(2), 177–189.
Vangorp, P., Laurijssen, J., & Dutr´e, P. (2007). The influence of shape on the perception of material reflectance. ACM Transactions on Graphics (TOG), 26(3), 77.
Wijntjes, M. W., Doerschner, K., Kucukoglu, G., & Pont, S. C. (2012). Relative flattening between velvet and matte 3D shapes: Evidence for similar shape-from-shading computations. Journal of Vi-sion, 12(1):2, 1–11, doi:10.1167/12.1.2. [PubMed] [Article]
Xiao, B., Walter, B., Gkioulekas, I., Zickler, T., Adelson, E., & Bala, K. (2014). Looking against the light: How perception of translucency depends on lighting direction. Journal of Vision, 14(3):17, 1–22, doi:10.1167/14.3.17. [PubMed] [Article]