CELL AND EQUIPMENT DESIGN IN THE AUTOMOTIVE COMPONENTS INDUSTRY
by
WAI LEUNG Low
B.S., Mechanical Engineering, 1998 Mississippi State University
Submitted to the Department of Mechanical Engineering in Partial Fulfillment of the Requirements for the Degree of
Master of Science in Mechanical Engineering at the
Massachusetts Institute of Technology June 2001
C 2001 Massachusetts Institute of Technology All rights reserved
BARKER MASSACHUSETTS INSTITUTE OF TECHNOLOGY
JUL 16 Z001
LIBRARIES A u th or ...Department of Mechanical Engineering May 5, 2001
Certified by ... ...
David S. Cochran Associate Professor of Mechanical Engineering -Thesis Supervisor
A ccepted by ...
Ain A. Sonin Chairman, Department Committee on Graduate Students
CELL AND EQUIPMENT DESIGN IN THE AUTOMOTIVE COMPONENTS INDUSTRY
by
WAI LEUNG Low
Submitted to the Department of Mechanical Engineering on May 5, 2001 in partial fulfillment of the requirement for the degree of Master of Science in Mechanical Engineering
ABSTRACT
In order to face the challenge of modem manufacturing, successful companies need to be responsive to customer's needs by reducing cost, improving quality, and shrinking lead times. To achieve these objectives, a manufacturing system must be designed to operate in a broader, more holistic context. The Manufacturing System Design Decomposition (MSDD) developed by the Production System Design Laboratory at MIT was created to meet the high-level strategic objectives of an enterprise. The design of a manufacturing system can be complicated and convoluted without a guideline to follow. The MSDD provides the designer an understanding of the interrelationships between different function requirements (FRs) and design parameters (DPs) and their impact on each other. Because of the underlying foundation that the MSDD was based on, it optimizes overall system performance rather than local sub-optimization.
This thesis will show through a scientific approach with logical steps how to design and successfully link the strategic and organization goals of a manufacturing system to low-level decisions on equipment and cell design. The motivation of the thesis comes from a strong belief that there is a gap between management and designers when converting the corporate mission statement(s) into something that is real, tangible and properly measured on the factory floor. Through the implementation of the MSDD methodology in an automotive components manufacturing plant, this thesis will attempt to illustrate that one can achieve the same manufacturing excellence as witnessed in the Japanese automotive industry over the last two decades.
Thesis Supervisor: David. S. Cochran
Cell and Equipment Design in the Automotive Components Industry
Acknowledgements
Not so long ago, I arrived at MIT in excitement and awe of a prestigious institution at which I would have the honor of working with a plethora of peers more intelligent than myself and learn from professors who are at the cutting edge of their fields. Looking back, I remember not only the research I have done here, but also all the learning, mistakes, long nights and friendships. There are a large number of people that I would like to thank for their contributions not only for the completion of this thesis but also for supporting me to pursue my goals and dreams. In the process of my interactions with them, knowingly and unknowingly, they have each taught me how to live a meaningful life and be a better person.
Firstly, the most important of all, I would like to thank Professor David S. Cochran for giving me the opportunity to be part of the Production System Design Laboratory at MIT. It has been very rewarding to work under a world-renowned expert in manufacturing system design. His guidance and support contributed much to my academic and industrial experience both at MIT and at Visteon. This thesis would not be possible without his patience and trust which gave me the moral boost I need to finish on time. My thanks also go to Visteon for sponsoring my project. During my assignment at Visteon, I have received much support and friendship from many people, but especially from Greg Nycholas, Mark Wilkins, and Tony Scargall. I would also like to thank the people I have worked with previously at MIT, Professor Chun, Dr. Matsuyama, Dr. Marty Culpepper, Amy Smith, Peter Jenkins, Yinlin Xie, Marc and Gerry.
Secondly, I would like to acknowledge my family, the core of supportive people that have always been there for me over the last twenty-four years. The everlasting and unconditional love that you have provided has given me strength to endure the obstacles I have encountered. To my Dad, who oversaw my academic career from elementary school to MIT. Without his quick control, love and wit over a rebellious kid like me, I would probably not have made it so far. To my Mom, who taught me what real love is when I witness her crying for me. Last, but not least, my younger sister, who never fails to warm my heart with her natural kind and adorable look.
Cell and Equipment Design in the Automotive Components Industry
Thirdly, I would also like to thank all the lab members for putting up with me and providing me with valuable advice on survival and research: Abhinav, Cesar, Jey, Jochen, Jongyoon, Jose, Kola, Memo, Quinton, Salim, Steve, Yongsuk, Zhenwei, and especially Carlos with whom I spent many days in the factory we both know so well, and Jim provided a lot of help when I first joined the lab. My words of appreciation also go to Pat Smethurst for her kindness in so many things.
Fourthly, I want to thank all the friends that I have made throughout my life. Thank you all for teaching me to treat people with respect. Each of you have a special place in my heart (in approximate chronological order): [St. Hilda's and VJC] Jeannette Lim, Kevin Jian, Rene Yeo, Dingjun, Huili, Huiling, and Chuanyi; [MSU] Huy Nguyen, Vera Djohan, Rebecca Lum, Ji Young, Jacob Garbin, Tommy Thomson, Ting Hooi, Randy Phillips, Daniel Honeycutt, and Will Williams; [MIT] Tang Yew, Dai Suzuki, Victor Valentin, Mike Neely, Leslie Loo, Chris Tan, Tuck Meng, Leo Sen, Ernie Yeh, Tommy Chao, Martin Kosto, Yai, Tommy Ng, Meow Seen, Andy Wang, Anne, Kevin Chen, Holden, Samuel Au, Phil Balucan, Steve Wang, Matt Lim, and Irina; [GSC] Soulaymane, Kevin Davis, Julie Eisenhard, Sanith, Terrence Fan, Sumit, Dilan, Bo Chen, Ying Li, and Steven Sun.
Lastly, throughout my years of sojourning at MIT, not only have I matured in my approach to developing friendships and relationships, but also I have strengthened my faith in my Lord and Savior Jesus Christ, which I value deeply in my heart. In these years, I did not have a doubt that the giver of life is God. I want to acknowledge Him for being there with me every step of the way.
Thank you all for your friendship and support. There is nothing in the world that could express my feelings. Xie Xie Ni!
Table of Contents ABSTRACT... 3 ACKNOWLEDGEMENTS ... 5 TABLE OF CONTENTS ... 7 LIST OF FIGURES... 11 LIST OF TABLES... 15 CHAPTER 1: INTRODUCTION... 17 1.1 T HESIS O BJECTIVES ... 17 1.2 T HESIS O UTLIN E ... 18
CHAPTER 2: HISTORY AND TYPES OF MANUFACTURING SYSTEMS...19
2.1 HISTORY AND EVOLUTION OF MANUFACTURING SYSTEMS ... 19
2.1.1 The Japanese Vision of Manufacturing ... 23
2.1.2 Manufacturing in the United States ... 24
2.1.3 What About Europe?... 26
2.2 IMPORTANCE OF MANUFACTURING AS COMPETITIVE ADVANTAGE ... 27
2.2.1 Definition of the Manufacturing System ... 29
2.2.2 Types of Manufacturing Systems ... 33
2.2.2.1 Job Shop ... 34
2.2.2.2 Transfer Lines ... 34
2.2.2.3 Continuous Flows ... 34
2.2.2.4 Linked-Cell System ... 34
CHAPTER 3: THE PRODUCTION SYSTEM DESIGN FRAMEWORK ... 37
3.1 INTRODUCTION TO AXIOMATIC DESIGN... 37
3.1.1 Mapping
from
Functional Requirements to Design Parameters... 37Cell and Equipment Design in the Automotive Components Industry
3.1.3 Independence Axiom and Information Axiom... 39
3.1.4 Axiomatic Design: Water Faucet Example... 40
3.2 INTRODUCTION TO THE MANUFACTURING SYSTEM DESIGN DECOMPOSITION ... 41
3.2.1 High Level Objectives of the MSDD... 42
3.2.2 Lower Level Objectives of the MSDD... 43
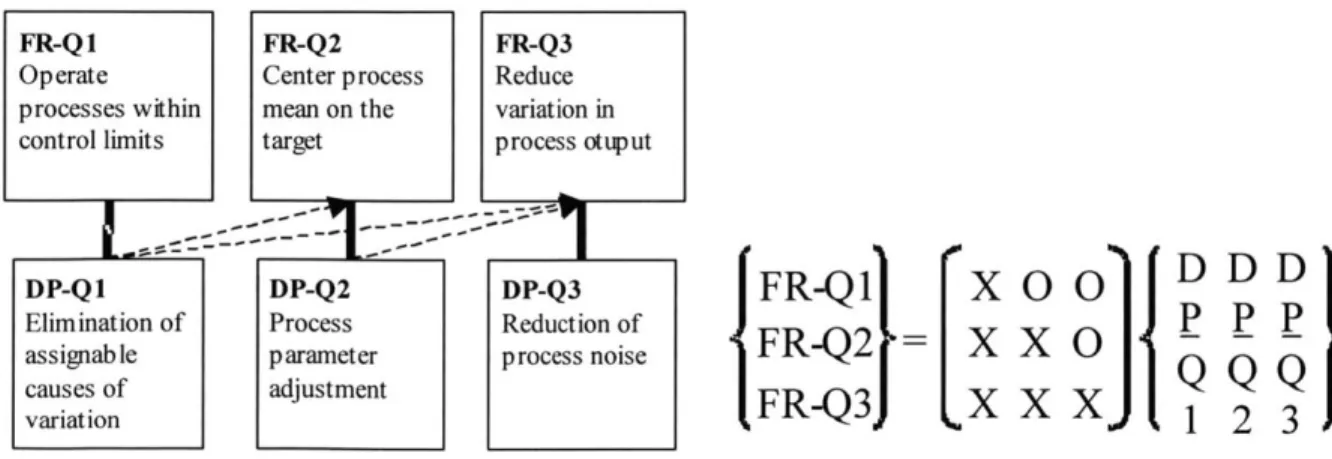
3.2.2.1 Q uality B ranch ... 44
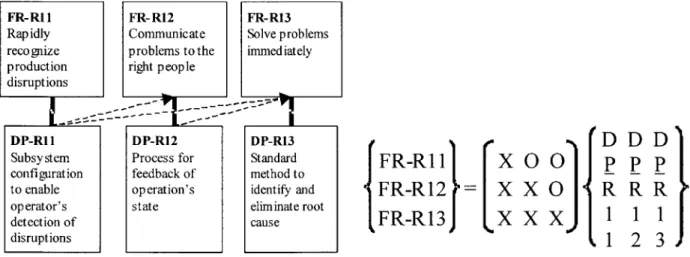
3.2.2.2 Identifying and Resolving Problems Branch ... 45
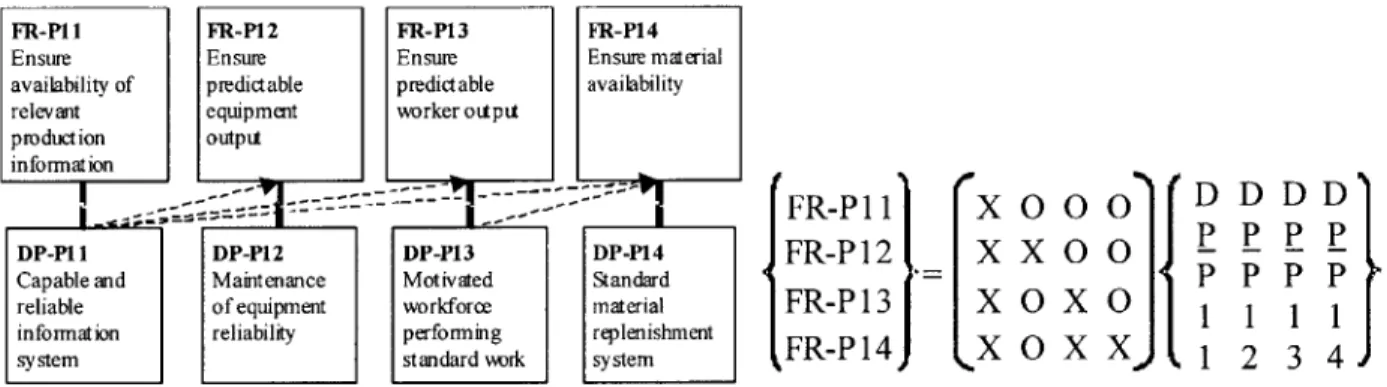
3.2.2.3 Predictable Output Branch... 45
3.2.2.4 Delay Reduction Branch... 46
3.2.2.5 Direct Labor Branch ... 47
3.2.2.6 Indirect Labor Branch... 48
3.3 BUILDING THE PRODUCTION SYSTEM DESIGN FRAMEWORK BASED ON THE MANUFACTURING SYSTEM DESIGN DECOMPOSITION ... 49
3.3.1 Manufacturing System Design Matrix ... 51
3.3.2 Manufacturing System Design Implementation Flowchart ... 52
3.3.3 Manufacturing System Design Evaluation Tool... 53
3.3.4 Equipment Evaluation Tool... 54
3.4 SUM M ARY ... .. 56
CHAPTER 4: CELL DESIGN ... 57
4.1 B A CKGROUN D ... 57
4.2 MOTIVATION FOR CELL DESIGN ... 59
4.2.1 Demand Uncertainty and Volume Flexibility ... 59
4.2.2 Balancing Capacity Demand and Capacity Supply... 60
4.2.3 MSDD Functional Requirement (FR) and Design Parameter (DP) ... 61
4.2.4 Why Cellular Manufacturing? ... 62
4.2.5 Tim e in M anufacturing ... 63
4.2.6 L ot S ize D elay ... . 64
4.3 CELL DESIGN USING THE MSDD ... 65
4.4 CELL IMPLEMENTATION GUIDELINE ... 66
4.4.1 Capacity planning and Focus ... 67
Table of Contents
4.4.3 Standard Work In Progress (SWIP) and WIP Between Stations... 71
4.4.4 L evel P roduction ... 72
4.4.5 Implementing Work Loops -Operators Routine, Standardize Process and B a la n ced W o rk ... 73
4.4.6 Visual Management and 5S ... 77
4.4.7 Link Cells to Assembly or Other Cells with Pull System ... 78
4.4.8 Kaizen/Continuous Improvement... 80
4.4.8.1 The Suggestion System... 80
4.4.8.2 Small-Group Activities ... 81
4.4.8.3 Policy Deployment... 81
4 .5 S U M M A R Y ... 8 1 CHAPTER 5: EQUIPMENT DESIGN... 83
5.1 B ACKGROUN D ... 83
5.2 EQUIPMENT DESIGN GUIDELINE...88
5.2.1 Machine Frontal Width... 88
5.2.2 Preventive Maintenance...88
5.2.3 Cycle Time and Changeover Time... 89
5.2.4 Material Handling ... 90
5.2.5 E rg on om ics ... . 9 1 5.2.6 Mistake Proofing/Poka-Yoke ... 93
5.3 S U M M A R Y ... 95
CHAPTER 6: CASE STUDY: VISTEON STERLING AXLE PLANT... 97
6.1 B ACKGROUN D ... 97
6.2 MATERIAL AND INFORMATION FLOW ... 99
6.2.1 Gear Business Unit ... 99
6.2.2 High-Speed Assembly Line ... 106
6.2.3 Assessment of the High-Speed Assembly using the Equipment Evaluation Tool 112 6.3 STERLING GEAR CAPACITY CELL DESIGN ... 114
Cell and Equipment Design in the Automotive Components Industry
6.3.2 Analysis of the Capacity Cell... 115
6.3.3 Equipment Design Comparison... 116
6.3.4 Lessons Learned... 119
6.4 NEW PRODUCT LAUNCH: GM T 315 RAINBOW PROGRAM... 122
6.4 .1 O verview ... 12 2 6 .4 .1.1 G ear C ells... 12 3 6.4.1.2 Differential Case Cell ... 124
6.4.1.3 Assembly Cell... 125
6.4.2 What must be improved?... 125
6.5 PREMIUM GEAR PLANT ... 127
6.5.1 B ackg ro un d ... 12 7 6 .5 .2 L ay o u t ... 12 7 6.5.3 Value Stream Map... 128
6.5.4 Analysis using the MSDD ... 129
6.6 SUMMARY... 131
CHAPTER 7: CONCLUSION... 133
REFERENCES... 135
APPENDIX A: MANUFACTURING SYSTEM DESIGN DECOMPOSITION V5.1 137 APPENDIX B: EQUIPM ENT EVALUATION TOOL... 145
List of Figures
FIGURE 2-1. THE PROGRESSION OF PRODUCT VARIETY AND PRODUCTION VOLUME OVER YEARS. [W OM ACK, 1990]... 21 FIGURE 2-2. SUMMARY OF MAIN INNOVATIONS IN THE HISTORY OF MANUFACTURING SYSTEMS,
[COCHRA N , 1994]... 22
FIGURE 2-3. US AND JAPANESE AUTOMOTIVE PRODUCTION BETWEEN 1947 AND 1989
[W OM ACK, 1990] ... 26
FIGURE 2-4. SUPPLY CHAIN MAPPING ILLUSTRATING ELEMENTS REQUIRED TO SATISFY
CUSTOMER'S NEEDS (ADAPTED FROM [FINE, 1999]). ... 27
FIGURE 2-5. THE RELATIONSHIP BETWEEN THE MANUFACTURING SYSTEM AND THE
PRODUCTION SYSTEM [COCHRAN, 1998] ... 29
FIGURE 2-6. MANUFACTURING FUNCTION POSITIONING IN THE ENTERPRISE (NIGHTINGALE,
2000) ... 30
FIGURE 2-7. LOGICAL GROUPING OF RELATIONSHIPS WITHIN THE SUBSYSTEMS OF AN
ENTERPRISE (ADAPTED FROM [MIERZEJEWSKA, 2000]) ... 32
FIGURE 2-8. MATRIX OF MANUFACTURING SYSTEMS' PROCESS STRUCTURE (ADAPTED FROM [HAYES AND W HEELWRIGHT, 1979]). ... 33
FIGURE 3-1. MAPPING FRS TO DPS IN AXIOMATIC DESIGN [COCHRAN, 1998]...37
FIGURE 3-2. DECOMPOSITION AND MAPPING PROCESS [COCHRAN ET AL, 2000]...38
FIGURE 3-3. DIFFERENCES AMONG DESIGNS USING AXIOMATIC DESIGN [COCHRAN, 1998] .40
FIGURE 3-4. WATER FAUCET EXAMPLE FOR AXIOMATIC DESIGN [COCHRAN, 1998]...41
FIGURE 3-5. MANUFACTURING SYSTEM DESIGN DECOMPOSITION [COCHRAN ET AL, 2000].. 42
FIGURE 3-6. HIGH LEVEL OBJECTIVES OF THE MSDD ... 43
FIGURE 3-7. SIX BRANCHES OF THE M SDD... 44
FIGURE 3-8. TOP LEVEL OF THE QUALITY BRANCH WITH THE DESIGN MATRIX ... 44 FIGURE 3-9. MIDDLE LEVEL OF THE IDENTIFYING AND RESOLVING PROBLEMS BRANCH WITH
THE DESIGN M ATRIX ... 45 FIGURE 3-10. MIDDLE LEVEL OF THE PREDICTABLE OUTPUT BRANCH WITH THE DESIGN
M A TR IX ... 46
Cell and Equipment Design in the Automotive Components Industry
FIGURE 3-12. TOP LEVEL OF THE DIRECT LABOR BRANCH WITH THE DESIGN MATRIX ... 48
FIGURE 3-13. TOP LEVEL OF THE INDIRECT LABOR BRANCH WITH THE DESIGN MATRIX... 49
FIGURE 3-14. PRODUCTION SYSTEM DESIGN FRAMEWORK ... 50
FIGURE 3-15. MANUFACTURING SYSTEM DESIGN MATRIX ... 51
FIGURE 3-16. MANUFACTURING SYSTEM DESIGN IMPLEMENTATION FLOWCHART ... 52
FIGURE 3-17. MANUFACTURING SYSTEM DESIGN EVALUATION TOOL [WANG, 1999] ... 53
FIGURE 3-18. EQUIPMENT EVALUATION TOOL ... 55
FIGURE 4-1. W ASTE VS. V ALUE... 57
FIGURE 4-2. THE UNCERTAINTY OF THE DEMAND FORECAST ... 59
FIGURE 4-3. THE BALANCING ACT OF CAPACITY PLANNING... 60
FIGURE 4-4. M SD D FR 13 ... 61
FIGURE 4-5. OVERCAPACITY USING CELLULAR AND HIGH-SPEED SYSTEMS ... 62
FIGURE 4-6. DOCK-TO-DOCK TIME, CUSTOMER DEMAND INTERVAL, RESPONSE TIME, AND THROUGHPUT TIME [COCHRAN, 1998]... 63
FIGURE 4-7. ILLUSTRATION OF LOT DELAY PHENOMENON... 65
FIGURE 4-8. HIGHEST LEVELS OF MSDD BRANCHING OUT TO THE FOUR FUNDAMENTAL DIMENSIONS OF MANUFACTURING... 66
FIGURE 4-9. THREE EXAMPLES OF FLOW IN FOCUSED MANUFACTURING SYSTEMS (A) CUSTOMER FOCUSED (B) PRODUCT TYPE FOCUSED (C) PROCESS FOCUSED [CARRUS, 2 0 0 0 ] ... 6 7 FIGURE 4-10. TRADE-OFFS AND IDEAL CYCLE TIME FOR CAPACITY SELECTION IN CELLS [COCHRAN, 2001 COURSE N OTES] ... 69
FIGURE 4-11. ILLUSTRATION OF RUN SIZE DELAY PHENOMENON [COCHRAN, 1998] ... 72
FIGURE 4-12. EXAMPLE OF MAN MACHINE CHARTS AND STANDARD WORK SEQUENCE [C O CH RA N , 1998]... 74
FIGURE 4-13. U-SHAPED ASSEMBLY CELL WITH SAMPLE WORK-LOOPS ... 74
FIGURE 4-14. VARYING WORK-LOOP PATTERNS IN ASSEMBLY... 76
FIGURE 4-15. PLANNED CYCLE-TIMES UNDER DIFFERENT WORK-LOOP CONFIGURATIONS. [A RIN EZ, 2000]... 76
FIGURE 4-16. LINKED MANUFACTURING CELL SYSTEM [COCHRAN, 2000] ... 78
List of Figures
FIGURE 4-18. TRANSFER (WITHDRAWAL) KANBAN... 79
FIGURE 5-1. MSDD WITH TAGGED FR/DP PAIRS THAT INFLUENCE EQUIPMENT DESIGN [A R IN EZ, 2000]... 84
FIGURE 5-2. SERVICEABLE MACHINE COMPONENTS LOCATED AT THE REAR OF MACHINE... 89
FIGURE 5-3. LEVEL 3 DECOMPOSITION OF "FR - REDUCE WASTE IN DIRECT LABOR."... 90
FIGURE 5-4. MATERIAL HANDLING PERFORMED BY OPERATOR [ARINEZ, 2000]... 91
FIGURE 5-5. ERGONOMIC HEIGHT AND REACH DISTANCES FOR AN OPERATOR ... 92
FIGURE 5-6. FEEDING OF PARTS INTO AND OUT OF AN OPERATION... 93
FIGURE 5-7. LEVEL 5 DECOMPOSITION OF "FR - ELIMINATE OPERATOR ASSIGNABLE CAUSES." ... 94
FIGURE 5-8. POKA-YOKE ON PALLET TO ERROR-PROOF THE INSERTION OF OUTER VANE INTO CEN TER H O U SIN G ... 94
FIGURE 5-9. EXAMPLE OF SUCCESSIVE CHECK LOGIC FOR AN ASSEMBLY STATION ... 95
FIGURE 6-1. EXPLODED VIEW OF A REAR AXLE ... 97
FIGURE 6-2. MAP OF THE STERLING AXLE PLANT ... 98
FIGURE 6-3. PICTURE OF RING GEAR (LEFT) AND PINION GEAR (RIGHT) ... 99
FIGURE 6-4. GEAR MANUFACTURING OPERATIONS... 100
FIGURE 6-5. MATERIAL FLOW OF RING AND PINION GEARS... 101
FIGURE 6-6. POSSIBLE PATHS THROUGH THE GEAR BUSINESS UNIT [COCHRAN, KIM, AND KIM, 2 0 0 0 ] ... 10 6 FIGURE 6-7. AXLE ASSEMBLY DEPARTMENT ... 107
FIGURE 6-8. SCHEMATIC OF THE AXLE ASSEMBLY LINE ... 107
FIGURE 6-9. DIFFICULTY TO BALANCE WORK W.R.T. TO CYCLE TIME ... 109
FIGURE 6-10. TRADE-OFFS AND IDEAL CYCLE TIME FOR CAPACITY SELECTION IN CELLS [C O CH RA N , 200 1]... 1 10 FIGURE 6-11. SUPPLY CHAIN OF HIGH-SPEED ASSEMBLY LINE ... 110
FIGURE 6-12. AN EXAMPLE OF A VOLUME FLEXIBLE ASSEMBLY CELL ... I11 FIGURE 6-13. SUPPLY CHAIN OF CELLULAR AXLE ASSEMBLY. ... I11 FIGURE 6-14. FR AND DP PAIRS FROM THE DIRECT LABOR BRANCH OF THE MSDD ... 112
FIGURE 6-15. EVALUATION OF THE HIGH-SPEED LINE ... 113
Cell and Equipment Design in the Automotive Components Industry
FIGURE 6-17. LAYOUT OF CAPACITY HARD END CELL ... 115
FIGURE 6-18. D RILLING M ACHINES ... 117
FIGURE 6-19. M ATERIAL H ANDLING ... 118
FIGURE 6-20. THE RAINBOW REAR DIFFERENTIAL ... 122
FIGURE 6-21. RAINBOW LAYOUT ... 123
FIGURE 6-22. D IFFERENTIAL CASE ... 124
FIGURE 6-23. GEAR CELLS VALUE STREAM MAP ... 126
FIGURE 6-24. LAYOUT OF PREMIUM GEAR PLANT... 127
FIGURE 6-25. BLANKING DEPARTMENT (STERLING) ... 128
FIGURE 6-26. VALUE STREAM MAP OF THE PREMIUM GEAR PLANT... 129
List of Tables
TABLE 5-1. FR/DP PAIRS THAT AFFECT EQUIPMENT DESIGN AND OPERATION [ARINEZ, 2000]
... 8 5
TABLE 6-1. MANUFACTURING PROCESSES FOR BOTH THE RING GEAR AND THE PINION GEAR 102 TABLE 6-2. ASSEMBLY PROCESS FOR A TYPICAL AXLE... 108 TABLE 6-3. EQUIPMENT DESIGN EVALUATION ... 117
TABLE 6-4. LIST OF LESSONS LEARNED... 119
Cell and Equipment Design in the Automotive Components Industry
Introduction
Unprecedented, interrelated changes in the global competition environment are creating entirely new success factors for manufacturing companies. The need for rapid customer responsiveness is putting pressure on manufacturing companies, not only to work with customers but also to achieve shorter product life cycle at the requirements of quality, delivery time and cost.
Responsiveness to the customer has been the underlying objective of the Toyota Production System (TPS) [Ohno, 1988], causing Toyota to be the most benchmarked manufacturing company in the world today [Spear and Bowen, 1999]. The basic concepts of TPS are (1) A complete standardization of work and information flows which in its turn allows the identification of errors and perturbations as soon as they occur, (2) To produce right quantity, right mix for the customer every shift in spite of variation at the operations, and (3) A continual improvement of work methods eliminating waste and non-value adding activities from the system, thus improving the efficiency of the manufacturing system, in terms of quality, response time to the demand and reducing cost [Ohno 1988].
While customer responsiveness depends on the whole supply chain rather than manufacturing, it is highly correlated with the physical implementation of the manufacturing system. Therefore, obliging companies to implement flexible, re-configurable, scalable and cost-effective equipments.
1.1 Thesis Objectives
Because the performance of a manufacturing plant depends heavily on the underlying design of the manufacturing system, several methodologies have been developed to meet a given set of requirements. The design of manufacturing systems is concerned with the physical layout of the operations, material flow through the system, and the use and provision of the right information to the right place, at the right time, with the right accessibility to control the arrangement of physical elements. However, as shown through this thesis, the majority of these methods are
Cell and Equipment Design in the Automotive Components Industry
dominated by empiricism and intuition that fails to link the strategic objectives of companies to the means to achieve these objectives logically and physically.
The objective of the thesis is to study a new methodology for the design of manufacturing systems that has been developed by Professor David S. Cochran, Director of the Production System Design Laboratory at the Massachusetts Institute of Technology. This thesis will show through a scientific approach with logical steps how to design and successfully link the strategic and organizational goals of manufacturing systems to define the Design Parameters (DPs) to achieve the Functional Requirements (FRs). This will bridge the gap between management and designers when converting the corporate mission statement(s) into something that is real, tangible and reinforced through proper "measure" on the factory floor.
Through the implementation of the methodology in a United States (US) manufacturing plant, this thesis will attempt to illustrate that one can achieve manufacturing excellence reflected in new performance measures compared to those of Toyota. Finally, this work draws lessons and recommendation from this project and presents improvement opportunities for the future.
1.2 Thesis Outline
This thesis starts with the background information in Chapter 2, which gives a brief definition of manufacturing systems, their history and evolution since the last century. Chapter 3 will present the Production System Design Framework which includes the Manufacturing System Design Decomposition (MSDD).
Chapters 4 and 5 present how the MSDD can be used in the selection of equipment and implementation of cells. A case study will be presented in chapter 6. This case study assesses the manufacturing system in an existing plant before and after implementation of the MSDD. This comparison highlights the deficiencies of the first manufacturing system and presents an alternative manufacturing system that has been implemented based on the approach developed in previous two chapters. Finally, Chapter 7 concludes the thesis by providing a summary and recommendations for further work.
History and Types of Manufacturing Systems
This chapter presents a brief history of the development of manufacturing systems since the industrial evolution and its transition from craft practices to large scale mass production systems and finally lean manufacturing. It will show manufacturing in the United States compared with other practices in the world such as Japan and Europe. In the second half of the chapter, the role of manufacturing systems and the importance of its positioning among the other functions in an enterprise will be presented. In addition, various types of manufacturing systems will be defined.
2.1 History and Evolution of Manufacturing Systems
In the last two centuries, more progress has been made in the field of manufacturing than during the rest of time. Production in the 1700s was of small scale and was more labor than capital intensive. The actual work was carried-out under two systems: the domestic system and the craft guilds. In the domestic system, material was delivered by merchants to homes where people performed the necessary operations and the merchants paid them for their work on a piecework basis. In the craft guilds system, work was passed from one shop to another [Hopp and
Spearman, 1996].
The emergence of Mass Production Systems in the 20 century increased productivity by orders of magnitude that led to lower production costs and lower prices. It depended not only on two main concepts, interchangeable parts and the moving assembly line, but also that people could afford to buy what manufacturers produced which created a reinforcing economic cell.
Interchangeable parts were realized on a large scale for the first time at the Springfield Armory between 1815 and 1825 [Hounshell, 1983]. Prior to the innovation of interchangeable parts, the making of complex machines was carried out in its entirety by an artisan, who fabricated and
Cell and Equipment Design in the Automotive Components Industry
tolerances tight enough to enable their use in any finished product. With workers producing single parts rather than completed products. The highly skilled artisan was no longer necessary and eliminated the need for specialized skills. Workers became, like parts, interchangeable due to division of labor.
By the beginning of the 20th century, high volume production was commonplace in the US in processes such as steel, aluminum and oil. However, it remained for Henry Ford (1863-1947) to make high-speed mass production of complex mechanical products using the moving assembly line. "The thing is to keep everything in motion and take the work to the man and not the man to the work. That is the real principle of our production, and conveyors are only one of many means to an end [Womack, 1990]."
A main success factor of Ford manufacturing plants was his strategic appreciation for the importance of time. Ford understood early on the importance of speed in the reduction of cost and throughput. In 1926, he boasted that his company could take ore from a mine and transform it into an automobile in 81 hours.
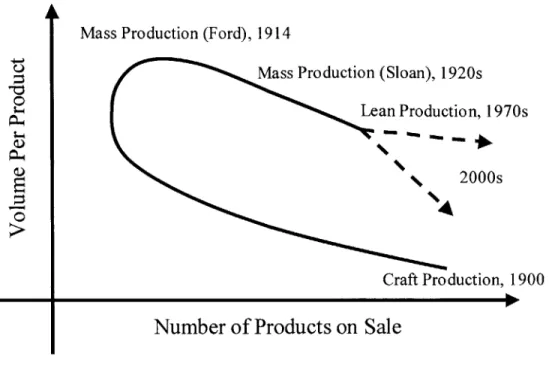
However, Ford avoided the problem of variety through the production of a unique model that would serve, as Sloan later put it, "every purse and purpose." [Womack, 1990] On the other hand, General Motors (GM), whose growth strategy was based on the acquisition and integration of new companies, was facing overlapping in products, factory systems, operations engineering, marketing. Sloan streamlined the organization and management processes and completed the system Ford created, the system that would be known today as Mass Production System. Sloan developed a five-model family ranging from cheap to expensive to serve all market segments. However, Sloan's model lacked the flexibility and cost effectiveness that Toyota would later surpass. The progression of product variety and production volume over years is shown in Figure 2-1.
History and Types of Manufacturing Systems
Mass Production (Ford), 1914
Mass Production (Sloan), 1920s Lean Production, 1970s
*
2000s
Craft Production, 1900
Number of Products on Sale
Figure 2-1. The Progression of Product Variety and Production Volume over years. [Womack, 1990]
As shown in Figure 2-1 and Figure 2-2, major developments in manufacturing systems are generally the fruit of a period of crisis: The development of interchangeable parts is a response to a need by the army to repair guns in the battlefield [Cochran, 1994]. The development of the moving assembly is a response to the need to produce in volume in a standardized way to reduce cost per part. The developments following the World War 1I, abolishment of intermediary warehouses, reduction of set up times, and development of U-cells are responses to limited resources following the war. Today and future development will be a response to pressure from customers for better products in term of quality time delivery, and design.
Cell and Equipment Design in the Automotive Components Industry
1785 Thomas Jefferson proposes that Congress mandate interchangeable parts for all musket contracts. 1792 Eli Whitney invents cotton gin.
1798 Eli Whitney contract for 4000 muskets in 1.5 years. 1801 Eli Whitney demonstrates interchangeability to Congress. 1809 Eli Whitney delivers, 8.5 years late, non-interchangeable parts. 1811 John Hall patents breech-loading rifle.
1812 Roswell Lee becomes superintendent of Springfield Armory. 1815 Congress orders Ordnance Dept. to require interchangeable parts. 1818 Blanchard invents trip hammer for making gun barrels.
1819 Blanchard invents lathe for making gunstocks. 1819 Lee introduces inspection gauges; Springfield Armory.
1822 John Hall announces success at Harpers Ferry using system of gauges to measure parts. 1825 Eli Whitney dies.
1834 Simeon North at Middletown CT, adopts Hall's gauges, delivers rifles (parts) interchangeable with Harper's Ferry production.
1839 Samuel Colt and Eli Whitney Jr. revolver contract. 1845 The Armory Practice spreads to private contractors.
1860s Steam-powered cars multiply, but do not reach public acceptance. 1894 Charles King in Detroit invents four-cylinder engine.
1896 King's 4 cylinder attains top speed of 5 mph in March, weight 1500 lbs. 1896 Ford's 4 cylinder attains top speed of 20 mph in June, weight 500 lbs. 1898 Stanley Steamer won hill-climbing test, order for 200 resulted for $600.
1898 Percy Maxin creates range of designs for electrics. Range 35 miles at 12 mph between charges. 1899 Electrics out sell all others.
1900 1500 Electrics sold, twice the number of steamers.
1903 Ford Model A, twin horizontally opposed engine, $750 ea., 1708 in 1904. 1905 25 made/day, Ford Mfg. Co. formed to produce engines/transmissions. 1906 Model N outsells Oldsmobile with 8,729, a 4 cylinder at $500. 1907 Models N, R ($750) and S ($700) sold 14,887 and 10,202 in 1908. 1908 Model T introduced, single cast 4 cylinder, 5 body styles: $825 -$1000. 1909 100 produced per day. 17,771 Model T's sold.
1913 Moving assembly line at Highland Park. 308K-1914, 501K-1915 at $440. 1922 Over 1 Million model T's sold yearly to 1926.
1923 1.82 million produced at average of $300 with more options standard. 1928 Chevrolet out-sells Ford and Produces 1.2 million vehicles.
1945 Need to Re-build wide variety of products in low volume after World War II. Only had six presses, requiring frequent and fast changeover.
1948 Withdrawal by subsequent processes. 1949 Intermediate warehouses abolished.
1950 "In-line cells". Horseshoe or U-shaped machine layout. 1950 Machining and assembly lines balanced.
1953 Supermarket system in machine shop. 1955 Assembly and body plants linked.
1955 Main plant assembly line production system adopts visual control (andon), line stop and mixed load. Automation to autonomation.
1958 Warehouse withdrawal slips abolished. 1961 Andon installed, Motomachi assembly plant.
1962 15-minute main plant setups.
1962 Kanban adopted company-wide. Full work control of machines baka-yoke.
1965 Kanban adopted for ordering outside parts for 100% of supply system; began teaching affiliates. 1966 First autonomated line Kamigo plant.
1971 Main office and Motomachi setups reach 3 minutes. 1971 Body indication system at Motomachi Crown line.
1981 Publication of Toyota Production System in English & infusion in U.S. 1990 Publication of the "Machine that Changed the World"
History and Types of Manufacturing Systems
2.1.1 The Japanese Vision of Manufacturing
A lot of customers accused the Japanese of designing similar and less than original cars [Womack, 1990]. This was to some extent true in the seventies and the eighties. However, at the same time Japanese designers were working in close coordination with manufacturing engineers to design body parts that can take their final shapes within less than three passes under the dies. The objective was to make savings on the dies' use through the design of parts. Meanwhile, the big three were producing less appealing cars with up to seven passes under the
dies in some cases.
These examples and several others, shows the philosophy behind the Japanese vision not only about manufacturing, but also about the integration of lean enterprise. In reality, the origin of this philosophy comes from the post World War II era, when Japan was economically devastated and production resources were scarce. During that period the objective was to achieve superior performance using the least resources. Lean manufacturing concepts were developed over a period of several decades as a counter-measure to the Japanese situation and is based on two main principles (1) Standardization of work, information flow, and support in order to be able to identify perturbations as soon as they occur and, (2) Continual improvement of work methods and processes to achieve higher performances.
The Japanese vision of manufacturing occurred towards the end of the World War II era. It has emerged as a consequence of several contexts taking place in the same time.
(1) The Japanese market was small and demanded a wide range of vehicles.
(2) At that time, the occupying Americans had decided to stamp out inflation through credit restrictions. This meant, that massive purchases of advanced western machinery were quite impossible.
(3) The outside world was full of huge motor-vehicle producers who were anxious to establish operations in Japan and ready to defend their established markets against Japanese exports.
Cell and Equipment Design in the Automotive Components Industry
day to an astonishing three minutes and eliminated the need for die-change specialists [Womack, 1990]. In the process, he made an unexpected discovery: it actually cost less per part to make small batches of stampings than to run off enormous lots. The reasons behind this discovery were reduced inventory costs, improved quality through the reduction of time between mistakes occurrence and their detection, reduction in floor space, and an increase in delivery reliability.
In addition, the changes in Japanese labor regulations put unions in a power position. Through negotiations, workers obtained a whole set of rights including the guarantee of lifetime employment. In exchange, they agreed to be flexible in work assignments. Ohno quickly realized that, through this settlement, workers have definitely become a fixed cost. He, therefore, enhanced their skills and made better use of their knowledge and experience through
letting them actively participate in work implementation.
2.1.2 Manufacturing in the United States
Over the last 20 years, US manufacturing system design groups have translated substantial investments into creating a mirror image of the Japanese manufacturing system. Some of these endeavors have gained much publicity for their contribution to productivity and flexibility. But while some made headlines in various publications, many more have failed to meet expectations regarding cost, start-up dates, and subsequent performance. Reasons for these failures are numerous, but the most common one is that these systems never originated from the companies themselves and have never been designed to resolve the very particular problems of manufacturing systems of those particular companies [0' Sullivan, 1994]. However, a more convincing reason asserted by Cochran is that the failures are due to the US manufacturers copying the physical tools without understanding why the tools were created in the first place. In addition to this, several of these concepts originated from Japan, which resulted in psychological barriers for US manufacturers to adapt them.
Indeed, even if the proposed methods look, in the beginning, general with wide applications, applying them to all manufacturing systems is very difficult. For example, production of planes at Boeing is very different to the production of chips at Intel in terms of complexity, volume,
History and Types of Manufacturing Systems
variation and customer expectations. However, certain Functional Requirements (FRs) apply universally to discrete part repetitive manufacturing regardless of volume or product complexity. The physical tools may be similar or different but the FRs stay the same.
The difficulty is to understand the objectives from the physical implementation. Although the budgets for training and education of managers around these new systems and concepts have steadily increased during the last twenty years, several managers and even production managers find it difficult to understand the objectives behind the tools being implemented. This led to some situation where one speaks about "Just in Time warehouse." For several years, Toyota has allowed visitors from other companies, including competitors, to visit its plants but never explained to the visitors what is the essence of the practices they have noticed in their visits. As a result, tools are implemented with minimal understanding and minimal conviction. Physical systems are implemented, because the others are implementing it and they say it works. The result is that the companies' resources are lost implementing the flavor of the month, be it "Just in time", "Six Sigma" or "Total Quality Management" without any real conviction or commitment [Cochran, 1998].
A manufacturing professor at MIT mentioned, once that "the reason for Toyota having such a superior quality is that it has new plants and new equipment." This claim does not look at the relevant facts that Toyota Georgetown, which is now going on its 15th anniversary, won the JP Power Gold award for quality just last year and has consistently received quality awards throughout its history. In contrast, we may also view companies like Cadillac and Chrysler, which won quality awards one year and perform miserably the next [Johnson, Cochran, 2000].
Today, US manufacturers are in a much better shape than what was predicted for them in the beginning of the eighties. America is not reduced to its cinematographic industry and the Japanese didn't take over the world as it has been predicted twenty years ago! Moreover, recent studies have shown that the gap between Japanese and US manufacturers in terms of number of cars produced is closing [Womack, 1990]. Figure 2-3 shows the number of vehicles produced in the US versus Japan.
Cell and Equipment Design in the Automotive Components Industry
The quality of manufacturing products has dramatically been increased as shown by the JD Powers Initial Quality Survey. This, in turn, translates to longer product life cycle and a reduced market for new products. In addition, new manufacturing concepts coupled with the development of information technology and the internet will create exciting opportunities for improvement, not only in manufacturing systems themselves, but in the whole supply chain creating what will be known as the extended enterprise where the customers and the suppliers will be integrated in the manufacturing system in an extended value stream.
US and Japanese Motor Vehicle Production
14 12 S10 -A 0 8 --- Japan . .US 4 / 0 1940 1950 1960 1970 1980 1990 2000 Year
Figure 2-3. US and Japanese automotive production between 1947 and 1989 [Womack, 1990]
2.1.3 What About Europe?
The European manufacturers have suffered, just as their peers in the US, by the competition of Japanese manufacturers. But the ideology that European products are of higher quality and better design than products from foreign countries are drivers for the European markets before other factors such as quality, lead-time or cost [Hardt, 1998]. One has to look only to the premiums European manufacturing companies are charging to their nationals to understand this. For example, a French carmaker charges French national in average 10% higher price for its cars than the price of the same car sold in Germany or Italy.
History and Types of Manufacturing Systems
2.2 Importance of Manufacturing As Competitive Advantage
Today, the world is entering an era where the lean practices coupled with the emergence of internet and information technologies will allow the extension of the manufacturing system to the customers from one side and to the suppliers from the other side making therefore the boundaries between the supply chain and the manufacturing system fuzzier.
Organizational Supply Chain
4th Tier 3rd Tier 2nd Tier 1st Tier Assembler Dealer
Supplier Supplier Supplier Supplier
Technology Supply Chain
cheitry Casting Valve lifters engines Cars
Capability Chain
Machine Equipment
Production
Controls Development Line Design System Design
Design
Figure 2-4. Supply chain mapping illustrating elements required to satisfy customer's needs (adapted from
[Fine, 1999]).
Any enterprise can be viewed as a chain of capabilities that enable it to satisfy the customer's demand [Fine, 1999] as shown in Figure 2-4. This view creates capabilities as a new structure around the supply chain in addition to the organizational and technological structures. It looks at the capabilities needed in order to ensure successful design and implementation of the supply chain. Manufacturing is one of these capabilities and has to be developed and designed in order to achieve the strategic objective of the enterprise. Skinner (1969) refers to the design step as defining the "manufacturing task," where doing so involves describing what must be accomplished by manufacturing in order to compete. In this regard, Hayes and Wheelwright
Cell and Equipment Design in the Automotive Components Industry
production efficiency, but is the one that best supports the business strategy. They states four stages of the strategic role of manufacturing [Hayes and Wheelwright, 1985]:
1. Internally neutral: minimize the negative effect of manufacturing. Outside experts are called in to make decisions about strategic manufacturing issues. Internal, detailed management control systems are the primary means for monitoring manufacturing performance. Manufacturing is kept flexible and reactive.
2. Externally neutral: achieve parity with competitors. Industry practice is followed. The planning horizon for manufacturing investment decisions is extended to incorporate a single-business cycle. Capital investment is the primary means for catching up with competition or achieving a competitive edge.
3. Internally supportive: provide support to the business strategy. Manufacturing investments are screened for consistency with the business strategy. A manufacturing strategy is formulated and pursued. Longer-term manufacturing developments and trends are addressed systematically.
4. Externally supportive: manufacturing contributes significantly to competitive advantage. Efforts are made to anticipate the potential of new manufacturing practices and technologies. Manufacturing is involved "up front" in major marketing and engineering decision. Long-range programs are pursued in order to acquire capabilities in advance of needs.
Manufacturing, being one of the links in the chain of capabilities, therefore can be a source of competitive advantage, provided that the manufacturing strategy is aligned with overall business
strategy.
In the case of manufacturing, this necessity relates not only to processes and technology development but also to the organization and its ability to change. This flexibility and anticipation of windows of opportunity to gain competitive advantage is the ultimate core competency of business.
However, the competition and the market are in constant change. This means that in order, to stay competitive, an enterprise need to reinvent and reengineer itself constantly in order to adapt to the demanding and constantly changing customer requirements and the development of
History and Types of Manufacturing Systems
competitive advantages at the other players. Fine [Fine, 1999] stressed that no single capability should be viewed as a sustainable advantage because, unless additional action is taken and other moves are made, the competitive advantage will be overtaken by the competition. This necessity place manufacturing in the heart of corporate strategy: not only to provide a competitive advantage now, but also to develop new attributes for the future.
2.2.1 Definition of the Manufacturing System
Manufacturing can be defined as the transformation of material into something useful and portable [Gershwin, 1994]. A manufacturing system as shown in Figure 2-5 encompasses not only a sequence of operations that add value to a product through transformation, but also some other required tasks such as storage, inspection and transportation, which do not take part in the transformation but are required to complete the process [Cochran, 1998].
ProductontemTransportation
Dept. l.s. A Manufacturing System is a complex arrangement of physical objectscharacterized by measurable parametersEngineering Production Control
Accounting
Figure 2-5. The relationship between the manufacturing system and the production system [Cochran, 19981
The Production System provides the supporting functions to the manufacturing system. The production system defines the measurables. From an enterprise point of view, manufacturing is a function (among others) designed to achieve defined requirements in the enterprise. It is linked
Cell and Equipment Design in the Automotive Components Industry
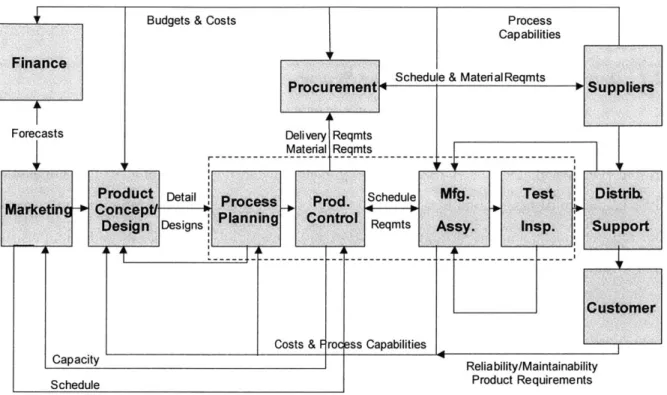
test and inspection) to other functions in the company. Another way of looking at the manufacturing system is shown in Figure 2-6 (the manufacturing system is enclose within in the dashed rectangle). It shows the role of manufacturing as a part of the enterprise with interactions from other functional groups within the organization.
Budgets & Costs Process
Capabilities
Finance
Schedule & MaterialReqmts Suppliers
Procurement + - upir
Forecasts Delivery Reqmts
Product Detail Punctio po ihedule Mfg. Tst Distri
Marketinew Conc ept a ternesn go th
Desi n Designs isaging ContReqmts Assyste s.
CapacityCosts & F rocess CapabilitiesU
Capacty * Reliability/Maintainability
Schedule Product Requirements
Figure 2-6. Manufacturing function positioning in the enterprise (Nightingale, 2000)
In order to analyze the behavior of the entire manufacturing system it is important to take a
holistic view, rather than view it from a reductionist perspective [Hopp and Spearman, 1996]. This board view allows a better understanding of the system behavior and the impact of a given
action on not only the subsystem it is targeting but on the other subsystems.
By transforming the customer needs into system requirements, the holistic view of the system allows a better analysis and design of the manufacturing system by focusing on the overall
objectives of the system and then traducing them into sub-objectives for the subsystems. The holistic view of the system allows coherence between the solutions defined at the subsystem level to achieve their objectives. In this regard, Cochran [Cochran and Johnson, 2001] highlights the importance of understanding the relationships between any proposed means and objectives: " The sensitivities -the perception of reality- of one who sees through the lens of quantity and one
History and Types of Manufacturing Systems
who sees with awareness of systemic relationships between ends and means define entirely different worlds. One looks at a forest and can see only "trees" (or "fiber"), whereas the other looks at a forest with the consciousness (the awareness) of a forest".
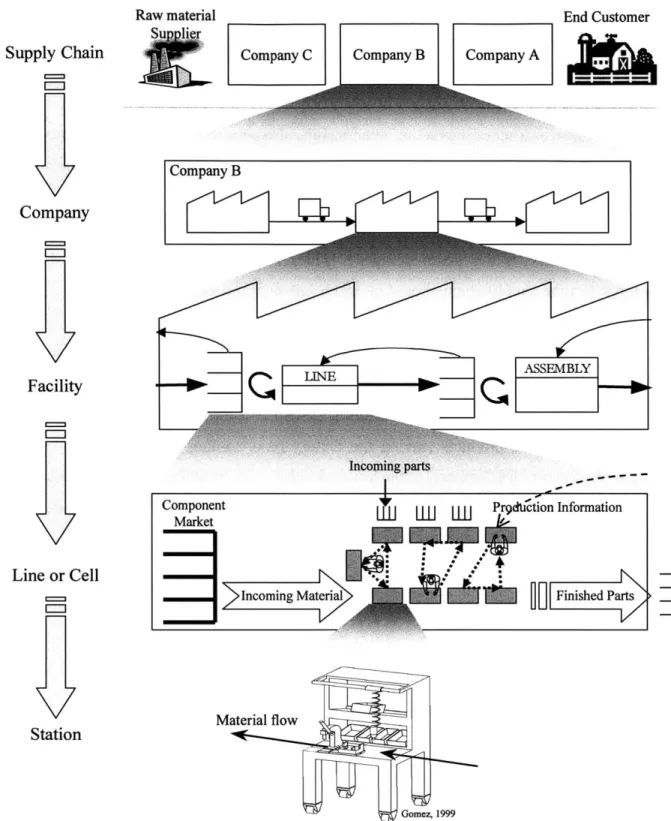
Viewing a system as a set of interacting relationships also permits one to look at various levels of detail shown in Figure 2-7. At higher level, the study of manufacturing systems concentrates on their integration within the entire supply chain, where decisions are aimed at maximizing end-customer satisfaction, while at the same time maximizing profit shared over the entire chain beyond the borders of the given company [Fine, 1999]. At this level, other issues not incorporated in the supply chain should be taken into consideration such as product design and its interface with manufacturing systems design.
On a lower level, the analysis will concentrate on the manufacturing system as a process inside a given factory. At this level the manufacturing system is a transformation process of material entering the factory to products leaving the factory (door-to-door view). Finally the level of detail can go down to line/cell and at the lowest level to stations and machines. In this thesis, it will be shown how the design of cells and stations will impact the performance of the manufacturing system at the door-to-door level and higher levels.
Cell and Equipment Design in the Automotive Components Industry Supply Chain Company Facility Line or Cell Station
Raw material End Customer
Company C Company B Company A
Company B
MBLY
Incoming parts
Component Prgdtiction Information
Market
Incoming Material A Finished Parts
Material flow
Gomez, 1999
Figure 2-7. Logical grouping of relationships within the subsystems of an enterprise (adapted from [Mierzejewska, 20001)
History and Types of Manufacturing Systems
2.2.2 Types of Manufacturing Systems
Manufacturing systems can be classified according to their process structure [Hayes and Wheelwright, 1979]:
m Job shops
* Disconnected flow lines - batching
* Connected flow lines - Continuous flow processes
It is important to note that the physical plant design is the result of achieving FR-DP. The process structure defines how the material flows through the plant and is usually related to the type of product produced, as shown in Figure 2-8. The manufacturing systems considered in this work are intended for repetitive production of discrete items. They are characterized by a defined part routing and are connected by a paced material handling system.
Process structure Jumbled flow (job shop) Disconnected line flow (batch) Connected line flow (lines or cells) Continuous flow Low volume
low standardization Multiple products one of a kind low volume
High volume Few major products high standardization
higher volume commodity products
Ship building
Heavy equipment
Auto assembly
Sugar refinery
Figure 2-8. Matrix of manufacturing systems' process structure (adapted from [Hayes and Wheelwright, 19791).
Cell and Equipment Design in the Automotive Components Industry
2.2.2.1 Job Shop
A Job Shop style manufacturing system uses standard flexible machines, which are not oriented or configured for any particular product. Instead, products flow from machine to machine in which ever order necessary. Also, there is no automated transfer of parts from one machine to another. Job Shops generally produce in batches. For instance, a batch of 100 parts of a particular type is produced at one machine, and then the batch is transported to the next machine. The machines in Job Shops generally have long changeover times, are labor intensive, and require complex scheduling. However, the Job Shop is the most flexible system type in terms of product variety for low volume products.
2.2.2.2 Transfer Lines
Transfer lines use machines that were specially designed with a particular model of product in mind. These systems tend to be expensive due to the engineering and custom development required. These systems generally support very different products or models. Due to the relative high cost to retool these systems, they are generally used for products with long life cycles.
2.2.2.3 Continuous Flows
While some argue that they are not really manufacturing systems, continuous flows are systems where the product is transformed while moving. Therefore, there is intermediate inventory in the system at any stage. These systems are suitable for chemical processes where the fluids in general are mixed and treated in a continuous flow using pipelines to end up with the product demanded by the customer. Therefore they imply huge integration between the process and the
system.
2.2.2.4 Linked-Cell System
A linked-cell system is a manufacturing system composed of manufacturing and assembly cells linked by a pull system, thus providing a continuous flow and smooth movement of materials through the plant [Black, 1991]. A linked-cell system has a single instruction point, from which
History and Types of Manufacturing Systems
production requirement information is issued to upstream processes, in a direction opposite to the material flow. Therefore, production is based on actual usage downstream, rather than a forecast requirement.
The cells can be linked directly to each other by placing them directly at the point of use or indirectly by the pull system of material control called kanban [Black, 1991]. The buffers between cells are used to protect downstream elements from delays in upstream cells, providing a self-correcting mechanism for production requirement information to compensate for variations in the system.
The linked-cell system requires a defined and constant internal customer - supplier structure for a given product type; a given product type has a defined part routing - a sequence of machines and a path it always takes in its manufacturing process, which is essential in the flow line process structure. This type of the manufacturing system will be primarily discussed in this work.
Cell and Equipment Design in the Automotive Components Industry
The Production System Design Framework
This chapter will present the Axiomatic Design (AD) Theory developed by Suh (1990) which the Manufacturing System Design Decomposition (MSDD) is based on. It will also briefly present the Production System Design Framework that encompasses tools including the MSDD, Design Matrix, Flowchart, Manufacturing System Evaluation and Equipment Evaluation.
3.1 Introduction to Axiomatic Design
Axiomatic Design (AD) is a design methodology that attempts to provide a science base for design [Suh, 1990]. Traditionally, design has not been viewed as a scientific process. It has been considered a skill that is innate to some, not a skill that can be developed. Axiomatic Design provides a structured method to relate requirements and solutions for a design problem.
3.1.1 Mapping from Functional Requirements to Design Parameters
The first important step in Axiomatic Design is to understand the customer requirements. The objectives or strategy of the enterprise must be aligned with meeting and/or exceeding the defined customer requirements. These customer requirements must be translated into functional requirements (FRs) which will guide the design.
What?
How!
Customer ~ FsDs
Wants
Functional Design
Requirements Parameters
Cell and Equipment Design in the Automotive Components Industry
The functional requirements identify what needs to be achieved by the design in order to meet the customer requirements. The FRs are then mapped to their corresponding design parameters (DPs), as shown in Figure 3-1. The DPs identify how the FRs will be satisfied and usually relate to actual characteristics of the design.
For example, one customer requirement for a design may be portability. From this one customer requirement, several functional requirements may be derived. One of these functional requirements might be creating a lightweight design. Then, the design parameter would incorporate some target value for the weight of the design. This mapping process seeks to ensure that a design adheres to the requirements set forth by the customers.
3.1.2 Decomposition of a Design
Following the mapping process from each functional requirement to its corresponding design parameter, the DP is decomposed into lower level FRs if the DP needs to be further defined. These lower level FRs state what needs to be done in order to accomplish the parent DP. Then, similarly, the lower level FRs are mapped to their corresponding DPs. This decomposition process shown in Figure 3-2 continues until the design is complete.
FRI Maximize long term return on investment DP1 Manufacturing system design FR11I FR12 FR13
Maximize sales Minimize Minimize
revenue production costs investment over production system lifecycle
DP11 DP12 DP13
Production to Elimination of Investment
maximize non-value based on a
customer adding sources long term
The Production System Design Framework
3.1.3 Independence Axiom and Information Axiom
During the decomposition process, there are two axioms in Axiomatic Design which govern the development of an acceptable design: the Independence Axiom, and the Information Axiom.
Independence Axiom: Maintain the independence of FRs.
Information Axiom: Minimize the information content of the design.
The Independence Axiom asserts that excellent designs should maintain the independence of the FRs. Each DP should influence one and only one FR in order to maintain complete independence. When a DP affects more than one FR, this condition creates some degree of coupling. Several DPs may influence a single FR and as a result, may create the need for optimization and evaluation of tradeoffs in order to best satisfy all the functional requirements of a design.
The Information Axiom asserts that good designs should have minimum information content. This means that designs which have the highest probability of satisfying the requirements are better. This probability is inversely related to the amount of information required to fulfill the requirements. Therefore, the Information Axiom seeks to minimize the amount of complexity in a design in terms of the information required and the relative difficulty of creating or implementing the design.
As shown in Figure 3-3, excellent designs are uncoupled, path-independent, and simple, and each DP affects only its corresponding FR, making the matrix diagonal. This is the best possible design. Good designs are decoupled, path-dependent, and moderately complex, and some DPs affect more than one FR, but the matrix can be made triangular. Therefore, this is still an acceptable design. Poor designs are coupled and complicated which prevents the matrix from being made triangular. This design is unacceptable from an Axiomatic Design standpoint because it violates the Independence Axiom.
Cell and Equipment Design in the Automotive Components Industry FR 1 FR11 FR12 FR13
LP11
FR 11 FR 12 FR 13 FR 11 FR 12 FR 13 DP 11 X 0 0 DP 11 (X X sX DP 12 0 X 0 DP 12 0 X X DP 13 o 0 X) DP 13 0 0 X, Best - Uncoupled Acceptable - Decoupled DP DP DP 11 12 13 P11 P12 DP 13X X X" FR 12 X X X Poor -Coupled FR 13 X X X)Figure 3-3. Differences Among Designs using Axiomatic Design [Cochran, 1998]
3.1.4 Axiomatic Design: Water Faucet Example
In order to illustrate the two axioms, the water faucet example is presented in Figure 3-4. The functional requirements (FRs) of a water faucet are controlling the water temperature and flowrate. The upper half of the figure shows a water faucet with a hot water valve and a cold water valve, the two design parameters (DPs) designated for the two FRs. The Design Matrix shows that this is a poor, coupled design since both DPs affect both FRs. Turning valve A affects both the temperature and the flowrate of the water, as does turning valve B. Therefore, this design is unacceptable from an Axiomatic Design perspective.
The lower half of the figure shows a water faucet with a water temperature valve and a flowrate valve, the two new DPs designated for the two FRs. The Design Matrix shows that this is an excellent, uncoupled design since each DP affects only one FR. In this case, each DP has been specifically chosen to satisfy only its corresponding FR, and they control water temperature and flowrate independently of each other. This is an excellent design from an Axiomatic Design viewpoint.
![Figure 2-4. Supply chain mapping illustrating elements required to satisfy customer's needs (adapted from [Fine, 1999]).](https://thumb-eu.123doks.com/thumbv2/123doknet/14209378.481616/27.918.112.791.364.707/figure-supply-mapping-illustrating-elements-required-satisfy-customer.webp)

![Figure 3-3. Differences Among Designs using Axiomatic Design [Cochran, 1998]](https://thumb-eu.123doks.com/thumbv2/123doknet/14209378.481616/40.918.174.719.101.424/figure-differences-among-designs-using-axiomatic-design-cochran.webp)
![Figure 3-5. Manufacturing System Design Decomposition [Cochran et al, 2000]](https://thumb-eu.123doks.com/thumbv2/123doknet/14209378.481616/42.918.143.784.92.463/figure-manufacturing-system-design-decomposition-cochran-et-al.webp)