Publisher’s version / Version de l'éditeur:
16th Int. Symposium on Okhotsk Sea and Sea Ice 4–8 February 2001 Mombetsu,
Hokkaido, Japan, pp. 463-470, 2001
READ THESE TERMS AND CONDITIONS CAREFULLY BEFORE USING THIS WEBSITE. https://nrc-publications.canada.ca/eng/copyright
Vous avez des questions? Nous pouvons vous aider. Pour communiquer directement avec un auteur, consultez la première page de la revue dans laquelle son article a été publié afin de trouver ses coordonnées. Si vous n’arrivez pas à les repérer, communiquez avec nous à PublicationsArchive-ArchivesPublications@nrc-cnrc.gc.ca.
Questions? Contact the NRC Publications Archive team at
PublicationsArchive-ArchivesPublications@nrc-cnrc.gc.ca. If you wish to email the authors directly, please see the first page of the publication for their contact information.
Archives des publications du CNRC
This publication could be one of several versions: author’s original, accepted manuscript or the publisher’s version. / La version de cette publication peut être l’une des suivantes : la version prépublication de l’auteur, la version acceptée du manuscrit ou la version de l’éditeur.
Access and use of this website and the material on it are subject to the Terms and Conditions set forth at
Physical properties of natural sea ice: implications for single- and
multi-polarization SAR images
Johnston, M.; Sinha, N. K.
https://publications-cnrc.canada.ca/fra/droits
L’accès à ce site Web et l’utilisation de son contenu sont assujettis aux conditions présentées dans le site LISEZ CES CONDITIONS ATTENTIVEMENT AVANT D’UTILISER CE SITE WEB.
NRC Publications Record / Notice d'Archives des publications de CNRC:
https://nrc-publications.canada.ca/eng/view/object/?id=f6041325-4887-4784-aa03-30ff71a30994 https://publications-cnrc.canada.ca/fra/voir/objet/?id=f6041325-4887-4784-aa03-30ff71a30994
Mombetsu, Hokkaido, Japan
Physical Properties of Natural Sea Ice:
Implications for Single- and Multi-polarization SAR Images
M. Johnston
Canadian Hydraulics Centre National Research Council of CanadaOttawa, Ontario K1A 0R6 and
N.K. Sinha
Institute for Aerospace Research National Research Council of Canada
Ottawa, Ontario K1A 0R6
ABSTRACT
This paper discusses the physical properties of naturally grown first-year sea ice and the implications that ice physical properties have for single- and multi-polarization SAR images. Temporally and spatially coincident images from the vertically polarized European Research Satellite (ERS-1) and the CCRS polarimetric airSAR are compared. Quantified from the two different SARs is the backscattering coefficient of three sample areas of first-year ice near Resolute, Cornwallis Island. The 46° to 52° span of incidence angles in the polarimetric airSAR produce much lower microwave returns than observed from the 23° incidence angle of the ERS-1 satellite. The direct influence that ice salinity, density and microstructure have upon the ice microwave scattering characteristics is quantified in terms of the backscattering coefficient.
Introduction
Synthetic Aperture Radar (SAR) in the microwave spectrum provides an excellent means by which to obtain information about the ice type, transport processes and ice deformation mechanisms. Microwave imagery can be extremely useful for discriminating between different types of ice, if properly interpreted. Proper interpretation depends upon knowledge of the microwave signatures associated with different types of ice. Frequently, the same ice type can have a range of ice signatures or, conversely, different ice types can exhibit similar signatures. Much of this difference is directly related to the ice properties. As such, microwave imagery benefits from validation studies in which the in situ properties of the ice are measured.
At present, no direct relation has been established between the microwave return from the ice and the ice physical properties. This paper synthesizes those two areas in that it compares the ice signature obtained from calibrated, microwave imagery to in situ ice measurements. The influence of ice properties on the microwave scattering properties of ice is explored by comparing calibrated satellite imagery from the European Research Satellite (ERS-1) to microwave imagery from an airborne polarimetric SAR. The relation between the ice properties and the microwave signature is illustrated for three nearby regions of first-year ice, each having different physical properties.
Background
One of the most important principles of active microwave remote sensing is that it provides a record (grey-scale image) of the amount of incident energy returned from the ice surface, the so-called backscattering coefficient. The image expresses the microwave return from the ice in terms of pixels, each of which has a tonal value from 0 to 255. Provided the sea ice is cold, the snow covering the ice surface is transparent to the incident microwave energy. In that case, the microwave return is dominated by the influence of the surface roughness of the ice and the ice physical properties throughout the penetration depth. Within the penetration depth, the incident energy is reduced to about 33% (1/e) of the amplitude that it had at the ice surface. Once the microwave energy has penetrated the ice surface it encounters brine and air inclusions, entrapped in the ice during the ice growth process. Brine and air inclusion are the source of transmission loss, hence the reduction in amplitude of the incoming microwave energy. Realizing that volumetric inhomogeneities (brine and air inclusions) significantly influence the microwave scattering properties of the ice, numerous researchers directed efforts towards quantifying the volumetric inclusions in the ice (Poe et al., 1974; Bjerkelund et al., 1985; Shokr and Sinha, 1992 (a), 1992 (b), 1995; Johnston, 1998).
This paper arises out of ERS-1 validation efforts conducted in 1993 from Resolute (74oN, 94oW), Cornwallis Island, Nunavut. That season, validation efforts centred upon temporally coincident microwave imagery from ERS-1 and from the airborne SAR, operated that season by the Canada Centre for Remote Sensing (CCRS). The microwave imagery was used to identify interesting “ice features” in the nearby area, which were then targeted for ground-truthing. The properties of the surface layer of ice (uppermost 0.30 m) was measured in those targeted areas, since that layer is of most importance to microwave scattering from first-year sea ice. Sinha and Shokr (1999) summarize the ice property measurements from the nine targeted areas in Allen Bay and Resolute Passage.
Satellite Microwave Image of the Ice in Allen Bay and Resolute Passage
ERS-1 Synthetic Aperature Radar (SAR) uses microwave energy in C-band (5.3 GHz) to transmit and receive vertically polarized energy. ERS-1 provided images at a resolution of 25 to 30 m, within an incidence angles range of 20° to 26° for the 100 km swath width. The ERS-1 images used to characterize the ice around southern Cornwallis Island in the spring of 1993 were obtained from the Alaska SAR facility. The original working images consisted of a 2002 x 2002 matrix of 8-bit digital numbers with a degraded resolution of 240 m (pixel spacing of 100 m). Figure 1 shows a cropped version of one of the working images used to evaluate the backscatter from ice types in and around Allen Bay and Resolute Passage, Cornwallis Island (Johnston, 1998). The ERS-1 sub-scene in Figure 1 was 50 km wide and as such, had a 3° incidence angle range.
The ERS-1 sub-scene in Figure 1 (acquired on 28 April 1993) reveals the general appearance or
signature of the continually evolving ice cover at one instant in time. The microwave image illustrates the complex influence that the ice consolidation process has upon microwave scattering properties of the ice. For example, the characteristic microwave signatures of three distinct tonal regions in Allen Bay indicate different consolidation histories (Johnston and Sinha, 2000). Property measurements of the ice in Allen Bay showed it to be a composite of first-year ice, second year ice and low-salinity sea ice (Johnston, 1998; Sinha and Shokr, 1999).
This paper examines the microwave signature of three samples areas of ice within the rectangular boxes shown in Figure 1. One sample area was chosen from the ice in southern Allen Bay and is referred to subsequently as “SAB”. Two additional sample areas were selected from the ice in Resolute Passage, designated as ‘western’ and ‘eastern’ Resolute Passage respectively (WRP and ERP). The three sample areas were about 0.4 km² (about 100 pixels).
Mombetsu, Hokkaido, Japan 10 km
N
Cornwallis
Island
Griffith IslandAllen Bay
Resolute Passage Resolute[
SAB WRP/ERPFigure 1 ERS-1 Image of Allen Bay and Resolute Passage (28 April 1993) Airborne Polarimetric Microwave Image of the Ice in Allen Bay and Resolute Passage Part of the spring 1993 validation work involved obtaining C-band (5.3 GHz) polarimetric data that were spatially and temporally coincident with the ERS-1 imagery. On 3 May 1993 the Canada Centre for Remote Sensing (CCRS) acquired images of Resolute Passage and Allen Bay using their C-band polarimetric SAR, operated from a Convair 580. The polarimetric airSAR transmitted and received both vertically and horizontally polarized microwave energy in a time multiplexed fashion. The region within the parallelopiped shown in Figure 1 shows where the ERS-1 and polarimetric airSAR overlapped.
This paper focuses upon two of the basic data files produced during the polarimetric SAR overpass: horizontally horizontally received energy (HH) and vertically transmitted-vertically received energy (VV). The reader is referred to Johnston (1998) for a complete description of the suite of polarimetric images. The 6 m, high-resolution HH and VV images are shown in Figure 2 and Figure 3 respectively. In comparison to the narrow range of incidence angles required for the 785 km orbit elevation of ERS-1, the low altitude of the airSAR required incidence angles from 6° to 62° to cover the 14 km ground range. Note that the same three rectangular sample areas chosen from ERS-1 image (Figure 1) are shown in Figure 2 and Figure 3 (SAB, WRP and ERP). The sample areas from the airSAR data were 0.04 km² (2500 pixels). Backscatter from Selected Sample Areas of Ice
The ERS-1 image and the airSAR polarimetric images were both radiometrically calibrated. Calibrated images are extremely useful in that the influence of radar dependent parameters is removed, enabling the signal magnitude (seen as tonal variation) to be related directly to the radar cross section. The radar cross sections of the pixels within a sample area are averaged to provide the backscattering coefficient (or ‘backscatter’) for a given area. The advantage of using backscatter is that a meaningful number is used to represent the microwave return from the ice (as opposed to qualitatively describing the ice signature). The backscattering coefficient enables a quantitative comparison between the ice in the same scene and in SAR scenes obtained from
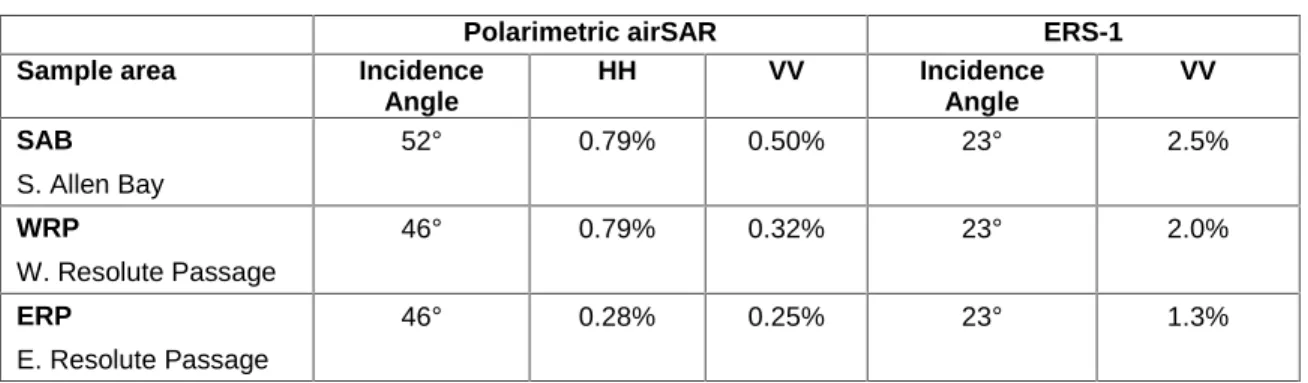
The backscatter of the sample areas SAB, WRP and ERP from the ERS-1 image and the airSAR polarimetric images (HH and VV) is shown in Table 1. Generally, the backscatter is expressed in decibels (dBs). Since it can be difficult to relate to the decibel scale, the backscatter from the sample areas was expressed in terms of the percent return (outgoing energy to incoming energy).
62° 60° 57° 52° 46° 41° 6°
Incidence angle Direction of aircraft flight
Cornwallis Island
May Island North
SAB
WRP ERP
Figure 2 HH microwave image from Polarimetric airSAR (3 May 1993)
62° 60° 57° 52° 46° 41° 6°
Incidence angle Direction of aircraft flight SAB
WRP ERP
Mombetsu, Hokkaido, Japan Table 1 Backscattering Coefficient for Selected Sample Areas
Polarimetric airSAR ERS-1 Sample area Incidence
Angle HH VV Incidence Angle VV SAB S. Allen Bay 52° 0.79% 0.50% 23° 2.5% WRP W. Resolute Passage 46° 0.79% 0.32% 23° 2.0% ERP E. Resolute Passage 46° 0.28% 0.25% 23° 1.3%
Table 1 shows that the microwave returns obtained from the ERS-1 image were more than twice as high as the returns obtained from the same sample areas in the airSAR polarimetric images. The higher backscattering coefficient in the ERS-1 image resulted from the different incidence angles between the two systems (23° versus 46° to 52°) as discussed in Johnston (1998). Note that in the ERS-1 image the highest return came from the ice in southern Allen Bay (2.5%) in comparison to the 1.3 to 2.0% return from ice in Resolute Passage.
As for the polarimetric airSAR, the horizontally like polarized return (HH) was consistently higher than the vertically like polarized return (VV) and the cross polarized return (HV, not shown). The most obvious difference was seen in ice from WRP and ERP in the HH image (0.79% versus 0.28% respectively). There was a distinct dividing line between the two regions in the HH image (Figure 2, light and dark contrast between WRP and ERP).
Physical Properties of Ice from Selected Sample Areas
Cores were removed from the surface layer (uppermost 0.3 m) of the ice in the three sampled areas from SAB, WRP and ERP. The ice cores were extracted during the first week of May, when the daily average air temperature was below –12°C. Temperature measurements of the cores showed that the top ice had a temperature of about –12oC and decreased to –9oC at a depth of 0.3 m (Johnston, 1998). The ice classified as cold, winter sea ice with an insulating layer of dry snow. Under those conditions, the microwave return from the ice was due to the ice properties rather than the overlying snow cover (considered transparent to the incident microwave energy).
Ice from Southern Allen Bay
The salinity of the surface core from southern Allen Bay was measured with an optical refractometer. The top ice had a salinity of 7 ‰ that decreased to a relatively uniform value of 4 to 5 ‰ throughout the remainder of the 0.3 m long surface core. The ice density was calculated using the bulk volume technique; the core was sectioned at regular intervals and the weight and sample dimensions were taken. The core from southern Allen Bay had a density of 0.89 Mg/m3 at the surface that increased to about 0.92 Mg/m3 with increasing depth (Figure 4).
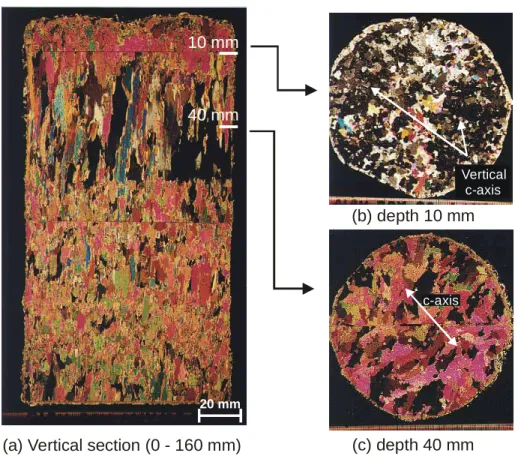
The microstructure of the ice from southern Allen Bay was examined by preparing thin sections of ice using the Double Microtoming Method (Sinha, 1977) in a cold room at –12°C. The vertical thin section of ice from southern Allen Bay was characterized by alternating layers of short tabular ice pieces punctuated by narrow columnar grains (Figure 5a). This type of ice is best defined as discontinuous, vertically arranged frazil. The frazil particles became vertically arranged under the influence of the prevailing current. The horizontal thin section from an ice depth of 10 mm was dominated by grains with a vertical c-axis, as shown by the consistently dark grains under every orientation of the crossed polarizers (Figure 5b). The section from a depth of 40 mm showed that the c-axis of the grains was preferentially aligned in the horizontal plane (Figure 5c).
0 0.1 0.2 0.3 0.4 0 2 4 6 8 10 12 14 Ice Salinity (‰) Ic e D e p th ( m ) SAB ERP WRP 0 0.1 0.2 0.3 0.4 0.85 0.90 0.95 1.00 Ice Density (Mg/m³) Ic e D e pt h ( m ) SAB WRP, ERP
(a) Salinity (b) Density
Figure 4 Salinity and Density of Ice from Sample Areas
(b) depth 10 mm
Vertical c-axis
c-axis
(c) depth 40 mm
(a) Vertical section (0 - 160 mm)
10 mm
40 mm
20 mm
Mombetsu, Hokkaido, Japan Ice from Western and Eastern Resolute Passage
The salinity and density profiles for the first-year ice from western and eastern Resolute Passage are shown in Figure 4. The salinity profiles for each site ranged from 5 to 11‰. Of especial importance is the relative difference in the ice salinity for the two adjacent sites (WRP and ERP). The salinity of the ice in western Resolute Passage (WRP) was less than the ice in eastern Resolute Passage (ERP) to a depth of 80 mm. Below that depth the two salinity profiles crossed over and the trend reversed; the ice salinity of WRP exceeded ERP. The density profiles from the two sites showed extremely uniform measurements of 0.92 Mg/m³ with increasing depth (Figure 4 b).
Information about the microstructure of ice from western and eastern Resolute Passage is not available. The ice microstructure can be conjectured using the microstructure from other sites in Resolute Passage (sampled in 1993 and in previous years). Typically, the turbulent conditions of Resolute Passage result in discontinuous frazil (similar to ice shown above from southern Allen Bay).
Discussion
Visual inspection of the microwave image from ERS-1 showed that the ice first-year ice in southern Allen Bay differed from the first-year ice in Resolute Passage. The difference was quantified by calculating the backscattering coefficient for three sample areas. The vertically polarized (VV) ERS-1 image revealed that the ice in Allen Bay returned 2.5% of the incident energy, whereas the ice from the two sample areas in Resolute Passage returned 2.0% and 1.3%. The discrepancy between the two adjacent sample areas in Resolute Passage was further examined using images from the polarimetric airSAR. The polarimetric airSAR data resulted in returns that were consistently lower than the ERS-1 image. The lower returns were attributed to the different incidence angles of the two systems; 46° to 52° for the airSAR and about 23° for ERS-1.
Generally speaking, the scattering of first-year ice is restricted to the top 100 mm. Ice properties below that depth do not influence the backscattering coefficient. First-year ice in southern Allen Bay had the lowest salinity (average of 5 ‰ in the uppermost 100 mm) and the lowest surface-layer density (0.90 Mg/m²) of the examined first-year ice sites. The preferential alignment of the c-axis in southern Allen Bay caused the brine inclusions to have an orientation that was parallel to the plane of incident microwave energy from the airSAR. The brine inclusions had a lesser effect upon microwave absorption in a parallel orientation than had they been aligned perpendicular to the plane of transmitted energy. In summary, the ice in southern Allen Bay had a low salinity, low density (increased amount of entrained air) and an optimal arrangement of brine inclusions. Those three factors resulted in that ice having the highest HH, VV and HV returns of any first-year sites examined from the polarimetric data (7 sample areas of first-year ice were examined in Johnston, 1998).
All instances in which the polarimetric returns were examined showed the horizontal like-polarized return (HH) to exceed the vertical like-like-polarized return (VV). Does the increased return of HH (compared to VV) result from surface scattering or does it result from volumetric scattering? That question is best answered by examining the two adjacent sample areas from Resolute Passage. The sample area from Resolute Passage that had a low surface salinity had an HH return of 0.79%. The more saline ice in Resolute Passage had an HH return 0.28%. The VV returns were comparable for the two areas (0.32% versus 0.25%). Since there was a difference in HH return but not the VV return, it appears that horizontally polarized energy is more sensitive to the internal characteristics of the ice than vertically polarized energy.
Conclusions
This paper showed the influence that ice properties such as salinity, density and microstructure have upon the microwave scattering characteristics of sea ice. Microwave images obtained from ERS-1 were compared with images acquired from an airborne polarimetric SAR. The comparison revealed that the same sample areas in each image had measurable differences in their backscattering coefficients. The multi-polarization of the polarimetric SAR provided valuable information about the internal properties of the ice than did the single-polarization SAR. Horizontally polarized energy more readily penetrates the ice surface than does vertically polarized energy, as illustrated by the comparing the backscatter of three sample areas. The significance of the enhanced penetration of horizontally polarized energy is that it provides more information about the internal properties of the scattering layer of ice.
Acknowledgements
Financial support of this work was provided by the Natural Sciences and Engineering Research Council (NSERC). The polarimetric airSAR data noted here were kindly provided by the Canada Centre for Remote Sensing. Special thanks to C. Livingstone for the many useful discussions on polarimetric studies and image calibration methodologies.
References
Bjerkelund, C.A., D.J. Lapp, R.O. Ramseier and N.K. Sinha (1985) “The Texture and Fabric of the Second Year Sea Ice Cover at Mould Bay, Prince Patrick Island, NWT, April, 1983”, in Proceedings of International Geoscience and Remote Sensing Symposium (IGARRS’85), pp. 426 – 431.
Johnston, M. (1998) Ice Microstructure and its Influence upon the Microwave Scattering Properties of Sea Ice, Ph.D. thesis with Faculty of Science and Engineering, Université Laval, Québec, Canada, October, 1998, 300 p.
Johnston, M. and N.K. Sinha (2000) “Influence of Microstructure upon the Microwave Backscattering Coefficient of Natural Sea Ice: Case Study”, paper included in proceedings of World Meteorological Organization and Canadian Ice Working Group Workshop: Mapping and Archiving of Sea Ice Data, 2 – 4 May 2000, Ottawa, Canada, 6 pp. (in press).
Poe, G. A., A. Stogryn, A. Edgerton, and R.O. Ramseier (1974) Study of Microwave Emissive Properties of Sea Ice, Tech. Rep. 1804FR-1, Aerojet Electrosystems Co., Azusa, CA.
Shokr, M. and N.K. Sinha (1992 (a)) “Sea Ice Microstructural Characteristics Relevant to Ice Microwave Scattering”, in Proc. of 11th Int. Conf. on Offshore Mechanics and Arctic Engineering (OMAE’92), ASME, New York, Vol. 4, pp. 319 – 327.
Shokr, M. and N.K. Sinha (1992 (b)) “Arctic Sea Ice Microstructure Observations Relevant to Microwave Scattering”, Arctic, September 1994, Vol. 47, No. 3, pp. 265 – 279.
Sinha, N.K. (1977) “Instruments and Methods: Technique for Studying Structure of Sea Ice”,
Journal of Glaciology, Vol. 18, No. 79, pp. 315-323.
Sinha, N.K. and M. Shokr (1999) “Field Validation of ERS-1 SAR Images of Sea Ice in Resolute Region”, in Proc. of 18th Int. Conf. on Offshore Mechanics and Arctic Engineering (OMAE’99),