HAL Id: hal-02990931
https://hal.archives-ouvertes.fr/hal-02990931
Preprint submitted on 9 Nov 2020
HAL is a multi-disciplinary open access archive for the deposit and dissemination of sci-entific research documents, whether they are pub-lished or not. The documents may come from teaching and research institutions in France or abroad, or from public or private research centers.
L’archive ouverte pluridisciplinaire HAL, est destinée au dépôt et à la diffusion de documents scientifiques de niveau recherche, publiés ou non, émanant des établissements d’enseignement et de recherche français ou étrangers, des laboratoires publics ou privés.
Changwei Yu, Nevena Cvetesic, Kapil Gupta, Tao Ye, Emese Gazdag, Vincent
Hisler, Luc Negroni, Petra Hajkova, Boris Lenhard, Ferenc Müller, et al.
To cite this version:
Changwei Yu, Nevena Cvetesic, Kapil Gupta, Tao Ye, Emese Gazdag, et al.. TBPL2/TFIIA complex overhauls oocyte transcriptome during oocyte growth. 2020. �hal-02990931�
TBPL2/TFIIA complex overhauls oocyte transcriptome during oocyte growth
1 2 3
Changwei Yu1,2,3,4, Nevena Cvetesic5, Kapil Gupta6, Tao Ye1,2,3,4, Emese
4
Gazdag1,2,3,4, Vincent Hisler1,2,3,4, Luc Negroni1,2,3,4, Petra Hajkova5, Boris Lenhard5,
5
Ferenc Müller7, Imre Berger6, Stéphane D. Vincent1,2,3,4,*,# and László Tora1,2,3,4,*,#
6
1Institut de Génétique et de Biologie Moléculaire et Cellulaire, 67404 Illkirch, France;
7
2Centre National de la Recherche Scientifique (CNRS), UMR7104, 67404 Illkirch, France;
8
3Institut National de la Santé et de la Recherche Médicale (INSERM), U1258, 67404 Illkirch,
9
France; 10
4Université de Strasbourg, 67404 Illkirch, France;
11
5Imperial College London, South Kensington Campus, London SW7 2AZ, UK;
12
6Max Planck Bristol Centre for Minimal Biology, University of Bristol, Cantock's Close,
13
Bristol BS8 1TS, UK. 14
7Institute of Cancer and Genomic Sciences, College of Medical and Dental Sciences, University
15
of Birmingham, UK; 16
17
# These authors contributed equally to this work
18 19
*Co-corresponding authors: S.D.V. [email protected] and L.T. [email protected]
20 21
The first steps of oocyte development from primordial follicle are characterised by a
1
growth phase, when unique RNA and protein reserves are created to achieve oocyte
2
competence. During this growth, oocytes do not divide and the general transcription
3
factor TATA binding protein (TBP) is replaced by its paralogue, TBPL2 (also called TBP2
4
or TRF3), which is essential for RNA polymerase II transcription (Pol II) 1,2. However,
5
the composition and function of transcription machinery and the regulatory mechanisms
6
mediating Pol II transcription during this developmental stage remain unknown. In
7
somatic cells, the general transcription factor TFIID, which contains TBP and 13
TBP-8
associated factors, is the first to bind gene promoters to nucleate Pol II transcription
9
initiation3. Here, we show that in oocytes TBPL2 does not assemble into a canonical TFIID
10
complex, while it stably associates with TFIIA via distinct TFIIA interactions when
11
compared to TBP. Our transcript analyses in wild type and Tbpl2-/- oocytes demonstrates
12
that TBPL2 mediates transcription of oocyte-expressed genes, including mRNA
13
destabilisation factors genes, as well as specific endogenous retroviral elements (ERVs).
14
Transcription start site (TSS) mapping from wild-type and Tbpl2-/- growing oocytes
15
demonstrates that TBPL2 has a strong preference for TATA-like motif in gene core
16
promoters driving specific sharp TSS selection. This is in marked contrast with
17
TBP/TFIID-driven TATA-less gene promoters in preceding stages that have broad TSS
18
architecture. We anticipate that our findings describing oocyte-specific transcription
19
regulation will help to understand the mechanisms associated with primary ovarian
20
insufficiency, which constitutes a frequent cause of infertility among women.
21 22
Pol II transcription requires the stepwise assembly of multi-protein complexes called 23
general transcription factors (GTFs) and Pol II4. The evolutionary conserved TFIID complex
24
plays a major role in transcription initiation as it is the first GTF to initiate the assembly of the 25
pre-initiation complex (PIC) by recognizing the core promoter5,6. TFIID is a large multi-protein
1
complex composed of the TATA box-binding protein (TBP) and 13 TBP-associated factors 2
(TAFs) in metazoa7. The model suggesting that transcription is always regulated by the same
3
transcription complexes has been challenged in metazoans by the discovery of cell-type specific 4
complexes containing specialized GTF-, TBP- or TAF-paralogs3,8,9. However, how alternative
5
initiation complexes form and how they regulate cell type-specific transcription remains 6
unknown. During oocyte growth TBP is absent and replaced by a vertebrate-specific TBP-7
related factor, TBPL2, required for female fertility1,2,10. During this phase the oocyte
8
transcriptome is overhauled in a TBPL2-dependent manner. Importantly, Pol II transcription is 9
blocked during oocyte growth in the absence of TBPL22.
10 11
TBPL2 forms an oocyte-specific complex with TFIIA different from TFIID
12
To characterize TBPL2-containing transcription complexes we prepared whole cell 13
extracts (WCE) from 14 days post-natal (P14) mouse ovaries and analysed TBPL2-associated 14
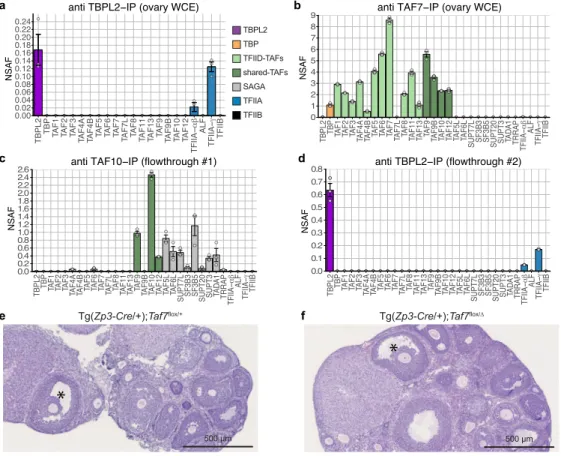
proteins by anti-mTBPL2 immunoprecipitation (IP) coupled to label free mass spectrometry 15
(Fig. 1a, Extended Data Fig. 1a, b). We identified TFIIA-ab and TFIIA-g subunits as unique 16
GTF subunits associated with TBPL2 (Fig. 1a, Supplementary Table 1). In parallel, anti-TBP 17
IP from the same extracts showed that TBP assembles into the canonical TFIID complex in 18
non-oocyte cells present in large excess in the ovary (Extended Data Fig. 1c, Supplementary 19
Table 2). To determine the stoichiometry of the composition of the immunoprecipitated 20
complexes, normalized spectral abundance factor (NSAF) values were calculated11. As growing 21
oocytes represent only a tiny minority of ovary cells, we further tested the TBPL2-TFIIA 22
interaction by a triple IP strategy: first, we depleted TAF7-containing TFIID complexes with 23
an anti-TAF7 IP, second, the remaining TFIID and SAGA complexes, which contain also some 24
shared TAFs12, were depleted with an anti-TAF10 IP using the anti-TAF7 IP flow-through as
an input, third we performed an anti-TBPL2 IP on the anti-TAF7/anti-TAF10 flow-through 1
fraction (Fig. 1b-d, Extended Data Fig. 1d, Supplementary Table 3). The analysis of this third 2
consecutive IP further demonstrated that TBPL2 forms an unique complex with TFIIA-ab, and 3
TFIIFA-g, but without any TFIID subunits. To further analyse the requirement of TFIID during 4
oocyte growth, we carried out a conditional deletion of TFIID-specific Taf7 gene during oocyte 5
growth using the Zp3-Cre transgenic line13. The oocyte-specific deletion of Taf7 did not affect
6
the presence of secondary and antral follicles and the numbers of collected mature oocytes after 7
superovulation (Fig. 1e, f, Extended Data Fig. 1e). Thus, the TBPL2-containing transcription 8
complex does not require TFIID TAFs for its function during oocyte growth. These results 9
together show that during oocyte growth a stable TBPL2-TFIIA complex forms, and may 10
function differently from TBP/TFIID. 11
12
Structure/function characterization of the TBPL2/TFIIA complex
13
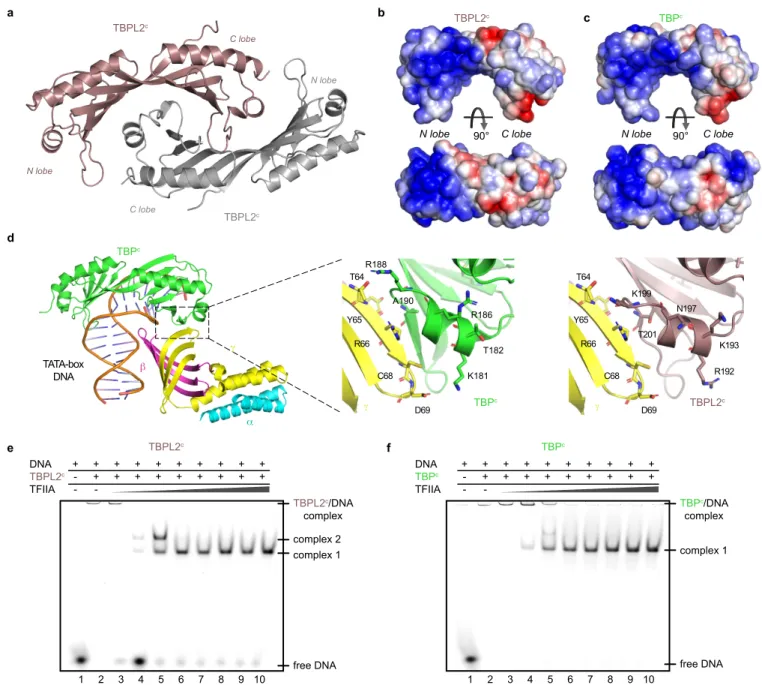
Next, we determined the X-ray crystal structure of the mouse TBPL2 core domain 14
(TBPL2C) (Fig. 2a, Supplementary Table 4). The 2Å structure reveals a TBPL2C dimer
15
reminiscent of the dimer observed in TBP core (TBPC) crystals14,15. TBPL2C forms a
pseudo-16
symmetric bi-lobal fold similar to TBPC (Extended Data Fig. 2a). The respective electrostatic
17
surface charge distributions show that while TBPL2C and TBPC exhibit similarly basic charges
18
of their N-terminal lobes and DNA binding concave surfaces, their central regions and C 19
terminal lobes are markedly different, with TBPL2C shifted towards acidic charge (Fig. 2b, c,
20
Extended Data Fig. 2b, c). Based on the crystal structure of TBPC in complex with TATA box
21
DNA and a crystallisable core of TFIIA (TFIIAC)16, we modelled the TBPL2C-TFIIAC
22
interactions (Fig. 2d). The resulting model suggests that TBPL2C has a conserved, but not
23
identical interaction interface with the TFIIA-g chain when compared with TBPC.
We next analysed the functional interactions of TBPL2C with full-length processed TFIIA
1
and adenovirus major late promoter TATA box DNA by electrophoretic mobility shift assay 2
(EMSA) (Fig. 2e, f, Extended Data. Fig. 2d, e). Preformed TBPL2/DNA complex was 3
supplemented with increasing amounts of processed TFIIA-α, -β and TFIIA-g (Fig. 2e). 4
Unexpectedly, we observed two shifted complexes in EMSA (labelled complex 1 and 2 in Fig. 5
2e), but complex 2 was barely noticeable when TBPC was used (Fig. 2f). Intriguingly, when
6
only low amounts of TFIIA were added, a prominent band corresponding to free DNA 7
reproducibly re-emerged in the TBPL2C EMSA experiment, disappearing again when
8
increasingly more TFIIA was supplied (Fig. 2e). No such re-emergence of free DNA was 9
observed with TBPC (Fig. 2f). Our analyses together suggest that TBPL2C can bind differently
10
to TFIIA in the presence of canonical TATA box DNA, as compared to TBPC.
11 12
TBPL2-dependent oocyte transcriptome
13
To characterize the growing oocyte-specific transcriptome and its dependence on TBPL2, 14
we have performed a transcriptomic analysis of wild-type (WT) and Tbpl2-/- oocytes isolated
15
from primary and secondary follicles [post-natal day (P) 7 and P14] (Fig. 3, Supplementary 16
Table 5). We observed down-regulation of a number of oocyte-specific genes, such as Bmp15 17
and Gdf917,18 (Fig. 3a, b and Extended Fig. 3a). Principal component analysis showed that the
18
four distinct RNA samples clustered in individual groups and that the main explanation for the 19
variance is the genotype, and then the stage (Extended Data Fig. 3b). Comparison of the RNA 20
level fold changes between mutant and WT oocytes showed that in Tbpl2-/-, there is a massive
21
down-regulation of the most highly expressed transcripts, both at P7 and P14 (Extended Data 22
Fig. 3c). The Pearson correlation between the P7 and P14 fold change data sets for transcripts 23
expressed above 100 normalized reads was close to 0.8, indicating that Tbpl2 loss of function 24
similarly altered RNA levels at P7 and P14 stages. We therefore focused on the P14 stage for 1
the rest of the study. 2
In WT P14 oocytes transcripts corresponding to 10791 genes were detected. Importantly, 3
many of these detected transcripts have been transcribed at earlier stages and are stored in 4
growing oocytes19. As there is no Pol II transcription in Tbpl2-/- growing oocytes2, RNAs
5
detected in the Tbpl2-/- mutant oocytes represent mRNAs transcribed by a
TBP/TFIID-6
dependent mechanism and deposited into the growing oocytes independently of TBPL2 activity 7
at earlier stages. The proportion of genes (1396) upregulated following Tbpl2 deletion (Fig. 3c) 8
can be explained by two mutually not exclusive ways: i) the consequence of the normalization 9
to the library size resulting in the over-estimation of up-regulated transcripts, and under-10
estimation of down-regulated transcripts and/or by transcript buffering mechanisms due to 11
mRNA stabilization20. Validation of the up-regulation of some candidate transcripts levels
12
(Extended Data Fig. 3d, e) strongly supports the latter hypothesis. 13
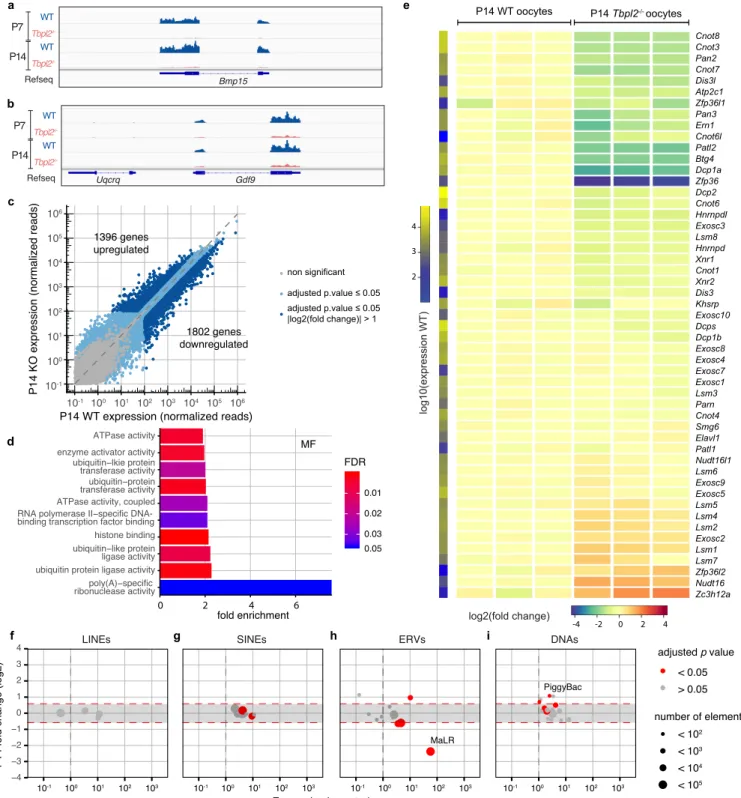
Nevertheless, we detected 1802 significantly downregulated transcripts in the Tbpl2
-/-14
oocytes (Fig. 3c). Key genes known to be expressed during oocyte growth, such as Bmp15, 15
Eloc, Fgf8, Gdf9 and Zar117,18,21, were confirmed to be down-regulated (Extended Data Fig. 3f,
16
g). These results suggest that TBPL2 has an important role in gene expression in the growing 17
oocytes. Gene Ontology (GO) analyses of biological process of the identified down regulated 18
categories of genes (Supplementary Table 6) indicated that many genes involved in meiosis II 19
and distinct cell cycle processes were significantly down-regulated (Extended Data. Fig. 3h). 20
The most enriched molecular function GO category was “poly(A)-specific ribonuclease 21
activity” containing many genes coding for factors or subunits of complexes contributing to 22
deadenylation/decapping/decay activity in eukaryotes (Fig. 3d) (i.e. CCR4-NOT, 23
PAN2/PAN322; DCP1A/DCP223, or BTG421). Transcripts coding for these “poly(A)-specific
24
ribonuclease activity” factors were significantly down regulated in Tbpl2-/- mutant P14 oocytes
(Fig. 3e, Extended Data. Fig. 3i). Thus, in P14 oocytes TBPL2 is regulating the transcription of 1
many genes coding for factors, which are crucial in regulating the stability and translation of 2
the mRNA stock deposited during early oogenesis, as well as transcription of meiosis II- and 3
cell cycle-related genes to prepare the growing oocytes for the upcoming meiotic cell division. 4
A remarkable feature of oocyte is the very high expression of retrotransposons driven by 5
Pol II transcription. There are three major classes of retrotransposons in mammals: long 6
interspersed nuclear elements, short interspersed nuclear elements and ERVs. There are three 7
main sub-classes of ERVs: ERV1, ERVK and endogenous retrovirus like ERVL-MaLR24. As
8
expected, in WT P14 oocytes the expression of ERVs was found to be the most abundant25,26
9
(Extended Data Fig. 3j, k). Importantly, the transcription of the vast majority of MaLR elements 10
was the most affected in Tbpl2-/- mutant oocytes (Fig. 3f-i). Among them, three highly expressed
11
members, MT-int, MTA_Mm, and MTA_Mm-int, were dramatically down-regulated in P14 12
Tbpl2-/- mutant oocytes (Extended Data Fig. 3l). As in P14 oocytes TBPL2 depletion is reducing
13
transcription more than 4-fold from MaLR ERVs, which often serve as promoters for 14
neighbouring genes25,26, TBPL2 could seriously deregulate oocyte-specific transcription and
15
consequent genome activation. 16
Therefore, TBPL2 is important for the de novo restructuration of the oocyte transcriptome 17
and indirectly for silencing the translation of the TBP-dependent earlier deposited transcripts. 18
19
TBPL2-driven promoters are TATA box-containing with sharp TSS selection
20
The promoter usage changes during zebrafish maternal to zygotic transition revealed 21
different rules of transcriptional initiation in oocyte and in embryo, driven by independent and 22
often overlapping sets of promoter “codes”27. This switch has not yet been demonstrated in
23
mammals and the role of TBPL2 during oogenesis remained to be investigated. To this end, we 24
mapped the TSS usage by carrying out super-low input carrier-CAGE (SLIC-CAGE)28 from
WT and Tbpl2-/- P14 oocytes. To characterize only the TBPL2-driven promoters we removed
1
the CAGE tags present in the Tbpl2-/- dataset from the WT P14 dataset, to eliminate transcripts
2
that have been deposited at earlier stages (hereafter called “TBPL2-specific-only”). Conversely, 3
the Tbpl2-/- dataset corresponds to the TBP/TFIID or TBPL2-independent-only TSSs (hereafter
4
called “TBPL2-independent-only”). 5
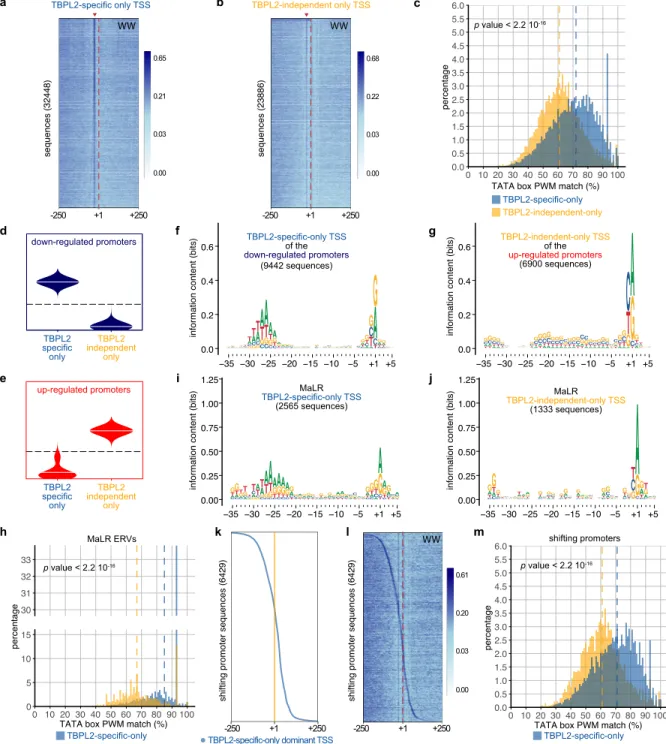
Next, we analysed the genome-wide enrichment of T- and/or A-rich (WW) dinucleotide 6
motifs within the -250/+250 region centred on the dominant TSSs of the TBPL2-specific-only 7
and TBPL2-independent-only oocyte TSS clusters (Fig. 4a, b). TBPL2-specific-only TSS 8
clusters are strongly enriched in a well-defined WW motif around their -30 bp region (Fig. 4a, 9
read arrowhead) (see also Cvetesic et al., in submission). In contrast, only about 1/3rd of the
10
TBPL2-independent-only TSS clusters contained WW-enriched motifs at a similar position 11
(Fig. 4b, read arrowhead), as would be expected from promoters that lack maternal promoter 12
code determinants27 (Cvetesic et al., in submission). As canonical TATA boxes are often
13
associated with tissue-specific gene promoters, we investigated whether the above observed 14
WW motif densities correspond to TATA boxes using the TBP position weight matrix (PWM) 15
from the JASPAR database as a reference. To this end the presence of TATA boxes was 16
analysed in the TSS clusters of the two data sets and revealed that TBPL2- specific-only TSS 17
clusters were enriched in high quality TATA boxes, including a clear increase in the proportion 18
of canonical TATA boxes, when compared to TBPL2-independent-only TSS clusters (Fig. 4c). 19
Depending on promoter sequence motifs, transcription initiation can occur within a narrow 20
region with a major dominant TSS, or within a less defined region containing a wider 21
distribution of TSSs, leading to the distinction of “sharp” and “broad” TSS-type initiation, 22
respectively29. Genome browser view snapshots indicate that TSS clusters in P14 WT oocytes
23
tend to be sharp and are associated with TATA-like motifs (Extended Data. Fig. 4a, b). Analysis 24
of the global distribution of the number of TSSs and of the width of the TSS clusters in the 25
above defined two categories confirmed that TBPL2- specific-only TSS are sharper compared 1
to the TBPL2-independent-only TSS clusters (Extended Data Fig. 4c, d). 2
In order to test whether TBPL2 controls transcription initiation from maternal promoter 3
code determinants, we grouped the expression profiles corresponding to each consensus TSS 4
clusters, to characterise promoter activity profiles among datasets by performing self-5
organizing maps (SOM) (Extended Data Fig. 4e). We then focussed on the two most distinct 6
SOM groups: the down-regulated promoters (blue group, containing 9442 consensus TSS 7
clusters) (Fig. 4d) and the up-regulated promoters (red group, with 6900 consensus TSS 8
clusters) (Fig. 4e). Motif analyses of these two categories of promoters in their -35/+5 regions 9
relative to the different dominant TSSs indicated that only the core promoters associated to 10
TBPL2-specific-only dominant TSSs belonging to the down-regulated gene promoters contain 11
a well-defined 7 bp long TATA box-like motif (W-box) in their -31 to -24 regions (Fig. 4f, g, 12
Extended Data Fig. 4f-i). Importantly, W-box associated TSSs architecture usage distribution 13
for these TBPL2-specific-only dominant TSSs was sharp (Extended data Fig. 4j, l), as expected 14
for motif-dependent transcriptional initiation27 (Cvetesic et al., in submission). In contrast,
15
TBPL2-independent-only TSSs belonging to the up-regulated promoters exert a much broader 16
TSS pattern (Extended Data Fig. 4k, m). Interestingly, GO analyses of the genes associated 17
with the down-regulated promoters revealed a strong association with
18
deadenylation/decapping/decay activity (Extended Data Fig. 4n-p, Supplementary Table 7), 19
further confirming our initial RNA-seq analysis observations (Fig. 3). 20
Importantly, TSS architecture analyses of the TBPL2-specific-only MaLR ERV TSSs 21
indicated that the majority of MaLR core promoters contain high quality TATA box motif 22
(median of the TATA box PWM match is 85%, Fig. 4i, j). These observations together 23
demonstrate that the TBPL2-TFIIA complex drives transcription initiation primarily from core 24
promoters that contain a TATA box-like motif in their core promoter and directs sharp 25
transcription initiation from the corresponding promoter regions to overhaul the growing oocyte 1
transcriptome. 2
In addition, we observed that TSS usage can shift within the promoter of individual genes 3
depending on the genetic background (Extended Data Fig. 4b). To get more insights in these 4
promoter architecture differences, we identified genome-wide 6429 shifting promoters by 5
comparing either TBPL2-specific-only to TBPL2-independent-only TSS data. These results are 6
consistent with TSS shifts between somatic and maternal promoter codes (Cvetesic et al., in 7
submission) occurring either in 5’, or 3’ directions (Fig. 4k, Extended Data Fig. 4q). WW motif 8
analysis indicated that on each shifting promoter, TBPL2-specific-only dominant TSSs are 9
associated with WW motifs, while TBPL2-independent-only dominant TSSs are not (Fig. 4l). 10
In addition, the TATA box PWM match analyses indicated that these WW motifs are enriched 11
in TATA box like elements compared to the corresponding TBPL2-independent-only shifting 12
TSSs (Fig. 4m). Thus, our experiments provide a direct demonstration that TBP/TFIID and 13
TBPL2/TFIIA machineries recognize two distinct sequences co-existing in promoters of the 14
same genes with TBPL2 directing a stronger WW/TATA box-dependent TSS selection in them. 15
16
Discussion
17
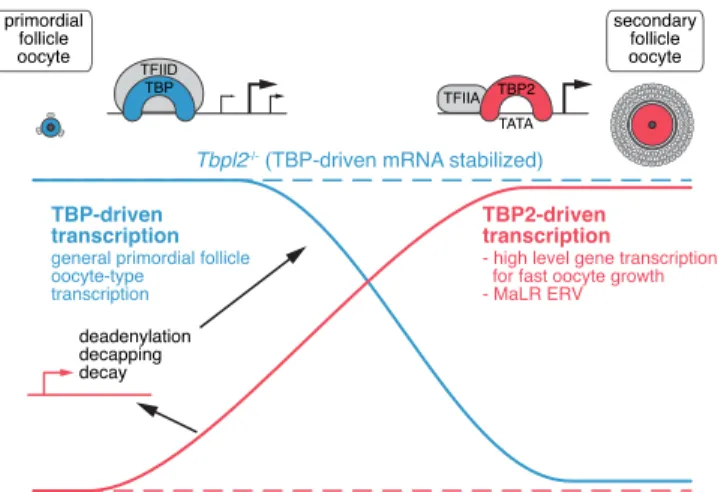
In conclusion, our results demonstrate that in growing oocytes TFIID (TBP/TAFs) is 18
replaced by a non-canonical TBPL2/TFIIA complex that uses canonical TATA box-containing 19
core promoters to drive oocyte-specific sharp TSS-transcription initiation. Thus, the 20
TBPL2/TFIIA complex is a key regulator of growing oocyte-specific transcription, including 21
the high expression of MaLR ERVs, by creating a novel transcriptome pool, consisting of new 22
TBPL2-dependent transcripts and TBP/TFIID-dependent transcripts deposited earlier during 23
the primordial follicle stage (Fig. 5). Importantly, to block the translation of mRNAs deposited 24
at the earlier developmental stage, TBPL2 is regulating the activity of several 25
deadenylation/decapping/decay complexes, which further contributes to establishing the novel 1
TBPL2-dependent growing oocyte transcriptome and consequent proteome required for further 2
development and oocyte competence for fertilization (Fig. 5). The indirect regulation of 3
previously deposited mRNAs by a global transcription regulator resembles the well 4
characterised maternal to zygotic transition (MZT), during which a clearance of inherited 5
transcriptome is mediated by de novo gene products generated by newly activated transcription 6
machinery30-32. At hundreds of gene promoters, two distinct TSS-defining “grammars” co-exist
7
in close proximity genome-wide and are differentially utilised in either TBPL2/TFIIA in 8
primary/secondary follicular oocytes or by TBP/TFIID in primordial follicular oocytes. This 9
again shows a striking parallel to MZT27, where multiple layers of information are embedded
10
in the same promoter sequence, each representing a different type of regulatory grammar 11
interpreted by dedicated transcription machinery depending on the cellular environment. 12
13
Main references
14
1. Gazdag, E., Rajkovic, A., Torres-Padilla, M.-E. & Tora, L. Analysis of TATA-binding 15
protein 2 (TBP2) and TBP expression suggests different roles for the two proteins in 16
regulation of gene expression during oogenesis and early mouse development. 17
Reproduction 134, 51–62 (2007).
18
2. Gazdag, E. et al. TBP2 is essential for germ cell development by regulating 19
transcription and chromatin condensation in the oocyte. Genes Dev 23, 2210–2223 20
(2009). 21
3. Goodrich, J. A. & Tjian, R. Unexpected roles for core promoter recognition factors in 22
cell-type-specific transcription and gene regulation. Nat Rev Genet 11, 549–558 23
(2010). 24
4. Roeder, R. G. 50+ years of eukaryotic transcription: an expanding universe of factors 1
and mechanisms. Nat Struct Mol Biol 26, 783–791 (2019). 2
5. Vo Ngoc, L., Wang, Y.-L., Kassavetis, G. A. & Kadonaga, J. T. The punctilious RNA 3
polymerase II core promoter. Genes Dev 31, 1289–1301 (2017). 4
6. Haberle, V. & Stark, A. Eukaryotic core promoters and the functional basis of 5
transcription initiation. Nat Rev Mol Cell Biol 19, 621–637 (2018). 6
7. Tora, L. A unified nomenclature for TATA box binding protein (TBP)-associated 7
factors (TAFs) involved in RNA polymerase II transcription. Genes Dev 16, 673–675 8
(2002). 9
8. Müller, F., Zaucker, A. & Tora, L. Developmental regulation of transcription initiation: 10
more than just changing the actors. Curr Opin Genet Dev 20, 533–540 (2010). 11
9. Akhtar, W. & Veenstra, G. J. C. TBP-related factors: a paradigm of diversity in 12
transcription initiation. Cell Biosci 1, 23 (2011). 13
10. Malecova, B. et al. TBP/TFIID-dependent activation of MyoD target genes in skeletal 14
muscle cells. Elife 5, 23 (2016). 15
11. Zybailov, B. et al. Statistical analysis of membrane proteome expression changes in 16
Saccharomyces cerevisiae. J. Proteome Res. 5, 2339–2347 (2006). 17
12. Helmlinger, D. & Tora, L. Sharing the SAGA. Trends Biochem. Sci. 42, 850–861 18
(2017). 19
13. Lewandoski, M., Wassarman, K. M. & Martin, G. R. Zp3–cre, a transgenic mouse line 20
for the activation or inactivation of loxP-flanked target genes specifically in the female 21
germ line. Current Biology 7, 148–151 (1997). 22
14. Chasman, D. I., Flaherty, K. M., Sharp, P. A. & Kornberg, R. D. Crystal structure of 23
yeast TATA-binding protein and model for interaction with DNA. Proceedings of the 24
National Academy of Sciences 90, 8174–8178 (1993).
15. Nikolov, D. B. & Burley, S. K. 2.1 A resolution refined structure of a TATA box-1
binding protein (TBP). Nat. Struct. Biol. 1, 621–637 (1994). 2
16. Bleichenbacher, M., Tan, S. & Richmond, T. J. Novel interactions between the 3
components of human and yeast TFIIA/TBP/DNA complexes. J Mol Biol 332, 783– 4
793 (2003). 5
17. Dong, J. et al. Growth differentiation factor-9 is required during early ovarian 6
folliculogenesis. Nature 383, 531–535 (1996). 7
18. Galloway, S. M. et al. Mutations in an oocyte-derived growth factor gene (BMP15) 8
cause increased ovulation rate and infertility in a dosage-sensitive manner. Nat Genet 9
25, 279–283 (2000).
10
19. Bettegowda, A. Mechanisms of maternal mRNA regulation: implications for 11
mammalian early embryonic development. Frontiers in Bioscience 12, 3713 (2007). 12
20. Timmers, H. T. M. & Tora, L. Transcript Buffering: A Balancing Act between mRNA 13
Synthesis and mRNA Degradation. Mol Cell 72, 10–17 (2018). 14
21. Yu, C. et al. BTG4 is a meiotic cell cycle–coupled maternal-zygotic-transition 15
licensing factor in oocytes. Nat Struct Mol Biol 23, 387–394 (2016). 16
22. Wolf, J. & Passmore, L. A. mRNA deadenylation by Pan2-Pan3. Biochem. Soc. Trans. 17
42, 184–187 (2014).
18
23. Ma, J., Flemr, M., Strnad, H., Svoboda, P. & Schultz, R. M. Maternally recruited 19
DCP1A and DCP2 contribute to messenger RNA degradation during oocyte maturation 20
and genome activation in mouse. Biol Reprod 88, 11 (2013). 21
24. Thompson, P. J., Macfarlan, T. S. & Lorincz, M. C. Long Terminal Repeats: From 22
Parasitic Elements to Building Blocks of the Transcriptional Regulatory Repertoire. 23
Mol Cell 62, 766–776 (2016).
25. Peaston, A. E. et al. Retrotransposons regulate host genes in mouse oocytes and 1
preimplantation embryos. Dev Cell 7, 597–606 (2004). 2
26. Veselovska, L. et al. Deep sequencing and de novo assembly of the mouse oocyte 3
transcriptome define the contribution of transcription to the DNA methylation 4
landscape. Genome Biol. 16, 20110330–0 (2015). 5
27. Haberle, V. et al. Two independent transcription initiation codes overlap on vertebrate 6
core promoters. Nature 507, 381–385 (2014). 7
28. Cvetesic, N. et al. SLIC-CAGE: high-resolution transcription start site mapping using 8
nanogram-levels of total RNA. Genome Res. 28, 1943–1956 (2018). 9
29. Carninci, P. et al. Genome-wide analysis of mammalian promoter architecture and 10
evolution. Nat Genet 38, 626–635 (2006). 11
30. Ferg, M. et al. The TATA-binding protein regulates maternal mRNA degradation and 12
differential zygotic transcription in zebrafish. EMBO J 26, 3945–3956 (2007). 13
31. Giraldez, A. J. et al. Zebrafish MiR-430 promotes deadenylation and clearance of 14
maternal mRNAs. Science 312, 75–79 (2006). 15
32. Vastenhouw, N. L., Cao, W. X. & Lipshitz, H. D. The maternal-to-zygotic transition 16
revisited. Development 146, dev161471 (2019). 17
Methods
1 2
Cell lines and cell culture 3
The NIH3T3-II10 line overexpressing TBPL2 and the control NIH3T3-K2 have already been 4
described1 and were maintained in high glucose DMEM supplemented with 10% of new-born
5
calf serum at 37°C in 5% CO2.
6 7
Whole cell extracts 8
NIH3T3-II10 and NIH3T3-K2 cells cultured in 15 cm dish were washed twice with 1x PBS, 9
subsequently harvested by scrapping on ice. Harvested cells were centrifuged 1000 rcf at 4°C 10
for 5 min and then resuspended in 1 packed cell volume of whole cell extraction buffer (20 mM 11
Tris HCl pH7.5, 2 mM DTT, 20% Glycerol, 400 mM KCl, 1x Protease inhibitor cocktail (PIC, 12
Roche)). Cell lysates were frozen in liquid nitrogen and thawed on ice for 3 times, followed by 13
centrifugation at 20817 rcf, at 4°C for 15 min. The supernatant was collected and protein 14
concentration was measured by Bradford protein assay (Bio-Rad). The cell extracts were used 15
directly for immunoprecipitation and western blot, or stored at −80°C. 16
Ovaries collected from post-natal day 14 (P14) CD1 and C57BL/6N female mice were 17
homogenized in whole cell extraction buffer (20 mM Tris HCl pH7.5, 2 mM DTT, 20% 18
Glycerol, 400 mM KCl, 5x PIC (Roche)). Cell lysates were frozen in liquid nitrogen and thawed 19
on ice for 3 times, followed by centrifugation at 20817 rcf, at 4°C for 15 min. The supernatant 20
extracts were used directly for immunoprecipitation. 21
22
Antibodies and antibody purification 23
The 2B12 anti-TBPL2, the 3TF13G3 anti-TBP and the 15TF21D10 anti-GST mouse 24
monoclonal antibodies have already been described1,33,34. The J7 rabbit polyclonal anti TFIIA
was a gift of H.G. Stunnenberg. The IGBMC antibody facility raised the anti-TBPL2 polyclonal 1
3024 serum against the CPDEHGSELNLNSNSSPDPQ peptide (amino acids 111-129) coupled 2
to ovalbumin and injected into one rabbit. The resulting serum was affinity purified by using 3
the Sulfolink Coupling Gel (Pierce) following the manufacturer’s recommendations. 4
5
Immunoprecipitation 6
Ovary extract were incubated with anti-GST, anti-TBP, anti-TBPL2, anti-TAF7 or anti-TAF10 7
coated Dynabeads (Invitrogen) at 4°C overnight. After incubation, beads were washed 3 x 5min 8
at 4°C with 500 mM KCl buffer [25 mM Tris-HCl (pH 7.9), 5 mM MgCl2, 10% glycerol, 0.1% 9
NP40, 2 mM DTT, 500 mM KCl and 1x PIC (Roche)], then washed 3 x 5min at 4°C with 100 10
mM KCl buffer (25 mM Tris-HCl pH 7.9, 5 mM MgCl2, 10% glycerol, 0.1% NP40, 2 mM 11
DTT, 100 mM KCl and 1x). Immunoprecipitated proteins were eluted with 0.1 M glycine pH 12
2.8 and neutralized with 1.5 M Tris-HCl pH 8.8. Immunoprecipitation performed from whole 13
cell extracts of NIH3T3-II10 and NIH3T3-K2 cells were following the same procedures with 14
protein G Sepharose beads (GE Healthcare). 15
16
Western blot 17
Protein samples (15-25 µg of cell extracts or 15 µL of IP elution) were mixed with 1/4th volume
18
of loading buffer (100 mM Tris-HCl pH 6.8, 30% glycerol, 4% SDS, 0.2% bromophenol blue 19
and freshly added 100 mM DTT) and boiled for 10 min. Samples were then resolved on a 10 20
% SDS-PAGE and transferred to nitrocellulose membrane (Protran, Amersham). Membranes 21
were blocked in 3% non-fat milk in 1x PBS at room temperature (RT) for 30 min, and 22
subsequently incubated with the primary antibody overnight at 4°C. Membranes were washed 23
three times (10 min each) with 1x PBS - 0.05% Tween20. Membranes were then incubated with 24
HRP-coupled secondary antibodies (Jackson ImmunoResearch) for 1 hour at RT, followed by 25
ECL detection (Thermo Fisher). The signal was acquired with the ChemiDoc imaging system 1
(Bio-Rad). 2
3
Mass spectrometry analyzes and NSAF calculations 4
Samples were TCA precipitated, reduced, alkylated and digested with LysC and Trypsin at 5
37°C overnight. After C18 desalting, samples were analyzed using an Ultimate 3000 nano-6
RSLC (Thermo Scientific, San Jose, California) coupled in line with a linear trap Quadrupole 7
(LTQ)-Orbitrap ELITE mass spectrometer via a nano-electrospray ionization source (Thermo 8
Scientific). Peptide mixtures were loaded on a C18 Acclaim PepMap100 trap column (75 µm 9
inner diameter × 2 cm, 3 µm, 100 Å; Thermo Fisher Scientific) for 3.5 min at 5 µL/min with 10
2% acetonitrile (ACN), 0.1% formic acid in H2O and then separated on a C18 Accucore
nano-11
column (75 µm inner diameter × 50 cm, 2.6 µm, 150 Å; Thermo Fisher Scientific) with a 240 12
minutes linear gradient from 5% to 50% buffer B (A: 0.1% FA in H2O / B: 80% ACN, 0.08%
13
FA in H2O) followed with 10 min at 99% B. The total duration was set to 280 minutes at a flow
14
rate of 200 nL/min. 15
Proteins were identified by database searching using SequestHT (Thermo Fisher Scientific) 16
with Proteome Discoverer 1.4 software (Thermo Fisher Scientific) a combined Mus musculus 17
database (Swissprot, release 2015_11, 16730 entries) where 5 interesting proteins sequences 18
(TrEMBL entries) were added. Precursor and fragment mass tolerances were set at 7 ppm and 19
0.5 Da respectively, and up to 2 missed cleavages were allowed. Oxidation (M) was set as 20
variable modification, and Carbamidomethylation© as fixed modification. Peptides were 21
filtered with a false discovery rate (FDR) at 5 %, rank 1 and proteins were identified with 1 22
unique peptide. Normalized spectral abundance factor (NSAF)11 were calculated using custom
23
R scripts (R software version 3.5.3). Only proteins detected in at least 2 out of 3 of the technical 24
or biological replicates were considered for further analyses. 25
1
Animal experimentation 2
Animal experimentations were carried out according to animal welfare regulations and 3
guidelines of the French Ministry of Agriculture and procedures were approved by the French 4
Ministry for Higher Education and Research ethical committee C2EA-17 (project 5
n°2018031209153651). The Tg(Zp3-Cre), Taf7flox and Tbpl2- lines have already been
6
described2,13,35.
7 8
Histology analyses of ovaries 9
Ovaries were collected from 6 weeks-old Tg(Zp3-Cre/+);Taf7flox/+ and Tg(Zp3-Cre/+);Taf7flox/∆
10
oocyte specific mutant females, fixed in 4% paraformaldehyde (Electron Microscopy Sciences) 11
over-night at 4°C, washed 3 times in PBS at room temperature and embedded in paraffin. Five 12
µm-thick sections were stained with hematoxylin and eosin and images were acquired using a 13
slide scanner Nanozoomer 2.0HT (Hamamatsu Photonics). 14
15
Supervovulation 16
Five units of pregnant mare serum (PMS) was injected intraperitoneally in 4-week-old female 17
mice between 2-4 pm. After 44-46 hours, GV oocytes were collected from the ovaries by 18
puncturing with needles. 19
20
Expression and purification of TBPL2C and TBPC
21
Mouse TBPL2C (amino acids 170 to 349) fused to an N-terminal hexa-histidine tag was
22
expressed in Sf21 insect cells using the MultiBac system36. Cells were infected with composite
23
baculovirus, harvested and pelleted following published protocols37. Cell pellets were
24
resuspended and lysed by freeze-thaw in liquid nitrogen in Talon Buffer A (25 mM Tris pH 25
7.5, 1000 mM NaCl, 10 mM imidazole and compete protease inhibitor tablet (Roche)). Lysate 1
was cleared by centrifugation at 40,000 rcf for 60 min. Cleared lysate was incubated with Talon 2
Resin (Thermo Fisher) and unbound protein washed with 20 column volumes (CVs) of Talon 3
Buffer A. Protein was eluted with Talon Buffer B (25 mM Tris pH 7.5, 1000 mM NaCl, 600 4
mM Imidazole) using a step gradient. The tag was removed by TEV protease cleavage during 5
dialysis overnight into Dialysis Buffer (25 mM Tris pH 8.0, 300 mM NaCl, 2 mM β-MeSH) 6
followed by a reverse IMAC step to remove uncleaved protein. TBP was then subjected to size 7
exclusion chromatography (SEC) using a SuperdexS200 16/600 column equilibrated in SEC 8
Buffer (25 mM Tris pH 7.5, 300 mM NaCl, 5 mM β-MeSH). Mouse TBPC (amino acid residues
9
136 to 316) was expressed in E. coli Rosetta (DE3) cells at 18°C and purified as described for 10
TBPL2C.
11 12
Crystallization and structure determination of TBPL2C
13
Purified TBPL2C was screened for crystallization in a range of conditions using the sitting drop
14
method. Crystals obtained in 26% PEG3350, 0.2 M magnesium formate were harvested flash-15
frozen in liquid nitrogen and used for data collection at Diamond Light Source, (beamline I04-16
1). Diffraction data were processed and scaled using software XDS38 and the structure solved
17
by molecular replacement using software Phenix39, with TBPC (from PDBID 1NVP) as a
18
starting model. The structure was iteratively rebuilt and refined. Data and refinement statistics 19
are provided (Supplementary Table 5). Structure images were prepared using software PyMOL. 20
21
Expression and purification of TFIIA 22
The gene encoding for mouse TFIIA-γ was cloned in the pIDC plasmid from the MultiBac 23
suite37. The gene encoding for mouse TFIIA-αβ fused to an N-terminal hexa-histidine tag and
24
a TEV protease site was cloned in the pACEBac1 plasmid of the MultiBac system. A second 25
TEV protease site was also introduced in TFIIA-αβ at the TASPASE 1 cleavage site, to prepare 1
processed TFIIA comprising native-like TFIIA- a and TFIIA-b polypeptides (Extended Data 2
Fig. 1n). Plasmids were fused by Cre recombinase and expression cassettes inserted into the 3
MultiBac baculoviral genome by Tn7 transposition. Sf21 cells were infected with composite 4
baculovirus, harvested and pelleted. Cell pellets were lysed by freeze-thaw in liquid nitrogen in 5
Talon Buffer A1 (25 mM Tris pH 7.5, 300 mM NaCl, 10 mM Imidazole and compete protease 6
inhibitor tablet (Roche)). Lysate was cleared by centrifugation at 40,000 rcf for 60 min. Cleared 7
lysate was incubated with Talon Resin (Thermo Fisher) and unbound protein washed with 20 8
CVs of Talon Buffer A. Resin was then washed with 20 CVs of Talon Buffer HS (25 mM Tris 9
pH 7.5, 1000 mM NaCl, 10 mM imidazole). Protein was eluted from TALON resin with Talon 10
Buffer B1 (25 mM Tris pH 7.5, 300 mM NaCl, 300 mM imidazole) using a step gradient. The 11
TFIIA-αβ subunit was processed into α and β polypeptide chains by TEV protease cleavage 12
during dialysis overnight in MonoQ buffer A (25 mM Tris pH 8.0, 100 mM NaCl, 5 mM β-13
MeSH). In this step, the histidine-tag was likewise removed. Thus, processed TFIIA was loaded 14
on a MonoQ column followed by 15 CVs wash with MonoQ buffer A. Processed TFIIA was 15
eluted with MonoQ buffer B (25 mM Tris pH 8, 1000 mM NaCl, 5 mM β-MeSH) using a 16
continuous gradient. Protein complex was further purified using a Superdex S200 10/300 17
column equilibrated in SEC Buffer (25 mM Tris pH 7.5, 300 mM NaCl, 5 mM β-MeSH). 18
19
Electrophoretic mobility shift assay (EMSA) 20
Cy3 labelled Adenovirus major late promoter (AdMLP, coding strand sequence 21
5’CTGCTATAAAAGGCTG3’) was purchased from Eurofins Genomics. Double-stranded 22
DNA (dsDNA) substrate was generated by mixing coding and complimentary non-coding DNA 23
oligonucleotides at equimolar ratio, followed by heating to 90°C and annealing by slowly 24
cooling to room temperature (RT). Samples for EMSA experiments were prepared by mixing 25
annealed Cy3 labelled dsDNA (0.5 µM) with either TBPC or TBPL2C (1 µM) in EMSA
1
Reaction Buffer (10 mM Tris pH 8.0, 60 mM KCl, 10 mM MgCl2, 10% glycerol, 2.5 mM 2
DTT). Purified processed TFIIA was added to aliquots of this mix at increasing concentrations 3
(0.25 µM to 3 µM) followed by 90 min incubation on ice. Samples were analysed by non-4
denaturing 6% Tris-glycine gels (Invitrogen) using 1x Tris-Glycine native running buffer. Gels 5
were imaged by recording fluorescence signal for Cy3 using a Typhoon FLA 9000 Gel Imager 6 (GE Healthcare). 7 8 Oocytes collection 9
After dissection, ovaries are freed from adhering tissues in 1x PBS. Series of 6 ovaries were 10
digested in 500 µL of 2 mg/mL Collagenase (SIGMA), 0.025% Trypsin (SIGMA) and 0.5 11
mg/mL type IV-S hyaluronidase (SIGMA), on a thermomixer at 600 rpm for 20 minutes. The 12
digestion was then stopped by the addition of 1 mL of 37°C pre-warmed αMEM - 5% FBS. 13
The oocytes were then size-selected under a binocular. 14
15
RNA preparation 16
Pool of 100-200 oocytes collected were washed through several M2 drops, and total RNA was 17
isolated using NucleoSpin RNAXS kit (Macherey-Nagel) according to the user manual. RNA 18
quality and quantity were evaluated using a Bioanalyzer. Between 5-10 ng of RNA was 19
obtained from each pool of oocytes. 20
21
RNA-seq analyses 22
PolyA+ RNA seq libraries were prepared using the SMART-Seq v4 UltraLow Input RNA kit 23
(Clonetch) followed by the Nextera XT DNA library Prep kit (Illumina) according to the 24
manufacturer recommendations from 3 biological replicates for each condition (P7 wild-type 25
(WT), P7 Tbpl2-/- mutant, P14 WT and P14 Tbpl2-/- mutant oocytes) and sequenced 50 pb single
1
end using an Illumina HiSeq 4000 (GenomEast platform, IGBMC). 2
Reads were preprocessed in order to remove adapter, polyA and low-quality sequences (Phred 3
quality score below 20). After this preprocessing, reads shorter than 40 bases were discarded 4
for further analysis. These preprocessing steps were performed using cutadapt version 1.1040.
5
Reads were mapped to spike sequences using bowtie version 2.2.841, and reads mapping to
6
spike sequences were removed for further analysis. Reads were then mapped onto the mm10 7
assembly of Mus musculus genome using STAR version 2.7.0f42. Gene expression
8
quantification was performed from uniquely aligned reads using htseq-count version 0.9.143,
9
with annotations from Ensembl version 96 and “union" mode. Read counts were normalized 10
across samples with the median-of-ratios method44, to make these counts comparable between
11
samples and differential gene analysis were performed using the DESeq2 version 1.22.245. All
12
the figures were generated using R software version 3.5.3. 13
14
RT-qPCR 15
Complementary DNA was prepared using random hexamer oligonucleotides and SuperScript 16
IV Reverse Transcriptase (Invitrogen) and amplified using LightCycler® 480 SYBR Green I 17
Master (Roche) on a LightCycler® 480 II (Roche). Primers used for qPCR analysis are listed 18
in Supplementary Table 8. 19
20
Repeat element analyses 21
Data were processed as already described46 using Bowtie147 instead of Maq. The repeatMasker
22
annotation was used to identified the different types of repeat elements (Smit, AFA, Hubley, R 23
& Green, P. RepeatMasker Open-4.0. 2013-2015 http://www.repeatmasker.org). Differential 24
expression analyses were performed using DESeq2 (version 1.22.2)45. All the figures were
1
generated using R custom scripts (version 3.5.3). 2
3
SLIC-CAGE analyses 4
Twenty-eight and 13 ng of total RNA isolated from P14 oocytes (biological replicate 1 and 5
replicate 2, approximately 500-1000 oocytes pooled for each replicate) and 15 ng of total RNA 6
isolated from P14 Tbpl2-/- mutant oocytes (approximately 550 pooled oocytes) were used for
7
SLIC-CAGE TSS mapping28. Briefly, 5 µg of the carrier RNA mix were added to each sample
8
prior to reverse transcription, followed by the cap-trapping steps designed to isolate capped 9
RNA polymerase II transcripts. The carrier was degraded from the final library prior to 10
sequencing using homing endonucleases. The target library derived from the oocyte RNA 11
polymerase II transcripts was PCR-amplified (15 cycles for P14 WT, 16 cycles for P14 Tbpl2
-12
/- mutant) and purified using AMPure beads (Beckman Coulter) to remove short PCR artifacts
13
(< 200bp, size selection using 0.8 x AMPure beads to sample ratio). The libraries were 14
sequenced using HiSeq2500 Illumina platform in single-end, 50 bp mode (Genomics Facility, 15
MRC, LMS). 16
Sequenced SLIC-CAGE reads were mapped to the reference M. musculus genome (mm10 17
assembly) using the Bowtie241 with parameters that allow zero mismatches per seed sequence
18
(22 nucleotides). Uniquely mapped reads were kept for downstream analyses using CAGEr 19
Bioconductor package (version 1.20.0)48 and custom R/Bioconductor scripts. Bam files were
20
imported into R using the CAGEr package, where the mismatching additional G, if added 21
through the template-free activity of the reverse transcriptase, was removed. Same samples 22
sequenced on different lanes and biological replicates were merged prior to final analyses. 23
24
Promoter analyses 25
In order to consider only the CAGE TSS dependent only on TBPL2, we removed all the P14 1
WT CAGE tags at position where CAGE tags were also present in the P14 Tbpl2-/- mutant
2
CAGE tags dataset: for the rest of the analysis, this dataset was called “TBPL2-specific-only” 3
and we compared it to the P14 Tbpl2-/- mutant CAGE data (hereafter called
“TBPL2-4
independent-only”). Briefly, a CAGE set object was created from the TBPL2-specific-only and 5
TBPL2-independent-only CTSS files using CAGEr Bioconductor package (version 1.20.0)48,
6
data were normalized using normalizeTagCount (fitInRange = c(5,1000), alpha = 1.53, T = 1e6) 7
and the powerLaw option. Cluster of CTSS were collected using clusterCTSS (threshold = 1, 8
thresholdIsTpm = TRUE, nrPassThreshold = 1, method = "distclu", maxDist = 20, 9
removeSingletons = TRUE, keepSingletonsAbove = 5). Width of the TSS regions was 10
calculated using cumulativeCTSSdistribution and quantilePositions (clusters = "tagClusters", 11
qLow = 0.1, qUp = 0.9): interquantile width corresponds to the 10th-90th percentile of the total
12
tag cluster signal. In order to compare the different samples, consensus promoters were 13
computed using aggregateTagCluster (tpmThreshold = 3, qLow = 0.1, qUp = 0.9, maxDist = 14
100). Self-organizing map (SOM) expression profiling was performed using 15
getExpressionProfiles using a tpmThrshold of 3, the method “som”, xDim = 3 and yDim = 2. 16
Shifting TSS were obtained after calculation of the cumulative distribution along the consensus 17
clusters using cumulativeCTSSdistribution and calculation of the shift score using scoreShift 18
with the Kolomogorov-Smirnov test. Shifting promoters were extracted using 19
getShiftingPromoters (tpmThreshold = 3, scoreThreshold = -Inf, fdrThreshold = 0.01). 20
TSSs corresponding to the MaLR-ERVS were identified after annotation using HOMER 21
(version 4.10)49.
22
Sequences analyses were performed using seqPattern (version 1.14){Haberle:co} and R custom 23
scripts. WW dinucleotides enrichment was computed using plotPatternDensityMap on -24
250/+250 regions centered on the dominant TSSs. TATA box position weight matrix (PWM) 25
matches analyses was performed using the MotifScanScores function applied on the -35/-20 1
sequences centered on the dominant TSSs, using the TBP PWM provided in the SeqPattern 2
package (derived from the JASPAR data base). Distribution of the best match for each sequence 3
was then plotted. Sequence Logo were created using SeqLogo (version 1.48.0)50.
4 5
Methods references
6
33. Brou, C. et al. Distinct TFIID complexes mediate the effect of different transcriptional 7
activators. EMBO J 12, 489–499 (1993). 8
34. Nagy, Z. et al. The metazoan ATAC and SAGA coactivator HAT complexes regulate 9
different sets of inducible target genes. Cell Mol Life Sci 67, 611–628 (2010). 10
35. Gegonne, A. et al. The general transcription factor TAF7 is essential for embryonic 11
development but not essential for the survival or differentiation of mature T cells. Mol 12
Cell Biol 32, 1984–1997 (2012).
13
36. Sari, D. et al. The MultiBac Baculovirus/Insect Cell Expression Vector System for 14
Producing Complex Protein Biologics. Advances in Experimental Medicine and 15
Biology 896, 199–215 (2016).
16
37. Bieniossek, C., Richmond, T. J. & Berger, I. MultiBac: multigene baculovirus-based 17
eukaryotic protein complex production. Curr Protoc Protein Sci Chapter 5, Unit 5.20– 18
5.20.26 (2008). 19
38. Kabsch, W. XDS. Acta Crystallogr. D Biol. Crystallogr. 66, 125–132 (2010). 20
39. Liebschner, D. et al. Macromolecular structure determination using X-rays, neutrons 21
and electrons: recent developments in Phenix. Acta Crystallogr D Struct Biol 75, 861– 22
877 (2019). 23
40. Martin, M. Cutadapt removes adapter sequences from high-throughput sequencing 24
reads. EMBnet.journal 17, 10–12 (2011). 25
41. Langmead, B. & Salzberg, S. L. Fast gapped-read alignment with Bowtie 2. Nat. 1
Methods 9, 357–359 (2012).
2
42. Dobin, A. et al. STAR: ultrafast universal RNA-seq aligner. Bioinformatics 29, 15–21 3
(2012). 4
43. Anders, S., Pyl, P. T. & Huber, W. HTSeq--a Python framework to work with high-5
throughput sequencing data. Bioinformatics 31, 166–169 (2015). 6
44. Anders, S. et al. Count-based differential expression analysis of RNA sequencing data 7
using R and Bioconductor. Nat Protoc 8, 1765–1786 (2013). 8
45. Love, M. I., Huber, W. & Anders, S. Moderated estimation of fold change and 9
dispersion for RNA-seq data with DESeq2. Genome Biol. 15, 31 (2014). 10
46. Fadloun, A. et al. Chromatin signatures and retrotransposon profiling in mouse 11
embryos reveal regulation of LINE-1 by RNA. Nat Struct Mol Biol 20, 332–338 12
(2013). 13
47. Langmead, B., Trapnell, C., Pop, M. & Salzberg, S. L. Ultrafast and memory-efficient 14
alignment of short DNA sequences to the human genome. Genome Biol. 10, R25 15
(2009). 16
48. Haberle, V., Forrest, A. R. R., Hayashizaki, Y., Carninci, P. & Lenhard, B. CAGEr: 17
precise TSS data retrieval and high-resolution promoterome mining for integrative 18
analyses. - PubMed - NCBI. Nucleic Acids Res 43, e51–e51 (2015). 19
49. Heinz, S. et al. Simple combinations of lineage-determining transcription factors prime 20
cis-regulatory elements required for macrophage and B cell identities. Mol Cell 38, 21
576–589 (2010). 22
50. seqLogo: Sequence logos for DNA sequence alignments.
23
doi:10.18129/B9.bioc.seqLogo 24
Data availability
1
The datasets generated during the current study are available in different repositories: 2
structure factors and coordinates for TBPL2C; Protein Data Bank (PDB ID 6TH9), proteomic data;
3
ProteomeXchange PRIDE database (PXD0316347), RNA-seq data; Gene Expression Omnibus 4
database (GSE140090) and SLIC-CAGE data; ArrayExpress (submission in progress). 5
6
Acknowledgements
7
We thank D. Singer and A. Gegonne for the gift of the Taf7flox mouse line and H. Stunnenberg
8
for TFIIA antibodies. We would also like to thank D. Devys for critically reading the manuscript, all 9
members of the Tora lab for thoughtful discussions and suggestions throughout the course of the 10
work. We are grateful to I. Kukhtevich, M. Borsos, M.E. Torres Padilla, T. Gupta and L. Casini for 11
advice and preliminary experiments. We thank C. Hérouard and M. Jung from the GenomEAST 12
platform for library preparation and preliminary analyses, P. Eberling for peptide synthsis, F. 13
Ruffenach for proteomic analyses, G. Duval for polyclonal antibody generation, the histology 14
platform, the IGBMC cell culture facility and S. Falcone, M. Poirot and F. Memedov of the IGBMC 15
animal facility for animal care taking. This work was supported by funds from CNRS, INSERM, and 16
Strasbourg University. This study was also supported by the European Research Council (ERC) 17
Advanced grant (ERC-2013-340551, Birtoaction) and grant ANR-10-LABX-0030-INRT (to LT) and 18
a French State fund managed by the Agence Nationale de la Recherche under the frame program 19
Investissements d’Avenir ANR-10-IDEX-0002-02. IB and FM acknowledge support by Wellcome 20
Trust Senior Investigator awards (106115/Z/14/Z and 106955/Z/15/Z, respectively). 21
22
Authors’ contribution
23
CY, SDV and LT designed the study; SDV and LT supervised the project; CY performed all 24
molecular lab and mouse experiments, EG generated the anti-TBP2 polyclonal antibodies, LN carried 25
out the proteomic analyses, PH organized the SLIC-CAGE, NC carried out SLIC-CAGE analyses, 1
NC and BL analysed the CAGE data, and SDV analysed the proteomic, RNA-seq and SLIC-2
CAGE data. FM oriented the promoter analyses. KG performed X-ray crystallography and 3
biochemical experiments, supervised by IB. CY, SDV, KG, IB, FM, and LT wrote the manuscript 4
with contributions to manuscript text and figure legends from all authors. All authors gave final 5
approval for publication. 6
7
Competing interests
8
The authors declare that they have no competing interests. 9
10
Additional Information
11
Supplementary information is available for this paper. 12
13
Correspondence and request for materials should be addressed to S. D. Vincent 14
([email protected]) or L. Tora ([email protected]).
15 16
a b
e f
c d
Fig. 1 | TBPL2 does not assemble in a TFIID-like complex during oocyte growth. a, anti TBPL2 immunoprecipitation followed by mass spectrometry (IP-MS) analysis from three biological replicates of mouse ovarian whole cell extracts (WCE). The colour code for the different proteins or complexes is indicated on the right. NSAF; normalized spectral abundance factor. b-d, Sequential IP-MS experiment from ovarian WCE (technical triplicates). Anti TAF7 IP-MS (b), followed by an anti TAF10 IP-MS (c) and then an anti TBPL2 IP-MS (d). The colour code is the same as in (a). e, f, Hematoxylin and eosin stained ovaries section from control (e) and oocyte-specific Taf7 mutant (f) ovaries. The presence of antral follicles is indicated by an asterisk. Scale bars: 500 µm.
Tg(Zp3-Cre/+);Taf7flox/∆
*
500 µm Tg(Zp3-Cre/+);Taf7flox/+*
500 µm 0.0 0.1 0.2 0.3 0.4 0.5 0.6 0.7 0.8TBPL2 TBP TAF1 TAF2 TAF3 TAF4A TAF4B TAF5 TAF6 TAF7 TAF7L TAF8 TAF11 TAF13 TAF9 TAF9B TAF10 TAF12 TAF5L TAF6L SUPT7L SF3B3 SF3B5 SUPT20 SUPT3 TAD
A1
TRRAP TFIIA−αβ ALF TFIIA−
γ
TFIIB
NSAF
anti TBPL2−IP (flowthrough #2)
0.0 0.2 0.4 0.6 0.8 1.0 1.2 1.4 1.6 1.8 2.0 2.2 2.4 2.6
TBPL2 TBP TAF1 TAF2 TAF3 TAF4A TAF4B TAF5 TAF6 TAF7 TAF7L TAF8 TAF11 TAF13 TAF9 TAF9B TAF10 TAF12 TAF5L TAF6L SUPT7L SF3B3 SF3B5 SUPT20 SUPT3 TAD
A1
TRRAP TFIIA−αβ ALF TFIIA−
γ
TFIIB
NSAF
anti TAF10−IP (flowthrough #1)
0 1 2 3 4 5 6 7 8 9
TBPL2 TBP TAF1 TAF2 TAF3 TAF4A TAF4B TAF5 TAF6 TAF7 TAF7L TAF8 TAF11 TAF13 TAF9 TAF9B TAF10 TAF12 TAF5L TAF6L SUPT7L SF3B3 SF3B5 SUPT20 SUPT3 TAD
A1
TRRAP TFIIA−αβ ALF TFIIA−
γ
TFIIB
NSAF
anti TAF7−IP (ovary WCE)
TBPL2 TBP TFIID-TAFs shared-TAFs SAGA TFIIA TFIIB 0.00 0.02 0.04 0.06 0.08 0.10 0.12 0.14 0.16 0.18 0.20 0.22 0.24
TBPL2 TBP TAF1 TAF2 TAF3 TAF4A TAF4B TAF5 TAF6 TAF7 TAF7L TAF8 TAF11 TAF13 TAF9 TAF9B TAF10 TAF12
TFIIA− αβ ALF TFIIA− γ TFIIB NSAF
a b c
e f
d
Fig. 2 | TBPL2 and TBP core domains are very similar but display distinct properties. a, X-ray crystal structure at 2Å resolution of mouse TBPL2 core (residues 170-349; TBPL2C) is shown (brown). TBPL2C, similar to TBP core (TBPC), exists as a dimer in the crystal (monomers in brown and grey) . The N and C lobes of TBPL2C are labelled. b, c, TBPL2C (b) and TBPC (from PDBID 1NVP, c) are shown in two views in an electrostatic surface charge representation (blue, basic; red, acidic) revealing significant differences. d, The crystal structure of a TBP/TFIIA/DNA complex (PDBID 1NVP) is shown on the left. This complex was used to model TBPL2C interactions with the crystallized TFIIA core (TFIIAC). The segments corresponding to the boxed-in section are depicted in zoom-ins on the right. TBPC is coloured in green, TBPL2C in brown, TFIIAC α, β and γ chains in blue, magenta and yellow, respectively. Amino acids at the interfaces are labelled by their residue numbers. TATA DNA is shown as a ladder. e, f, Interactions of TATA DNA,full-length processed TFIIA and TBPL2C (e) or TBPC (f) analysed by EMSA . Bands corresponding to free DNA, TBPL2C/DNA (e) or TBPC/DNA (f) complexes, and the different complexes (complex 1, complex 2) are marked (n=2).
TBPc + + ++ DNA TBPc TFIIA + -+ + -+ + ++ ++ ++ ++ ++ TBPc/DNA complex complex 1 free DNA 1 2 3 4 5 6 7 8 9 10 1 2 3 4 5 6 7 8 9 10 TBPL2c DNA TBPL2c TFIIA TBPL2c/DNA complex complex 2 complex 1 free DNA + -+ + -+ + ++ ++ ++ ++ ++ ++ ++ TBPc β α γ TATA-box DNA T64 Y65 R66 C68 D69 K181 T182 R186 R188 A190 TBPc γ T64 Y65 R66 T201 K199 N197 K193 R192 TBPL2c C68 D69 γ TBPc 90° C lobe N lobe TBPL2c 90° C lobe N lobe TBPL2c C lobe N lobe C lobe N lobe TBPL2c
a b c e f g h i d
Fig. 3 | Expression of genes related to the mRNA deadenylation/decapping/decay pathways and of the MaLR endogenous retroviral elements are down regulated in growing Tbpl2-/- mutant oocytes. a, b, IGV genomic snapshots of Bmp15 (a) and Gdf9 (b). c, Expression comparison between wild-type (WT) and Tbpl2-/- mutant post-natal 14 (P14) oocytes (biological triplicates). Expression has been normalized to the median size of the transcripts in kb. Grey dots correspond to non-significant genes and genes with high Cook’s distance, light-blue dots to significant genes for an adjusted p value ≤ 0.05 and dark-blue dots to significant genes for an adjusted p value ≤ 0.05 and an absolute log2 fold change > 1, after Wald test and Benjamini-Hochberg correction (DESeq2). The number of up- or down-regulated genes is indicated on the graph. d, Down-regulated genes GO category analyses for the molecular functions (MF). The top ten most enriched significant GO categories for a FDR ≤ 0.05 are represented. e, Heatmap of selected genes involved in mRNA decay, decapping or deadenylation pathways. Expression levels in fold-change (compared to the mean of WT) of three biological replicates of P14 WT and P14 Tbpl2-/- mutant oocytes are indicated. The fold change colour legend is indicated at the bottom. f-i, Differential expression between wild type and Tbpl2-/- mutant P14 oocytes of the different transposon classes; RNA transposon classes (LINEs (f), SINEs (g) and ERVs (h)) and DNA transposons (DNAs (i)). The ERV sub-class III mammalian apparent LTR retrotransposon (MaLR) family is the most severely affected in Tbpl2-/- mutant oocytes at P14.
adjusted p value < 0.05 > 0.05 number of elements < 102 < 103 < 104 < 105 PiggyBac DNAs 101 102 103 100 10-1 MaLR ERVs 101 102 103 100 10-1 SINEs 101 102 103 100 10-1 Expression in control LINEs −3 −4 −2 −1 0 1 2 3 4 101 102 103 100 10-1
P14 fold change (log2)
Cnot8 Cnot3 Pan2 Cnot7 Dis3l Atp2c1 Zfp36l1 Pan3 Ern1 Cnot6l Patl2 Btg4 Dcp1a Zfp36 Dcp2 Cnot6 Hnrnpdl Exosc3 Lsm8 Hnrnpd Xnr1 Cnot1 Xnr2 Dis3 Khsrp Exosc10 Dcps Dcp1b Exosc8 Exosc4 Exosc7 Exosc1 Lsm3 Parn Cnot4 Smg6 Elavl1 Patl1 Nudt16l1 Lsm6 Exosc9 Exosc5 Lsm5 Lsm4 Lsm2 Exosc2 Lsm1 Lsm7 Zfp36l2 Nudt16 Zc3h12a P14 WT oocytes P14 Tbpl2-/- oocytes 3 4 2 log10(expression WT) log2(fold change) -4 -2 0 2 4 poly(A)−specific ribonuclease activity ubiquitin protein ligase activity ubiquitin−like protein ligase activity histone binding RNA polymerase II−specific DNA- binding transcription factor binding ATPase activity, coupled ubiquitin−protein transferase activity ubiquitin−lkie protein transferase activity enzyme activator activity ATPase activity 0.01 0.02 0.03 FDR 0.05 MF fold enrichment 0 2 4 6 1802 genes downregulated 1396 genes upregulated 10-1 10-1 100 100 101 101 102 102 103 103 104 104 105 105 106 106
P14 WT expression (normalized reads))
P14 KO expression (normalized reads)
non significant adjusted p.value ≤ 0.05 adjusted p.value ≤ 0.05 |log2(fold change)| > 1 Tbpl2 -/-WT Tbpl2 -/-WT P14 P7 Refseq Uqcrq Gdf9 Tbpl2 -/-WT Tbpl2 -/-WT P14 P7 Refseq Bmp15