Publisher’s version / Version de l'éditeur:
Vous avez des questions? Nous pouvons vous aider. Pour communiquer directement avec un auteur, consultez la première page de la revue dans laquelle son article a été publié afin de trouver ses coordonnées. Si vous n’arrivez pas à les repérer, communiquez avec nous à [email protected].
Questions? Contact the NRC Publications Archive team at
[email protected]. If you wish to email the authors directly, please see the first page of the publication for their contact information.
https://publications-cnrc.canada.ca/fra/droits
L’accès à ce site Web et l’utilisation de son contenu sont assujettis aux conditions présentées dans le site
LISEZ CES CONDITIONS ATTENTIVEMENT AVANT D’UTILISER CE SITE WEB.
International Conference on Industrial & Engineering Applications of Artificial
Intelligence & Expert Systems (IEA-AIE 2004) [Proceedings], 2004
READ THESE TERMS AND CONDITIONS CAREFULLY BEFORE USING THIS WEBSITE. https://nrc-publications.canada.ca/eng/copyright
NRC Publications Archive Record / Notice des Archives des publications du CNRC :
https://nrc-publications.canada.ca/eng/view/object/?id=8642e621-c86a-44ee-9ffb-c832d21f9e9a
https://publications-cnrc.canada.ca/fra/voir/objet/?id=8642e621-c86a-44ee-9ffb-c832d21f9e9a
NRC Publications Archive
Archives des publications du CNRC
This publication could be one of several versions: author’s original, accepted manuscript or the publisher’s version. / La version de cette publication peut être l’une des suivantes : la version prépublication de l’auteur, la version acceptée du manuscrit ou la version de l’éditeur.
Access and use of this website and the material on it are subject to the Terms and Conditions set forth at
Knowledge Discovery in Hepatitis C Virus Transgenic Mice
Famili, Fazel; Ouyang, Junjun; Kryworucho, M.; Alvarez-Maya, I.; Smith, B.;
Diaz-Mitoma, F.
National Research Council Canada Institute for Information Technology Conseil national de recherches Canada Institut de technologie de l'information
Knowledge Discovery in Hepatitis C Virus
Transgenic Mice *
Famili, A., Ouyang, J., Kryworucho, M., Alvarez-Maya, I., Smith, B.,
and Diaz-Mitoma, F.
May 2004
* published in the Proceedings of the 17th
International Conference on Industrial & Engineering Applications of Artificial Intelligence & Expert Systems (IEA-AIE 2004). May 17-20, 2004. Ottawa, Ontario, Canada. NRC 46545.
.
Copyright 2004 by
National Research Council of Canada
Permission is granted to quote short excerpts and to reproduce figures and tables from this report, provided that the source of such material is fully acknowledged.
Knowledge Discovery in Hepatitis C Virus
Transgenic Mice
A. Fazel Famili1, Junjun Ouyang1, Marko Kryworuchko2, Ikuri Alvarez-Maya2,
Brandon Smith3 and Francisco Diaz-Mitoma2
1 Institute for Information Technology, Bldg. M-50 NRC, Ottawa, On. K1A0R6 Canada {fazel.famili, junjun.ouyang}@nrc.gc.ca
2 Children’s Hospital of Eastern Ontario, 401 Smyth Rd. Ottawa, On. K1H 8L1 Canada {MKryworuchko, IAlvarez-Maya, diaz}@cheo.on.ca
3 Institute for Biological Sciences, Bldg. M-54 NRC, Ottawa, On. K1A0R6 Canada {brandon.smith}@nrc.gc.ca
Abstract. For the purpose of gene identification, we propose an approach to
gene expression data mining that uses a combination of unsupervised and supervised learning techniques to search for useful patterns in the data. The approach involves validation and elimination of irrelevant data, extensive data pre-processing, data visualization, exploratory clustering, pattern recognition and model summarization. We have evaluated our method using data from microarray experiments in a Hepatitis C Virus transgenic mouse model. We demonstrate that from a total of 15311 genes (attributes) we can generate simple models and identify a small number of genes that can be used for future classifications. The approach has potential for future disease classification, diagnostic and virology applications.
1 Introduction
The field of bioinformatics involves a close link with a number of diverse research areas, from genomics and proteomics to computer science, mathematics and in particular data mining. This collaboration of disciplines has evolved because of: (i) the advances in data production and acquisition facilities, such as mircroarrays and high throughput genomics, (ii) the enormous amounts of data that cannot be analyzed using ordinary tools, and (iii) the strong interest from many groups (research institutes, hospitals, pharmaceuticals, etc.) who want to benefit from this wealth of data. Advancements in microarray technology, for example, have overwhelmed scientists with expression profiles of tens of thousands of genes from a variety of organisms. Researchers have undertaken many efforts to deal with these issues [5, 6, 8, 13, 15 and 16], and have noticed the lack of powerful and efficient knowledge discovery tools, along with well defined knowledge discovery strategies.
Knowledge discovery is the process of developing strategies to discover ideally all previously unknown knowledge from historical or real time data. Microarray related applications expect that the knowledge discovery process will help, such that one can (i) identify anomalies of certain genes or experiments, (ii) define relationships
between genes and their functions based on expression profiles, and (iii) build diagnosis models for clinical classes, e.g. normal and diseased organs.
With expression profiles from thousands of genes, the specific objectives of this study were (i) to develop a data mining strategy that can deal with a relatively large amount of microarray data, (ii) to efficiently search for patterns and meaningful relations and (iii) to identify genes that can differentiate between mice expressing Hepatitis C Virus proteins (transgenic) and non-expressing age matched controls (non-transgenic). We first explain the research problem in section 2. In section 3, we describe the data collection process and briefly introduce BioMiner software. In section 4 we give an overview of the data preprocessing. Section 5 describes our knowledge discovery process and section 6 presents the results. We conclude the paper in section 7.
2 The Research Problem
Hepatitis C virus (HCV) constitutes a major cause of chronic liver disease around the world. Approximately 200 million people worldwide are infected with HCV [4, 10, and 15]. The development of a suitable vaccine against HCV is a complicated and difficult task due to the broad genetic variability of the virus genome allowing it to escape control by the host immune response. There have been genomic studies on HCV using various models [1, 10, 11, 12, 13 and 15]. The lack of good in vitro models as well as small animal models of infection have hampered medical researchers’ abilities to characterize the mechanism by which the virus causes liver damage and to identify correlates of protection.
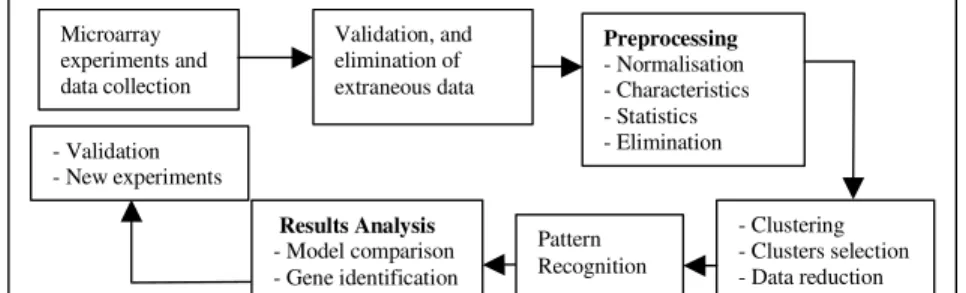
In this study, transgenic mice expressing HCV core (E1 and E2) proteins were produced to exhibit liver abnormalities similar to those of natural HCV infections. Researchers are interested to compare gene expression in the livers of HCV-transgenic mice to that of non-HCV-transgenic mice and correlate this with the pathology. We obtained gene expression data from HCV-transgenic experiments. We then applied our data processing and analysis tools and related data mining technology to examine the data, look into possible anomalies, build explicit models, and identify important genes. The overall data processing and knowledge discovery process is illustrated in Fig. 1 and explained in detail in the next sections.
Microarray experiments and data collection Validation, and elimination of extraneous data - Clustering - Clusters selection - Data reduction Results Analysis - Model comparison - Gene identification
Fig. 1. Knowledge discovery process in microarray data analysis
Preprocessing - Normalisation - Characteristics - Statistics - Elimination - Validation - New experiments Pattern Recognition
3 Microarray Experiments, Data Collection and Bioinformatics Tools
Microarray experiments were performed at the Division of Virology, Children’s Hospital of Eastern Ontario. RNA was extracted from the livers of 7 transgenic and 7 non-transgenic mice and analyzed on Mouse cDNA microarrays. Total RNA was isolated using a Qiagen isolation kit (Mississauga, ON, Canada) and used as a template to generate cDNA labeled with Cyanine dye-conjugated (Cy3-green or Cy5-red) dUTP (Amersham Pharmacia). Array images were collected for both Cy3 and Cy5 using a ScanArray XL 4000 fluorescent scanner (Packard Bio-chip, CA) with 10-µm resolution to detect Cy3 and Cy5 fluorescence and image intensity data were extracted and analyzed using QuantArray 3.0 (Packard Bio-chip, CA) software.
The data consisted of seven microarray experiments (biological repeats). Every data set (array) consisted of 30622 rows of readings of mouse genes, and 578 rows of controls. There was one pair (Row 1 and 2, 3 and 4, … 31199 and 31200) of duplicate readings for each gene (clone) or control. Columns specify readings from a non-transgenic mouse (Cy3, Channel 1) and a non-transgenic (Cy5, Channel 2), respectively. These readings include background, intensity and many other experiment related
technical parameters for each channel. Cui and Churchill [3]suggest that for a given
number of arrays, more mice per treatment with fewer arrays per mouse is more powerful than fewer mice per treatment with more arrays per mouse. Overall, the amount of data was sufficient to understand the variance across the experiments.
A specialized microarray data pre-processing tool, “Normaliser”, was used to perform background subtraction, normalisation and filtering of the raw data from QuantArray. This software is based on the general principles in microarray informatics and is built as an add-in package for Microsoft Excel 2000. We used BioMiner data mining software for the rest of data pre-processing and knowledge discovery experiments reported in this paper. BioMiner has been designed and built in house to provide support for biologists and bioinformaticians performing data mining research in functional genomics. One of the key advantages of the software is that all available forms of data pre-processing and analysis functionalities are integrated into one environment. The data pre-processing and data analysis modules consist of a collection of algorithms and tools to support data mining research activities in an
interactive and iterative manner [6 and 16].
4 Data Preprocessing
We started with the raw data from QuantArray that contained experimental results from Channel (Ch1) and Channel 2 (Ch2). For our knowledge discovery studies, only background and intensity columns for each channel of each gene were used. Following a preliminary investigation, Normaliser was used to transform the raw data. The data before and after normalisation were then compared for validation.
4.1 Preliminary Investigation and Validation
This process involved dividing the raw data for each array into Odd and Even subsets representing the duplicates. Using BioMiner, all seven arrays (biological repeats) were examined for their characteristics, e.g. mean and standard deviation. We compared characteristics among the arrays to study the variations and distributions.
Two statistics need to be described, Skewness and Kurtosis. Skewness is a measure of symmetry, or lack of symmetry. A distribution or data set, is symmetric if it looks the same to the left and to the right of the center point (mean). Kurtosis shows whether the data is peaked or flat relative to a normal distribution. If the Kurtosis is not 0, then the distribution is either flatter (< 0) or more peaked (> 0) than normal.
The examinations of various statistics helped us to understand the characteristics of our data, to identify possible anomalies, and if required to repeat the entire knowledge discovery process after eliminating certain array experiments. In particular, the
Skewness and Kurtosis of one array (ID number: 12230633) were much higher than
those of other repeats whose values were close to each other. The particular abnormality of this array will be discussed in detail, in later sections.
4.2 Pre-processing: Background Subtraction, Normalisation and Filtering Normalisation, in the context of 2-channel microarray experiments is a transformation to compensate for systematic biases that exist between the two channels of intensity data. The normalisation procedures performed are consistent with the microarray normalisation recommended in [18]. This resulted in 3 new data columns; background subtracted, normalised, Ch1 and Ch2 intensity columns, and a flag column that was used for filtering the data. Filtering removed data points identified as anomalous. All seven microarray experiments were processed by Normaliser using the same settings to generate data sets of background subtracted, log-transformed, normalised and filtered intensity values and corresponding relative gene expression values (Log2
ratios) for all 31,200 rows (genes and controls). Following are the steps:
1. Background subtraction using the values computed by the quantitation software (QuantArray).
2. Flagging the data for:
i Spots with intensity in the 5th percentile or lower in either channel.
ii Spots with intensity in the 98th percentile or higher in either channel.
iii Spots with intensity/background less than 2.5. iv Spots flagged manually during image quantitation. 3. Conversion of intensities to log2.
4. Pre-filtering the flagged spots for computing the normalisation correction factors. 5. Normalisation correction of Channel-2 intensities using a linear regression of
Ch2 vs. Ch1 log2 intensities by sub-array, such that the slope is 1 and the
intercept is 0.
6. Computing the relative gene expression values (Ch2 log2 intensity – Ch1 log2
intensity).
7. Filtering of flagged data, if required in (Step 9 below).
9. Assembly of intensity and relative gene expression (log2 ratio) data sets of all 7
experiments as follows: i Unfiltered, not averaged ii Unfiltered, averaged iii Filtered, averaged
4.3 Additional Processing and Validation
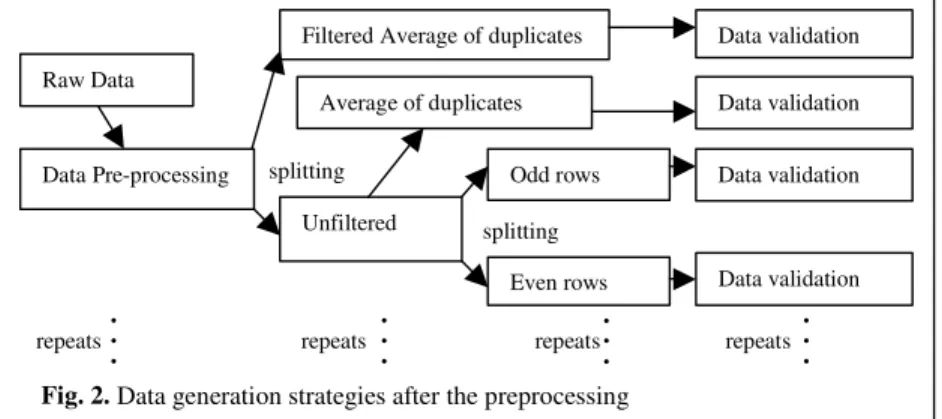
The objective of this step was to analyze the characteristics of the data sets after transformation. The new data sets (Sect. 4.2) were processed accordingly before applying BioMiner software for validation (Fig. 2). Special attention was paid to the filtering (Step 7, Sect. 4.2) since this step influences the research through eliminating some data. Therefore, filtered and unfiltered data sets were separate routes or directions through the knowledge discovery process. The unfiltered data set was split into two directions (or sub-routes). In the first sub-route, the paired spot duplicates (adjacent Odd and Even rows) were averaged as performed on the filtered data. In the second, the spot replicates were split into two separate data sets (Odd and Even). As to this second group (or sub-route), comparative examinations were carried out between the Odd and Even data sets.
Using BioMiner software we observed that pre-processing had substantial effects on the data distributions. The histograms of Ch1 and Ch2 showed bell-shaped normal distributions and the scatter plots presented a linear relationship between Ch1 and Ch2. These were consistent with the objectives of pre-processing. The standard deviation of the ratio distribution of one array (ID: 12230633) was two-fold greater than almost all other arrays. This is the same array that showed considerably higher
Skewness and Kurtosis than other repeats (Sect. 4.1). This “abnormal” array was
flagged to assess its influence on the knowledge discovery process.
We now had three groups of data (Fig. 2) for knowledge discovery experiments: i Background subtracted, normalised, filtered data sets of seven arrays with
transgenic (Ch2) and non-transgenic (Ch1) readings, and their ratios. For this group, the value for each gene (row) is the average of odd and even rows. ii As (i) but unfiltered.
splitting Unfiltered Odd rows Even rows splitting • • • Raw Data Data Pre-processing
Filtered Average of duplicates Data validation Average of duplicates • • • • • • • • • Data validation Data validation repeats repeats repeats repeats
Fig. 2. Data generation strategies after the preprocessing
iii As (ii) but split into 2 data sets containing odd and even rows, respectively. The contents in this group were similar to the other two groups with two channels.
5 The knowledge Discovery Process
The knowledge discovery process involved choosing data mining algorithms, selecting suitable options and understanding what to do before taking the next step. 5.1 Unsupervised Learning -- Clustering
Based on the objectives of the study listed in section 1, the first strategy was to apply an unsupervised learning method (i.e. using the Clustering module of BioMiner) to identify genes that have certain common properties. This was done on all the data from the 7 arrays. We used this method to (i) group genes based on a similarity or distance measure, (ii) identify and select the most important groups (i.e. up- or down-regulated), and (iii) reduce data dimensionality in order to narrow the search for patterns (“Data Reduction” in Fig. 1). We used K-Means clustering, where K is the number of clusters for each run. Two major routes for clustering are described:
(i) Clustering genes of each array on values of the two channels: Filtered, averaged data sets were selected for this analysis. Here, “difference-in-shape” was used as the distance measure (Eq. 1). Each cluster is represented as a line connecting Ch1 and Ch2 centroids (average expression value of genes in the cluster). The slope of each line reflects the ratio of Ch2 over Ch1 of that cluster. The significance of regulation was jugged visually based on this slope. For each array, we selected two clusters that contained the most significantly differentially expressed genes (up- or down-regulated: Ch2 vs. Ch1). Then, up- or down-regulated groups of all seven arrays were compared to select the most common genes among them. By experimenting with different values of K (number of clusters) a specific K was chosen such that the final output through this route yielded 41 to 159 most significantly modulated genes.
(ii) Clustering genes on the ratios of all seven arrays together: Filtered, averaged (sub-route a) and unfiltered, averaged (sub-route b) data sets were studied separately. This time, “difference-in-size” was used as the distance measure (Eq. 2). Since ratios
( [ ] [ ]) ( [ ] [ ]) / / 1 2 2 − − − − ∈ ∈ c c j X j X j X j X A j i k A j i k (Equation 1: difference-in-shape) ( ) 2 2 / ] [ ] [j j c A j i k − ∈ x x (Equation 2: difference-in-size)
• A = {j | j∈{1..n}∧attribute value xl[j] is not missing }
• where both Xi[ j] and Xk[ j] are not missing value, ‘c’ is the number of variables for which neither Xi[ j] nor Xk[ j] is missing and ‘n’ is the total number of variables for certain attribute.
from seven arrays were used directly for clustering, the significance of differential expression was also based on the ratios of Ch2 over Ch1. We selected one cluster with the most positive centroid (up-regulated) and the other with the most negative centroid (down-regulated), for two sub-routes (a and b), respectively. The k-value was set in the same manner as in route (i).
5.2 Supervised Learning -- Pattern Recognition
To build explicit models from these clusters of genes, classification techniques were used to identify the most informative genes that can discriminate between transgenic and non-transgenic mice. The Pattern Recognition module of BioMiner provides supervised learning techniques including discrimination and prediction algorithms mainly from the WEKA [17] machine learning toolkit. From this collection, the J4.8 Decision Tree induction algorithm [14] was selected to generate tree structures for class assignments. Decision trees are easier to understand and interpret by domain experts, such as biologists, than regression trees (e.g. CART and MART [2, 7 and 9]). Rules can be derived from decision trees. In addition, decision trees are easier to combine with domain knowledge and incorporate into knowledge based systems.
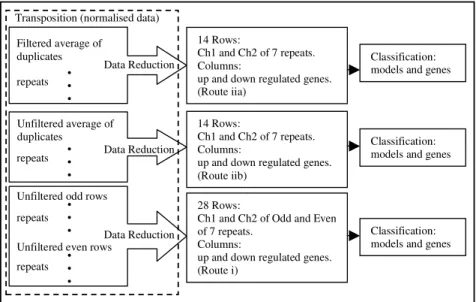
Fig. 3 shows the overall process of searching for patterns. Before applying the decision tree algorithm, three data sets were generated corresponding to the results of clustering described in the previous section (referred to as “Data Reduction” in Fig. 3). In these data sets, rows (14 or 28 cases) were channels (Ch1 and Ch2) of all arrays and columns were genes (between 41 to 159 features). An extra column, containing the label information corresponding to Ch1 or Ch2 (the two classes to be classified), was the last attribute vector in the data. From amongst all attribute vectors (genes), the decision tree algorithm selected genes with the highest information value, which distinguish between the transgenic and non-transgenic mice. The result was a classification model, which included a threshold for classification along with a measure of strength.
5.3 Clustering and Pattern Recognition with Exclusion of One Array
During data processing and validation, one mouse array (biological repeat) was significantly different from the other six (Sect. 4.1 and 4.3). This “abnormality” was also identified in the results of clustering performed using ratios (Sect. 6). Clustering and Pattern Recognition were repeated without this array to see if different genes and models would be generated.
There were no procedural changes for the clustering in Route (i) and Route (ii) (Sect. 5.1), since only the “abnormal” array was excluded. The reduced gene lists (i.e. the most differentially expressed genes, Sect 5.1) identified through clustering may be different, as well as genes (columns) in the corresponding data for pattern recognition (Fig. 3). Also for pattern recognition, the cases of transgenic and non-transgenic mice excluded those from the “abnormal” array in this round. Therefore, there were 12, 12 and 24 rows for Route i, iia and iib respectively (Fig. 3).
6 Results
Using K-Means clustering with a pre-selected number (K) of clusters, we identified the most significant up- and down-regulated genes common to all or most arrays. Table 1 shows the number of identified genes in each of the 6 clustering runs. Runs 1 to 3 include data from all 7 replicate arrays, and runs 4 to 6 exclude data from the “abnormal” array. All clustering runs resulted in a data reduction of between 97.4% and 99.4% and simplified the search for the most informative genes.
Table 1. Results of clustering (* clustering runs that exclude data from one array)
Run # No. of
clusters (K) Original genes Genes identified through clustering Source of data
1 5 12601 (avg.) 71 Filtered channel intensities 2 11 5756 149 Filtered ratios
3 15 15268 159 Unfiltered ratios 4 (*) 5 12601 (avg.) 41 Filtered channel intensities 5 (*) 11 5756 110 Filtered ratios
6 (*) 21 15268 131 Unfiltered ratios
Fig. 4 is an example of clustering performed on ratios of seven arrays (route ii). Each curve is a connection of centroids (Y-axis) of one array across the eleven clusters (X-axis). This shows the “abnormality” of one array (#12230633) that has been emphasized and investigated during processing and validation (Sect. 4). The numbers of genes identified through six runs of clustering, with or without this “abnormal” array were different (Table 1). This demonstrates the influences of including or excluding “abnormal” data on the knowledge discovery process. We
Pat
Filtered average of duplicates
Transposition (normalised data)
14 Rows:
Ch1 and Ch2 of 7 repeats. Columns:
up and down regulated genes. (Route iia)
14 Rows:
Ch1 and Ch2 of 7 repeats. Columns:
up and down regulated genes. (Route iib)
28 Rows:
Ch1 and Ch2 of Odd and Even of 7 repeats.
Columns:
up and down regulated genes. (Route i) • • • repeats Data Reduction Unfiltered average of duplicates • • •
repeats Data Reduction
Unfiltered odd rows
Unfiltered even rows • • • repeats • • • repeats Data Reduction Classification: models and genes
Classification: models and genes
Classification: models and genes
have higher confidence in the genes identified when the “abnormal” array was excluded.
Following identification of significantly up- or down-regulated genes, we built models that use one or more of these genes to discriminate the two classes (transgenic vs. non-transgenic). The decision tree algorithm generated six fairly simple models from the six sets of significantly regulated genes identified through clustering. All these models achieved 100% classification accuracy and contained between 1-3 genes (Table 2). Fig. 5 shows one of the six models, with two genes. In this model, when gene S57 =< 9.111757, then it is Ch2 (transgenic), otherwise, when S57 > 9.111757
and S101 <= 11.925628 then it is Ch1 (non-transgenic), else,whenS57 > 9.111757
and S101 > 11.925628, then it is Ch2.
In the last column of Table 2, a total of 8 genes, from amongst all the genes identified through clustering, are used for classification. The first three models (Runs 1 to 3) are quite different based on genes included in their decision trees. With the deletion of the suspected “abnormal” array, the decision trees generated accordingly (Runs 4 to 6) all agree on S2 as one of the most informative genes. Models 5 and 6 are simpler in that they only involve one gene. The consistency (identification of S2 gene) and simplicity of models appear to validate the deletion of the “abnormal” microarray experiment. This gene was also highlighted by some preliminary statistical analyses on these data sets, e.g. t-test with p-value of 0.01.
The Pattern Recognition module may identify additional informative genes via “discover-and-mask” approach [6 and 16]. Genes discovered in the decision tree are removed (masked). The remainder of the data is reloaded into BioMiner to generate a
-1.5 -1 -0.5 0 0.5 1 1.5 2 C1 C2 C3 C4 C5 C6 C7 C8 C9 C10 C11 Cluster R at io (C h2 v s. C h1 ) C en tr oi d 12230630 12230632 12230634 12230635 12230927 12230633 12230928
Fig. 4. Clustering patterns and centroids of seven array experiments (route ii)
“Abnormal”
S57 <= 9.111757: Ch2 (5.0) Correctly Classified Instances 14 100% S57 > 9.111757 Incorrectly Classified Instances 0 0% | S101 <= 11.925628: Ch1 (7.0) Total Number of Instances 14 | S101 > 11.925628: Ch2 (2.0)
second decision tree that reports the next informative genes as nodes. This process may be repeated until (i) a drop in the discriminating accuracy of the decision tree, or (ii) until none of the remaining genes are able to distinguish the classes.
Table 2. Genes identified in models
Run # Data Sources – Channels (cases) Attributes (genes **) Genes identified 1 Unfiltered odd and even (28) intensities 71 (Run 1) S43, S17 and S66 2 Filtered average (14) ratios 149 (Run 2) S57 and S101 3 Unfiltered average (14) ratios 159 (Run 3) S95 and S66 4 (*) Unfiltered odd and even (24) intensities 41 (Run 4) S2 and S63 5 (*) Filtered average (12) ratios 110 (Run 5) S2 6 (*) Unfiltered average (12) ratios 131 (Run 6) S2 Note: * cases exclude data from one array; ** genes listed in Table1
7 Conclusions
This paper describes an approach for analyzing large amounts of gene expression data. The objective was to search for meaningful patterns related to discrimination between HCV transgenic and non-transgenic mice. The knowledge discovery experiments performed lead to classification models and the most informative genes. Looking at the classifiers generated, we can see the genes involved, the particular thresholds related to each gene in the model, the relationships (greater than or less than the thresholds), and the strength of these models.
We have tested our method on microarray data of HCV mice experiments. The approach resulted in identification of a small number of the most informative genes, from a total of 15311. From the knowledge discovery point of view, a measure of success is the extent to which the algorithms establish the best models to discriminate different groups. However, from the medical point of view, success is ultimately measured in terms of a prediction and diagnosis of the HCV, especially at the clinical level. The approach proposed in this research has potential for future disease classification, diagnostic and virology applications.
Also emphasized in our approach are the preprocessing, examination, and validation of microarray data before in-depth computation and analysis. These investigations provided us with a clear understanding of the data and resulted in the discovery of an “abnormal” array experiment. Comparison between the results from computations with or without the abnormality further highlighted this discovery. We emphasize that attention should be paid to the results of data quality evaluations, both before and after normalisation. In many studies on microarray data, validation of data quality has not been performed prior to gene discovery analyses.
Acknowledgements
The authors would like to acknowledge the contributions of all members of the BioMine project: Alan Barton, Ziying Liu, Julio Valdes, Youlian Pan and Lynn Wei
from IIT, Roy Walker, and Qing Yan Liu from the IBS at NRC and a number of former students who worked in this project. We would also like to recognize the contribution of Dr. Antonio Giulivi and the financial support from Health Canada for this work. Thanks to Bob Orchard for reviewing an earlier version of this paper.
References
1. Bigger, C.B., Brasky, K.M., Lanford, R.E.: DNA microarray analysis of chimpanzee liver during acute resolving hepatitis C virus infection. J. Virology 75 (2001) 7059-7066 2. Breiman, L., Friedman, J.H., Olshen, R.A., and Stone, C.J., Classification and Regression
Trees. Chapman & Hall, New York, (1984)
3. Cui, X., Churchill, G.: How many mice and how many arrays? Replication in mouse cDNA microarray experiments. (In press) Proceedings of CAMDA-02 (2002)
4. Drazan, K.E.: Molecular biology of hepatitis C infection. Liver Transplantation 6 (2000) 396-406
5. Dudoit, S., Fridlyand, J., Speed, T.: Comparison of discrimination methods for the classification of tumors using gene expression data. J. Am. Stat. Assoc. 97 (2002) 77-87 6. Famili, F., Ouyang, J.: Data mining: understanding data and disease modeling. Applied
Informatics (2003) 32-37
7. Friedman, J.: Getting started with MART, Tutorial, Stanford University, (2002)
8. Golub, T.R., Slonim, D.K., Tamayo, P., Huard, C., Gaasenbeek, M., Mesirov, J.P., Coller, H., Loh, M.L., Downing, J.R., Caligiuri, M.A., Bloomfield, C.D., Lander, E.S.: Molecular classification of cancer: class discovery and class prediction by gene expression monitoring. Science 286 (1999) 531-537
9. Hastie, T., Tibshirani, R., Friedman, J.: The Elements of Statistical Learning. Springer-Verlag, New York, (2001)
10. Lanford, R.E., Bigger, C., Bassett, S., Klimpel, G.: The chimpanzee model of hepatitis C virus infections. ILAR Journal 42 (2001) 117-126
11. Lanford, R.E., Bigger, C.: Advances in model systems for hepatitis C virus research. Virology 293 (2002) 1-9
12. Li, K., Prow, T., Lemon, S.M., Beard, M.R.: Cellular responses to conditional expression of hepatitis C virus core protein in Huh7 cultured human hepatoma cells. Hepatology 35 (2002) 1237-1246
13. Okabe, H., Satoh, S., Kato, T., Kitahara, O., Yanagawa, R., Yamaoka, Y., Tsunoda, T., Furukawa, Y., Nakamura, Y.: Genome-wide analysis of gene expression in human hepatocellular carcinomas using cDNA microarray: Identification of genes involved in viral carcinogenesis and tumor progression. Cancer Research 61 (2001) 2129-2137
14. Quinlan, J.R.: C4.5: programs for machine learning. Morgan Kaufmann, San Mateo (1993) 15. Su, A.I., Pezacki, J.P., Wodicka, L., Brideau, A.D., Supekova, L., Thimme, R., Wieland, S.,
Bukh, J., Purcell, R.H., Schultz, P.G., Chisari, F.V.: Genomic analysis of the host response to hepatitis C virus infection. Proc. Natl. Acad. Sci. USA 99 (2002) 15669-15674
16. Walker, P.R., Smith, B., Liu, Q.Y., Famili, F., Valdes, J.J., Liu, Z.: Data mining of gene expression changes in Alzheimer brain. Data mining in Genomics and Proteomics, a special issue of AI in Medicine, (2004)
17. Witten, I., Eibe, F.: Data Mining: Practical Machine Learning Tools and Techniques with Java Implementations. Morgan Kaufmann, San Mateo (1999)
18. Yang, Y.H, Dudoit S., Luu, P., Speed, T.: Normalization for cDNA Microarray Data, SPIE BiOS, San Jose, California, (2001)