Back pressure effect on three-way catalyst light-off
The MIT Faculty has made this article openly available. Please share how this access benefits you. Your story matters.Citation Baron, Jan H. and Wai K. Cheng. "Back Pressure Effect on
Three-Way Catalyst Light-Off." International Journal of Engine Research 19, no. 5 (June 2018).
As Published 10.1177/1468087418779505
Publisher Professional Engineering Pub.
Version Author's final manuscript
Citable link https://hdl.handle.net/1721.1/121572
Terms of Use Creative Commons Attribution-Noncommercial-Share Alike
Corresponding author
Wai K. Cheng, Massachusetts Institute of Technology, 77 Massachusetts Avenue, room 31-285, Cambridge, MA 02139, USA.
Email: [email protected]
Back Pressure Effect on Three-Way Catalyst Light-Off
Jan H. Baron, Wai K. Cheng
Department of Mechanical Engineering, Massachusetts Institute of Technology 77 Massachusetts Ave, Cambridge, MA 02139, USA
ABSTRACT
The effect of back pressure on the light-off of a modern spark ignition engine 3-way catalyst has been assessed by measuring the hydrocarbon (HC) conversion efficiency in a hot flow bench and in the cold-idle period in an engine. In the flow bench experiment, small amount of propane/air mixture is used as a surrogate for the hydrocarbon mixture. The conversion efficiency is found to be only a function of temperature. The efficiency is independent of pressure, space velocity, and the equivalence ratio of the hydrocarbon mixture for 1. In the engine test, while the engine-out exhaust gas temperature is higher at a higher back pressure, there is little difference between the gas temperatures at the catalyst entrance for different back pressures at retarded spark timing. This
observation is attributed to the larger amount of exhaust HC oxidation between the engine exit and the catalyst entrance with the lower back pressure. The heat release from this oxidation compensates for the lower engine-out exhaust temperature at the lower back pressure. The catalyst temperature increases modestly and light-off time shortens correspondingly at the higher back pressure. This observation is attributed solely to the increase in mass flow rate (and thus exhaust sensible enthalpy flow rate) of the engine needed to overcome the additional pumping loss due to the throttling of the exhaust. These results have been confirmed with a simple 1D catalyst model.
Key Words:
Catalyst Light-Off, Back Pressure
INTRODUCTION
A fast catalyst light-off at cold-start is essential for gasoline engines to meet increasingly stringent emissions regulations. A three-way catalytic converter (TWC) is commonly used for exhaust gas aftertreatment. The catalyst converts the three toxic pollutants, unburned hydrocarbons (HC), carbon monoxide (CO), and nitrogen oxides (NOx) to carbon dioxide, water and nitrogen. Above the light-off temperature, the conversion efficiency can be as high as 99%. However, below light-off temperature at cold-start, those pollutants pass the converter practically unchanged.
The start-up idle condition at cold-start in practically all certification cycles is characterized by a relatively low exhaust gas mass flow rate and temperature. The situation is even more severe in downsized, turbocharged engines. Cedrone et al. [1] has observed that increased exhaust gas back pressure increases the exhaust gas enthalpy flow rate into the catalytic converter significantly. This enhancement can potentially speed up the light-off time. Fig. 1 shows the increase of enthalpy flow rate at 1200 rpm, 200 kPa NIMEP as a function of spark timing, for different levels of exhaust throttling. The exhaust gas enthalpy flow rate increases significantly with back pressure, up to 50% in some cases, for retarded spark timing.
Fig. 1 Exhaust gas enthalpy flow rate from Cedrone et al. [1]; 1200 rpm, 200kPa NIMEP at different levels of exhaust throttling. Nominal back pressure corresponds to the absolute exhaust gas back pressure when the engine is motored at wide open throttle (WOT).
While the back pressure increases the enthalpy flow to the catalyst and facilitates its warm-up, the catalyst behavior with respect to back pressure needs to be characterized. This paper investigates the influence of back pressure on catalyst light-off in detail. First, the influence of back pressure on the converter’s reaction kinetics is investigated
independently from engine operation in a catalyst flow bench. Then, the influence of back pressure on engine operation and the catalytic converter is investigated in an engine under cold-fast-idle condition. Finally, a numerical 1D-model based on the experimental results and catalyst models found in literature is developed to assess catalyst light-off with back pressure.
In this work, the conversion efficiency of hydrocarbon (HC) is used as an indicator of the catalyst light off. This choice is motivated by that HC emission has the most demanding regulatory requirement in the cold start process, and that once the catalyst lights off, the conversion efficiencies of all three regulated pollutants (HC, NOx and CO) jump sharply. Thus the HC conversion efficiency is a good indicator for catalyst light-off.
EXPERIMENTAL SETUP
The converter used in both the flow bench experiment and in the engine test is a two-brick, two-liter volume TWC from a production engine (GM LNF engine) with a density of 750 cells per square inch (CPI). It is equipped with four K-type thermocouples which measure the temperature along the centerline of the converter; see Fig. 2. In addition, the temperature of the engine-out gas is measured at 12.5 cm downstream from the exhaust valve. This temperature will be referred to as that in the runner. The thermocouple response time is in the order of 0.2 s. A pressure sensor at the converter inlet measures the absolute exhaust back pressure, which is regulated by a high temperature butterfly value.
Fig. 2 Schematic drawing of the two-brick TWC, including positioning of temperature and pressure sensors; to scale except for channel size.
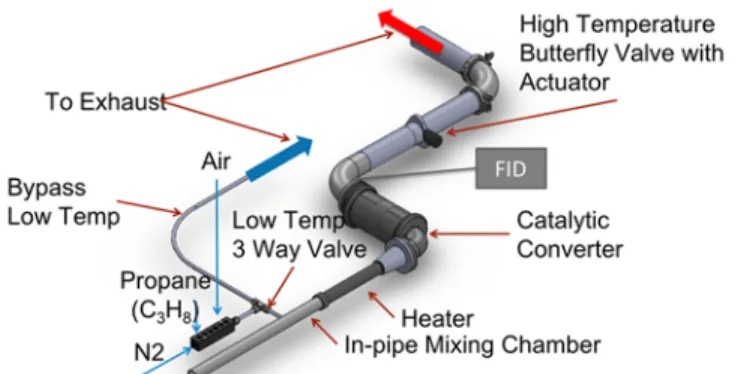
The schematic setup of the flow bench for testing the catalytic converter is shown in Fig. 3. The reactants, air and propane as an unburned hydrocarbon surrogate, can either be bypassed to the exhaust or fed through the converter. The feed gas is balanced by nitrogen as a surrogate for the burned gas. No water vapor has been introduced in the feed gas, although the presence of water vapor in the engine exhaust would have influenced the catalyst conversion efficiency.
Fig. 3 Flow bench setup for actual sized TWC (to scale).
All gases are metered in with mass flow controllers at a precision of plus minus 2%. A multi-stage mixing chamber upstream of the heater guarantees a homogenous gas mixture. The closed loop controlled electric heater can be set to follow a desired
temperature profile. A flame ionization detector (FFID) measures the HC-concentration downstream of the TWC. The converter’s HC-conversion efficiency can be calculated using the known upstream concentration.
c
Fig. 4 Schematic setup of the engine experiment showing the flow controls and the measurements.
The General Motors LNF engine is used for the engine experiments. The 2L engine is turbo-charged with direct injection, and is representative of modern engines. The fuel used is a standard certification gasoline (Haltermann HF 437; RON=97.4; MON=89, and RVP=62 kPa; the fuel contains no oxygenate). Fig. 4 is a schematic of the setup. The TWC is installed just downstream of the turbocharger outlet. FFID sensors upstream and downstream of the converter are used to compute the HC-conversion efficiency of the converter. A nondispersive infrared sensor (NDIR) is used to measure the CO- and CO2-concentrations downstream of the converter. The lambda sensor is located just upstream of the TWC near the exhaust pressure sensor. The coolant can be conditioned via a heat exchanger to an external temperature controlled stream to a set temperature. The fuel to the direct-injector is provided by a piston accumulator, which is pressurized by nitrogen for constant fuel pressure. The geometric data and fast-idle operating condition of the GM LNF engine can be found in Table 1. The negative valve overlap of 20o CA corresponds to the parked position of the cam phasers.
In the engine test, the engine coolant temperature is regulated to 20o C, and the engine is maintained at 1200 rpm. The fuel flow is adjusted to keep =1, and the air flow is set to obtain a NIMEP value at 200 kPa.
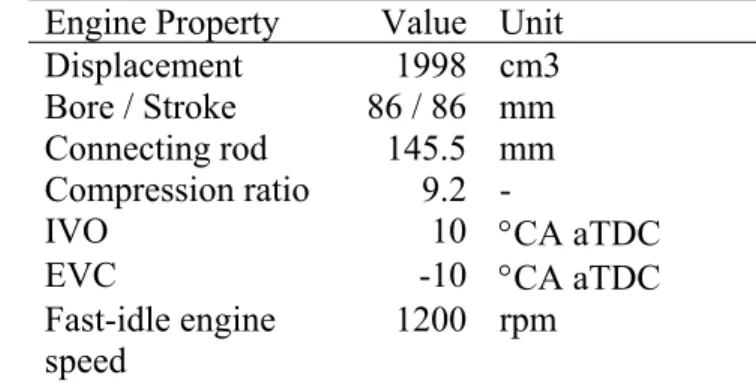
Table 1 Engine parameters of General Motors’ DI-LNF production engine and fast-idle operating conditions.
Engine Property Value Unit Displacement 1998 cm3 Bore / Stroke 86 / 86 mm Connecting rod 145.5 mm Compression ratio 9.2
-IVO 10 CA aTDC
EVC -10 CA aTDC
Fast-idle engine speed 1200 rpm TWC 1stbrick 2ndbrick T4T3T2T1 P Coolant FFID FFID NDIR Exhaust throttle Texh Intake throttle
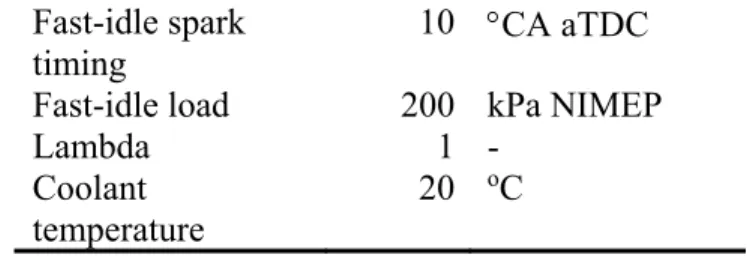
Fast-idle spark
timing 10 CA aTDC Fast-idle load 200 kPa NIMEP
Lambda 1
-Coolant
temperature 20 oC
QUASI-STEADY BENCH TEST RESULTS
Quasi-steady state experiments have been conducted on the flow bench to investigate the influence of back pressure on the TWC light-off temperature. Before every experiment, the TWC is cleaned at a temperature of 500o C, by passing nitrogen and a stoichiometric mixture of air and propane through the converter. Then the TWC is cooled down to room temperature with nitrogen flow in the absence of any reactants. Before every quasi-steady state experiment, the catalytic converter is pre-heated with nitrogen at an inlet
temperature of 190o C for five minutes to reach steady state. The reactants are then added to the nitrogen flow after the converter has reached steady state at 190o C and the
temperature is slowly ramped up with a linear rate of 5o C/min. This temperature ramp rate is sufficiently slow for quasi-steady state conditions to prevail; the procedure is often used in the literature [2]. The propane concentration in the simulated exhaust gas stream is kept low at a nominal value of 500 ppm, to minimize the heat release and resulting temperature rise from the hydrocarbon conversion.
The quasi-steady state HC-conversion efficiency of the converter is plotted against the converter’s inlet-temperature in Fig. 5. The figure includes back pressures between 103 kPa and 207 kPa and gas mass flow rates between 30 kg/h and 40 kg/h. Within these limits, the HC-conversion efficiency of the converter depends only on the
inlet-temperature of the converter; it is not influenced by the mass flow or the back pressure.
Fig. 5 TWC’s HC-conversion efficiency for different pressures and space velocities. The reference space velocity (SVo) as depicted in Fig. 5 corresponds to the space velocity at the reference temperature of 273.15 K. Since the temperature is ramped up throughout
the experiment, the actual space velocity (SV) is changing as the temperature changes. SV is proportional to the product of the temperature and reference space velocity:
𝑆𝑉 𝑉 𝑉 𝑚 𝑉 ⋅ 1 𝜌 𝑚 𝑉 ⋅ 𝑅 ⋅ 𝑇 𝑝 𝑚 ⋅ 𝑅 ⋅ 𝑇 𝑉 ⋅ 𝑝 ⋅ 𝑇 𝑇 𝑆𝑉 𝑚, 𝑝 ⋅ 𝑇 𝑡 𝑇 (1) (The symbols are defined in the nomenclature section.) In each quasi-static temperature sweep experiment, the mass flow (𝑚) and pressure (𝑝) are constant.
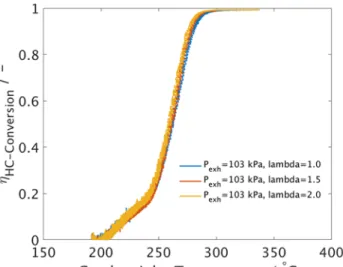
An increase in also does not have any effect on the temperature dependence of the HC-conversion efficiency for >= 1. Fig. 6 depicts the results for a mass flow rate of 30 kg/h at the baseline exhaust pressure of 103 kPa for ranging from 1 to 2.The results are not sensitive to . Although not shown here, the results have been found to be the same (i.e., not sensitive to for 1 for mass flow rates up to 40 kg/h and back pressures of up to 200 kPa.
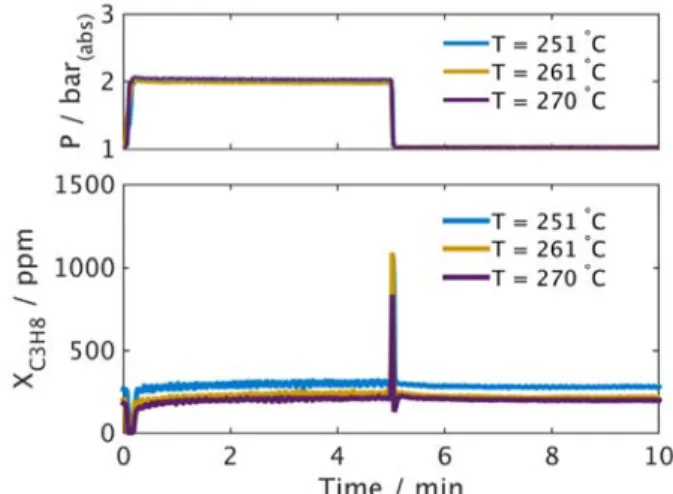
Fig. 6 TWC’s HC-conversion efficiency at various lambda values; mass flow at 30 kg/h. A step change in pressure experiment is used to investigate the dynamic response of the conversion efficiency to back pressure. The flow bench is first set up to steady-state condition at a fixed mass flow rate, temperature, and a high back pressure of 200 kPa. The back pressure is then suddenly reduced to the ambient pressure of 100 kPa in a step change by a fast-opening of the butterfly valve at the exhaust.
Typical results for the step pressure change experiments are shown in Fig.7. The propane concentration downstream of the converter is indicative of the HC conversion efficiency. (The “spike” of the propane concentration at the pressure transition point is an artifact due to the pressure response of the FFID instrument.) That this value is identical before and after the pressure step change confirms that the conversion efficiency is indeed independent of the pressure and there is no dynamic effect.
From the flow bench experiments, it is concluded that neither the back pressure nor the mass flow rate has any influence on the chemical kinetics mechanism that governs the catalyst light-off time. The only factor that would impact the light-off time is the temperature.
Fig. 7 Step change in back pressure in the upper diagram; corresponding propane concentration downstream of the converter in the lower diagram. The temperatures in the legend are those at the inlet (T1). Flow rate at 30 kg/h.
ENGINE TEST RESULTS
While the catalyst light-off time depends only on temperature in a steady state bench test, the consideration is different in an engine experiment. With increased exhaust back pressure in an engine, the pumping work of the engine increases. To maintain the same NIMEP, the fuel and air flow has to increase under stoichiometric operation. Increasing the back pressure from the baseline of 102 kPa to 151 kPa for the cold-fast-idle operating condition depicted in Table 1, the exhaust gas mass flow is increased by 14.7% from 34.7 kg/h to 39.8 kg/h. The back pressure increases the residual gas fraction, which leads to a slower combustion, which, in turn, raises the exhaust temperature. Furthermore, with the higher back pressure, there is less expansion in the blow-down of the exhaust gas from the cylinder to the exhaust runner; thus the exhaust gas temperature will be higher. The increase flow rate and the higher temperature both contribute to a higher feed gas enthalpy flow into the catalyst.
The temperature histories at the measurement points in the TWC depicted in Fig. 2 plus the runner are shown in Fig. 8. The engine was motored at the desired cold-idle speed of 1200 rpm. Fuel injection commenced at time zero. The solid lines are for the engine operating under the baseline condition at exhaust pressure of 102 kPa; the dash lines are for that under increased back pressure at exhaust pressure of 151 kPa. The gas
temperature in the exhaust runner is significantly higher in the high back pressure case, up to 80o C after 90s following cold-start.
Fig. 8 Temperature history in a cranking start for the feed gas and for the different locations in a TWC; see Fig.2 for the thermocouple locations.
In spite of the difference in temperatures at the exhaust runner with the different back pressure, Fig. 8 shows that the temperatures at the catalyst entrance (location T1) are the same for the two exhaust pressure cases. Plausible explanations are: (a) the heat loss between the exhaust runner and the converter inlet is higher in the high back pressure case; (b) that there is heat release between the runner and the catalyst; the amount is higher in the low back pressure case.
Heat transfer analysis indicates that explanation (a) could not account for the observation (see appendix). To assess explanation (b), the runner and the catalyst inlet temperatures have been measured in a series of steady state experiments in which the spark timing was changed (Fig. 9). For a spark timing of 5o CA aTDC and earlier, there is a drop in gas temperature from the exhaust runner to the converter inlet; this behavior has been observed for both the high- and low-pressure cases.
Fig. 9 Steady state exhaust gas temperatures in the exhaust runner and converter inlet (T1 in Fig. 2 and 4) as a function of spark timing (deg. aTDC).
For more retarded spark timing, however, the catalyst inlet temperature exceeds the exhaust runner temperature. This is a clear indication for heat release by HC oxidation in
the exhaust system. The effect is more prominent in the low-pressure case. At a spark timing of 10o CA aTDC the converter inlet temperature in the low-pressure case is 40o C higher than the exhaust runner temperature of 590o C. There is little difference between the converter inlet temperatures for the high- and low- pressure cases, notwithstanding that the exhaust runner temperature is significantly higher in the high-pressure case, at 640o C for 152 kPa compared to 590o C at 102 kPa.
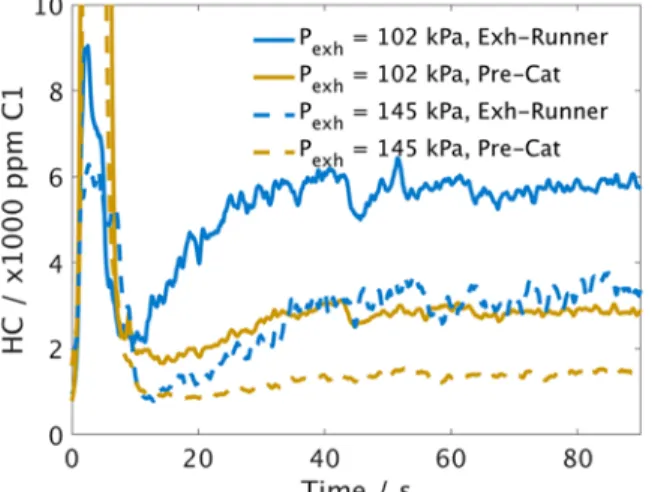
Fig. 10 HC concentration as a function of time in the exhaust runner (blue) and at converter inlet (red); spark timing at 10 deg. atdc.
Fig. 10 depicts the HC-concentrations at the runner and at the converter inlet for the engine light-off test under two different back pressures. Due to the higher load and more retarded combustion, the HC concentrations at the runner for the higher back pressure case is always lower than those for the lower back pressure case. After an initial start-up transient (to approximately 40 s clock time in the figure), the difference in
HC-concentrations between the exhaust runner and converter inlet is roughly 3000 ppm C1 in the low-pressure case, whereas in the high-pressure case the difference is significantly lower, at approximately 1900 ppm C1. Therefore, a significantly larger amount
(approximately 50 % more) of HC is oxidized in the exhaust pipe connecting the runner to the converter. The difference in this heat release makes the temperature at the
converter inlet to be approximately the same for the low and high back pressure cases. Another phenomenon observed for the catalyst internal temperatures is the fast-initial temperature rise which plateaus to a constant temperature before rising further (Fig. 11). This temperature bump is attributed to condensation of the exhaust gas water vapor which releases its latent heat of vaporization.
The water content in the exhaust gas is 12.6% based on the H/C ratio of the fuel. The corresponding partial pressure for the water is 130 kPa at an exhaust pressure of 102 kPa. The dew point for water vapor at 130 kPa is 51o C. For the high back pressure at 151 kPa, the water partial pressure increases to 190 kPa. Then the dew point is 59o C. These values are consistent with the observed temperatures at the plateau region for the two cases at 55o and 62.5o C respectively.
The water condensation effect should not significantly impact the catalyst light-off
process because: (a) the dew point temperature is too low for any catalytic reaction, (b) as the catalyst warms up beyond the dew point, the condensed water would re-evaporate and takes away approximately the same latent heat that has been deposited previously onto catalyst substrate in the condensation process. Therefore, the overall catalyst heat up time should not be affected.
Fig. 11 Temperature transient and exhaust gas water vapor saturation temperatures (cf. Fig. 2 for color coded thermocouple locations).
MODELING RESULTS
Several types of catalyst light-off models can be found in literature. While catalyst models vary greatly in complexity, they mostly follow a common structure as
characterized by Shaw et al. [3]. Some simplified geometry of the converter is taken, then three main components are used: a thermal model, a chemistry model, and an oxygen storage model (Fig. 12). The oxygen storage capacity of the converter is relevant
primarily for modeling fast transients such as encountered in rapid accelerations [3]. For the relatively long time scale in the light-off process at fast-idle, the oxygen storage component is not considered.
Fig. 12 General structure of light-off models in literature. Model choice for the light-off model of this paper are marked [3].
Since the flow bench results show that the converter conversion kinetics are not influenced by back pressure and flow rate, a static efficiency curve based on the flow
bench results could be used to model the efficiency as a function of temperature. The CO conversion efficiency versus temperature is assumed to be the same as the HC conversion efficiency but with the curve shifted by 45o C to the left in the temperature scale to yield a lower light-off temperature [4].
The temperature history of the catalyst substrate is simulated by a 1D model which should be sufficiently accurate, since the axial temperature gradient is the dominant factor that governs the catalyst light-off process. Neglecting transverse temperature gradients results in small errors in the overall conversion efficiency. An energy balance approach for both the solid and gas phase is used. The gas temperature is given by
𝜌 𝜖 ⋅ 𝑐 ⋅𝜕𝑇 𝜕𝑡 𝜖𝜆 ⋅ 𝜕 𝑇 𝜕𝑧 𝑚 𝐴 ⋅ 𝑐 ⋅ 𝜕𝑇 𝜕𝑧 ℎ ⋅ 𝐴 ⋅ 𝑇 𝑇 (2) The symbols are defined in the nomenclature section. The terms on the right-hand side of the equation are diffusion in axial direction, convection in axial direction and convective heat transfer between gas and the walls of the channel. he open cross sectional area of the converter is , and the cross-sectional area is 𝐴 . The TWC’s specific geometric area factor 𝐴 is equal to the channel surface area divided by the channel volume.
For the solid phase the partial differential equation is given by 𝜌 1 𝜖 ⋅ 𝑐 ⋅𝜕𝑇 𝜕𝑡 1 𝜖 𝜆 ⋅𝜕 𝑇 𝜕𝑧 ℎ ⋅ 𝐴 ⋅ 𝑇 𝑇 𝐴 ⋅ 𝛥𝐻 𝑅 𝐴 𝑉 ⋅ ℎ ⋅ 𝑇 𝑇 (3) The terms on the right-hand side of the equation are axial diffusion, convective heat transfer between gas and solid phase, internal source, i.e. heat release from the conversion of the hydrocarbons, and convective heat loss to the environment.
The system of partial differential equations above is solved using a Matlab solver (pdepe) for initial-boundary value problems for parabolic-elliptic partial differential equations in 1-D. The feed gas HC and CO concentrations have been set to 2700 ppm and 3000 ppm respectively, which corresponds to average values typically measured in the engine experiment. The model does not take into account any hydrogen in the feed gas.
Assuming the H2 concentration is 1000 ppm (~1/3 of that of CO), the enthalpy flow due to H2 is only 8% of the total. And hence it should not change the results materially. There are 39 mesh points for each 7.6 cm long brick of the catalyst, resulting in a spatial
resolution of 2 mm, and a time step is chosen to be 2 seconds.
The results of the simulation versus the experimental results are depicted in Fig. 13. The temperature at the inlet (position T1) is an input based on the values obtained from the engine test. There is good agreement between the simulated and the observed
condensation phenomenon, and hence the initial temperature rise by approximately 35o C is not captured by the model. As explained in the previous section, this difference does not substantially affect the overall catalyst temperature development.
Fig. 13 Simulated TWC internal temperatures compared to observed values at the locations depicted in Fig. 2. Pexh = 151 kPa.
CONCLUSIONS
Flow bench experiments indicate that the TWC light-off process under steady flow that mimics the engine cold-fast-idle condition is primarily a function of the catalyst
temperature and not a function of the exhaust gas mass flow, back pressure, and, for a lean mixture, the air-fuel ratio of the hydrocarbon in the feed gas. The independence to back pressure has been further confirmed dynamically by observing that the catalyst conversion efficiency remains the same through a step transient in the back pressure. In an engine test under cold-fast-idle condition (1200 rpm, 200 kPa NIMEP, =1, and spark a 10o aTDC), the increase of pumping work with back pressure requires a higher fuel-air flow through the engine. The decrease in pressure ratio in the blow-down process at higher back pressure also yields a higher engine out exhaust gas temperature.
However, there is less HC oxidation and therefore less heat release in the exhaust system between the engine and the catalyst. Hence, the exhaust gas at the converter inlet is at roughly the same temperature for high and for low back pressure. The overall effect with back pressure increase is that there is an increase in the enthalpy flow into the converter primarily due to the increase in mass flow rate. The result is a modest increase in the catalyst temperature and a modest shortening of the light-off time.
A 1D- catalyst model based on energy balance between the gas stream and the catalyst substrate is employed to simulate the engine test. The flow bench derived static
conversion efficiency curve, which is only a function of temperature, is used to compute heat release from species conversions. The model results are in good agreement with the experimental values, and confirm that the conversion efficiency is only a function of temperature.
Funding statement
The authors would like to acknowledge the support for this research by Borg-Warner, Fiat Chrysler Automobiles, Ford Motor Company, and General Motors Company through a Consortium on Engine and Fuels Research.
NOMENCLATURE
Acs Catalyst open area
Ageo Catalyst channel surface area to volume ratio
Aout Catalyst heat transfer area to ambient
aTDC After top-dead-center
B Hydraulic diameter of exhaust system
CA Crank angle
cpg Specific heat at constant pressure for gas
CPI Cells per square inch
cs Catalyst substrate specific heat EVC Exhaust valve close
FFID Fast flame ionization detector H Heat transfer coefficient to the
substrate
hamb Heat transfer coefficient to the ambient
HC Hydrocarbon
Hj Heat release from reaction j IVO Intake valve open
K Thermal conductivity
𝑚 Mass flow rate MON Motor octane number
NDIR Non-dispersive infrared detector NIMEP Net indicated mean effective
pressure
Nu Nusselt number P Pressure
Pexh Exhaust pressure R Gas constant Rj Rate of reaction j
RON Research octane number RVP Reid vapor pressure SV Space velocity
SV0 Space velocity at the reference temperature T0 T Time T Temperature T0 Reference temperature (273.15K) Tw Wall temperature Tamb Ambient temperature Tcat Catalyst temperature Tg Gas Temperature TWC Three-way catalyst Vcat Catalyst volume
𝑉 Exhaust volumetric flow rate x Spatial coordinate along flow
path
WOT Wide-open-throttle z Distance along catalyst Catalyst channel open area
fraction
Air fuel equivalence ratio g Gas thermal conductivity s Substrate thermal conductivity g Gas density
s Substrate density
REFERENCES
[1] Cedrone K, Cheng WK. Using valve timing and exhaust back pressure to improve catalyst warm-up time. SAE Paper 2013-01-2656, 2013
[2] Matthess N, Schweich D, Martin B. and Castagna F. From light-off curves to kinetic rate expressions for three-way catalysts. Top. Catal. 2001, 16: 119–124.
[3] Shaw BT, Fischer GD, and Hedrick JK. A simplified cold start catalyst thermal model to reduce hydrocarbon emissions. IFAC Proc. 2002, 35 (1) :307-312.
[4] Heywood JB. Internal Combustion Engine Fundamentals. McGraw-Hill, 1988
[5] Sabatini, S. et al. A new semi-empirical temperature model for the three-way catalytic converter. IFAC-PapersOnLine, 2015, 48 (15): 434-440.
APPENDIX
Estimate of feed gas temperature drop from runner to catalyst inlet due to heat transfer The temperature drop T from the exhaust runner to the catalyst inlet due to heat transfer is:
∆𝑇 𝑘 𝑇 𝑇 𝑁𝑢 𝑚𝑐 𝑏 𝑑𝑥
where the integration is along the flow path. (See Nomenclature section for symbol definitions.) The flow is at high Reynolds number; hence the Nusselt number Nu is proportional to 𝑚0.8 . The scaling with respect to the change of back pressure is then governed by
0 2 2 1 2 1 2 1 . w w T T T m T m T T where the overbar denotes the average quantities along the flow path. Taking
representative values at the 40 s point in Fig. 11, T2/ T1 due to heat transfer is 1.05. The observed value is 1.42. Therefore, the temperature drop observed could not be explained by heat transfer alone.
![Fig. 1 Exhaust gas enthalpy flow rate from Cedrone et al. [1]; 1200 rpm, 200kPa NIMEP at different levels of exhaust throttling](https://thumb-eu.123doks.com/thumbv2/123doknet/14140369.470306/3.918.291.627.318.582/exhaust-enthalpy-cedrone-nimep-different-levels-exhaust-throttling.webp)