Publisher’s version / Version de l'éditeur:
Vous avez des questions? Nous pouvons vous aider. Pour communiquer directement avec un auteur, consultez la première page de la revue dans laquelle son article a été publié afin de trouver ses coordonnées. Si vous n’arrivez pas à les repérer, communiquez avec nous à PublicationsArchive-ArchivesPublications@nrc-cnrc.gc.ca.
Questions? Contact the NRC Publications Archive team at
PublicationsArchive-ArchivesPublications@nrc-cnrc.gc.ca. If you wish to email the authors directly, please see the first page of the publication for their contact information.
https://publications-cnrc.canada.ca/fra/droits
L’accès à ce site Web et l’utilisation de son contenu sont assujettis aux conditions présentées dans le site LISEZ CES CONDITIONS ATTENTIVEMENT AVANT D’UTILISER CE SITE WEB.
4th NRC Symposium on Computational Fluid Dynamics, High Performance
Computing Reality [Proceedings], pp. 1-8, 2005-12-01
READ THESE TERMS AND CONDITIONS CAREFULLY BEFORE USING THIS WEBSITE.
https://nrc-publications.canada.ca/eng/copyright
NRC Publications Archive Record / Notice des Archives des publications du CNRC :
https://nrc-publications.canada.ca/eng/view/object/?id=4d7a50ac-6ce2-40b3-b86e-2f3a22f7e623 https://publications-cnrc.canada.ca/fra/voir/objet/?id=4d7a50ac-6ce2-40b3-b86e-2f3a22f7e623
NRC Publications Archive
Archives des publications du CNRC
This publication could be one of several versions: author’s original, accepted manuscript or the publisher’s version. / La version de cette publication peut être l’une des suivantes : la version prépublication de l’auteur, la version acceptée du manuscrit ou la version de l’éditeur.
Access and use of this website and the material on it are subject to the Terms and Conditions set forth at
Application of CFD technique to investigate performance of emergency
ventilation strategies in a road tunnel
http://irc.nrc-cnrc.gc.ca
Applic at ion of CFD t e chnique t o
inve st igat e pe rfor m a nc e of e m e rge ncy
ve nt ilat ion st rat e gie s in a roa d t unne l
K a s h e f , A . ; B é n i c h o u , N . ; L o u g h e e d , G .
N R C C - 4 5 3 7 0
A version of this document is published in / Une version de ce
document se trouve dans: 4
thNRC Symposium on
Computational Fluid Dynamics, High Performance Computing
Reality, Ottawa, ON., Dec. 6, 2005, pp. 1-8
Application of CFD Technique to Investigate Performance of Emergency
Ventilation Strategies in a Road Tunnel
Ahmed Kashef, Noureddine Bénichou, and Gary Lougheed Fire Research Program (FR)
Institute of Research for Construction (IRC)
ABSTRACT
A research project is being conducted at the National Research Council of Canada (NRC) to evaluate the effectiveness in a road tunnel of the current emergency ventilation system (EVS) to control smoke spread in the event of a fire. The research study includes two phases: namely, a numerical and an experimental phase. The numerical phase uses the Fire Dynamic Simulator (FDS)[ ]1 Computational Fluid Dynamics (CFD) model to study smoke ventilation in the tunnel. The experimental phase is used to calibrate and partially verify the CFD model and to provide the necessary initial and boundary conditions.
FDS was successfully used to conduct a parametric study to assess the effects of different parameters on the performance of EVS. The results of the study indicated that the phenomenon of “backlayering” did not occur in all simulated cases. The backlayering phenomenon is the case where the smoke moves against the provided ventilation upstream of the fire causing a dangerous environment to the tunnel users. Therefore, the current ventilation scenarios and side vent openings are deemed appropriate with regards to preventing the occurrence of backlayering.
1 INTRODUCTION
A study has been conducted at the NRC to evaluate the performance of the EVS in the event of a fire. The study aims at: assessing the ability of in-place emergency ventilation strategies to control smoke spread and minimize the impact of smoke on tunnel users in the event of a major fire; recommending guidelines for improving the ventilation operation to maximize intervention effectiveness; and allowing future development of an intelligent ventilation system with intervention based on a pre-established scenario of ventilation activated using automatic fire detection.
An extensive literature review on vehicle tunnel ventilation for fire safety was completed[ ]2. Airflow measurements and fire tests were conducted in the
tunnel. The initial airflow measurements[ ]3 were used to establish the ventilation scenarios for the fire tests and to provide input data for the CFD models. Two fire tests were conducted in the tunnel using a clean-burning propane system that produces minimal smoke. Artificial smoke was added for visualization purposes. Temperature and optical smoke density measurements were conducted at 80 locations downstream and upstream of the fire. Also, the air speed was measured at several locations along the tunnel. One fire was located in the middle of the tunnel and one close to the exhaust fans at the north end of the tunnel[ ]4.
All CFD simulations were carried out in the absence of traffic in the tunnel. It is assumed that the traffic downstream of the fire would be cleared shortly after the eruption of the fire. Thus, the supposition of no traffic in the tunnel would not affect the outcome of the CFD simulations with regards to smoke movement and control. However, the existence of traffic upstream of the fire would act as obstacles that may affect the movement of supplied airflow.
The current paper presents the parametric study performed, using FDS, assuming a heat source of 20 MW (equivalent to a bus on fire) in the tunnel. With the restriction of carrying hazardous goods into the tunnel, this fire load represents a rational design fire. Two fires locations were simulated: one located at the middle of the tunnel and one close to the exhaust fans at the north end of the tunnel. These two locations were deemed to cover the two main situations probable to occur in the tunnel corresponding to fire occurring inside or outside the middle region of the tunnel. The parameters examined were the capacity of fan VA201, in supply mode, and the percentage opening of the upper and lower side vents.
1.1 Tunnel Geometry and Ventilation System
The L.-H.-La Fontaine road tunnel (Figure 1), built in 1964, is located in Montreal, Quebec, Canada, and travels underwater in a North-South direction. The tunnel is 1.8 km long with three lanes in each direction, inside two concrete tubes. Two ventilation
towers are located at the ends of the underwater section. A control and monitoring centre for the tunnel is located at the North tower. A central section separates the two tubes. Galleries located in this section are used to supply air along the tunnel length via openings distributed along the walls. These galleries can also be used as evacuation routes. Doors at various locations along the length of the tunnel provide access to the gallery and the other traffic tube. The wall openings have adjustable dampers to ensure uniformity of air distribution. The side vents are situated in two rows, upper and lower, located at heights of 3.9 and 1.0 m above the tunnel floor, respectively, and at intervals of approximately 6 m. The two rows of vents are offset by 3 m.
The tunnel ventilation is provided by a semi-transverse system with local extraction points (Figure 1). The ventilation system is composed of 8 ceiling exhaust fans (4 fans for each roadway) and 8 fans that supply air through side vents uniformly distributed along one wall for each roadway. All fans can operate in reverse mode. Therefore, fresh air may be supplied at either the ceiling (fans VE-151 through VE-254), or by fans VA-101 through VA-204 through the side vents. In the exhaust mode, fans VE-151 through VE-254 can operate at 30 or 60 Hz (cycles per second), and in the supply mode they can only operate at 60 Hz. In the supply mode, fans VA-101 through VA-204 can operate at: 30, 40, or 60 Hz. In the exhaust mode, these fans can only operate at 60 Hz.
N o r t h
S o u t h
S l o p e
1.2 Fire Tests
Fire tests were conducted using a propane burner system developed by NRC[ ]4. Two fire tests were conducted in the North Roadway of the tunnel: one in the middle of the tunnel and one close to the exhaust fans at the North end of the tunnel (Figure 3).
A fire size of 2 MW was selected so as to minimize damage to the tunnel structure and different components and to produce reliable data for the calibration and validation of the numerical models.
The objective was to limit the temperature at the tunnel ceiling below 100°C. More details on fire tests can be found in reference[ ]4.
2 NUMERICAL SIMULATIONS
The Fire Dynamic Simulator (FDS) model[ ] 1 employs the Large Eddy Simulation (LES) approach to solve the large scales of motion and model the small scales that are assumed to be universal. The LES approach produces a transient solution to the actual Navier-Stockes equations and thus has an advantage in
modeling fire-induced instantaneous flow fields which are inherently transient.
FDS models fire using the “mixture fraction-based” combustion model in which large-scale convective and radiative transport phenomena are directly simulated and the physical processes occurring at small length and time scales are approximated. The model does not simulate the actual combustion process in the fire and is based on the assumption that the combustion is mixing-controlled and that the reaction of fuel and oxygen is infinitely fast (fuel and oxygen cannot co-exist and they will react at any temperature). The local heat release rate is computed from the local oxygen consumption rate at the flame surface, assuming that the heat release rate is directly proportional to the oxygen consumption rate, independent of the fuel involved. This relation is the basis of oxygen calorimetry.
The FDS code was used to simulate a representative fire heat-release rate of 20 MW corresponding to a bus or truck on fire. The fire was modelled as an equivalent gasoline pool[ ]5. An equivalent gasoline pool with an area of 8 m2 with CO2, CO and smoke flow production rates of 1.5 kg/s, 0.077 kg/s, and 60 m3/s, respectively.
Two fire were simulated: one located at the middle of the tunnel (hereafter called “Mid-Fire” scenario - at a distance in the range of 555 to 615 m from the North portal) and in the other scenario the fire is located near exhaust fans VE-151 and VE-153 (hereafter called “Exhaust-Fire” scenario - at a distance in the range of 355 to 555 m from the North portal) (Figure 3).
2.1 Geometry and Boundary Conditions
Only the North Roadway of the tunnel and its galleries (Figure 2) were simulated with a mesh consisting of 573,000 control volumes. The mesh was composed of three uniform grids: (570 x 30 x 15) upstream and downstream of the fire source and one refined grid around the fire source (100 x 30 x 20).
Fans VA-103 and V-A201 were simulated as mass sources or sinks depending on the ventilation scenario. Free boundaries with the pressure equal to the static ambient pressure were assumed at the North and South portals. Fans VE-151 and VE-153 were simulated as mass sinks.
2.2 Mid-Fire Scenario Simulated Cases
Six cases were investigated under this fire scenario. They are described in Table 1. The parameters examined were the capacity of fan V-A201 and the percentage opening of the upper and lower side vents. It should be noted that a frequency of 60 Hz indicates that the fan operates in full capacity and 30 Hz implies that the fan runs at half capacity. Thus, in Cases 1, 2, 4, and 5, fan VA-201 operates at full capacity and in the other two Cases, 3 and 6, the fan runs with 50% capacity. Three sizes of side vents were considered: 100% (fully-opened), 50% and 0% (closed).
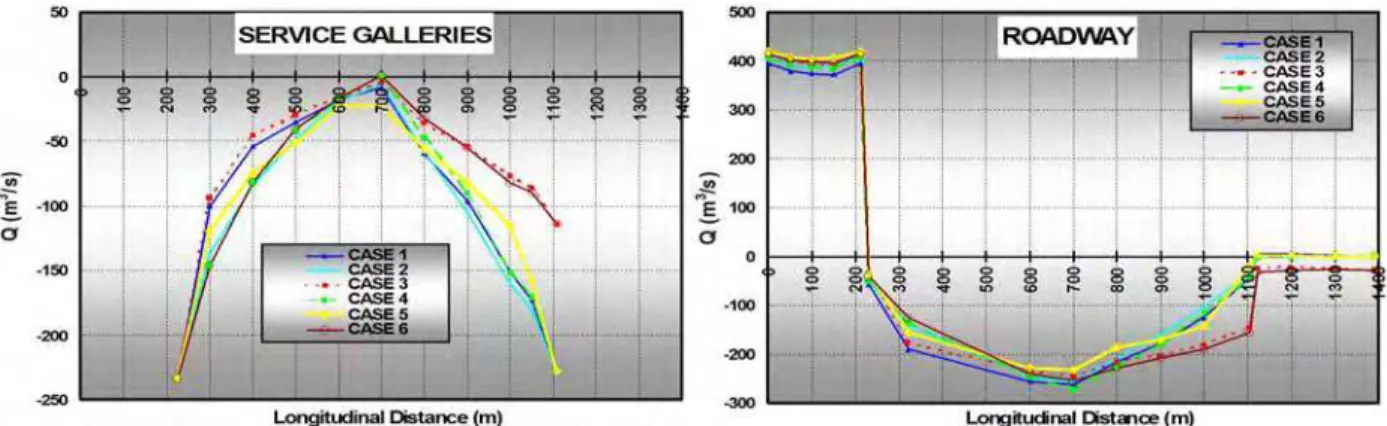
The bulk mass flow, temperature and visibility plots show the flow, temperature and visibility distribution across the tunnel length in the roadway as well as in the service galleries. The bulk values are calculated by averaging the values of an airflow parameter at each cross-section of the tunnel.
Figure 4 shows the bulk mass flow in the roadway and service galleries for the six simulated cases. Fresh air was supplied by fan VA-201 through the galleries and entered the tunnel roadway through the fully opened side vents. Smoke and hot gases were exhausted through ceiling fans VE-151 and VE-153 and through the side vents to the galleries of fan VA-103. Fresh air was also drawn through the North and South portals. With fan VA-201 operating with 50% capacity (Cases 3 and 6), the major impact on the flow distribution in the Roadway occurs at fans VE-251 and VE-253 (upstream of the fire) and less significant effects took place downstream of the fire.
Figure 2: CFD modeled domain Figure 3: Fire Tests
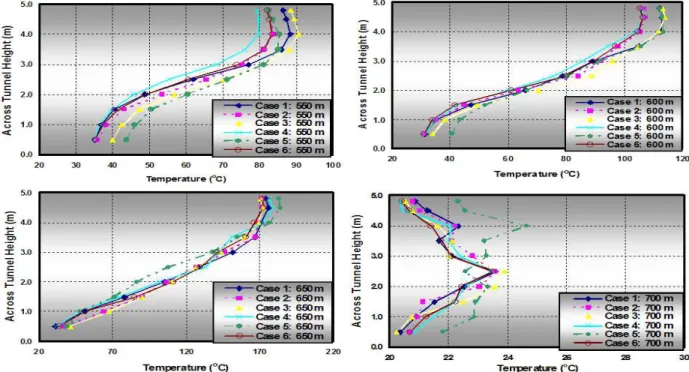
Figure 5 shows the centreline temperature profiles for the six cases at different locations across the tunnel. In general, Cases 4 and 6 resulted in the lowest predicted temperatures. These predictions are believed to be the result of the fact that the hot air is being removed faster through the upper row of side vents. However, Case 6 also offers more favourable evacuation conditions with lower air speed in the service galleries of fan VA-201[ ]6.
Figure 6 shows the bulk temperatures in the roadway and service galleries for the six cases with the Mid-Fire scenario. The maximum predicted temperatures at the fire location were 130, 120, 129, 150, 121, and 113oC, for the six cases respectively. Case 4 (with the lower vents closed) resulted in the highest predicted temperature. However, Cases 4 and 6 resulted in a relatively faster dissipation of high temperature due to the greater efficiency of the upper vents in extracting hot gases from the tunnel roadway.
The reduced supply capacity of fan VA-201, depicted in Case 6, resulted in more flow directed upstream of the fire towards the South portal. In doing so, the hot gases from the fire were diluted to nearly ambient environment resulting in reduced peak temperature and faster dissipation of the temperature downstream of the fire.
The above-mentioned conclusion was confirmed from Figure 8 and Figure 7, which show rapid extraction of soot (smoke) and hence a quick restoration of good visibility downstream of the fire for Cases 4 and 6. It is important to note that even though Case 4 has a favourable visibility condition, it may present a challenge for the movement of the evacuees by introducing a faster airflow in the service galleries of fan VA-201. The visibility is calculated assuming a value of 2 for the proportionality constant (reflected signs and building components in reflected light[ ]7).
Fan Operation Capacity Opening percentage (%) Case
VE-151 VE-153 VA-103 VA-201 Lower Upper
1 E: 60Hz E: 60Hz E: 60Hz S: 60Hz 100 100 2 E: 60Hz E: 60Hz E: 60Hz S: 60Hz 50 50 3 E: 60Hz E: 60Hz E: 60Hz S: 30Hz 100 100 4 E: 60Hz E: 60Hz E: 60Hz S: 60Hz 0 100 5 E: 60Hz E: 60Hz E: 60Hz S: 60Hz 100 0 6 E: 60Hz E: 60Hz E: 60Hz S: 30Hz 0 100 E: Exhaust S: Supply
Table 1: Description of Simulated Cases under Mid-Fire Scenario
Figure 5: Centreline temperature profiles (Mid-Fire)
Figure 6: Bulk temperatures (Mid-Fire)
2.3 Exhaust-Fire Scenario Simulated Cases
Four cases were investigated under this fire scenario. They are described in Table 2. The parameters examined were the capacity of fans VA-103 and V-A201 and the percentage opening of the upper and lower side vents. In all Cases, except for Case 1, both fans VA-103 and VA-201 operate with 50% capacity. Two sizes of side vents were considered: 100% (fully-opened) and 0% (fully-closed).
Figure 9 shows the bulk mass flow in the roadway and service galleries for the four cases. With fans VA-103 and VA-201 operating with 50% capacity (Cases 2, 3, and 4), the airflow speeds in the middle region of the tunnel are, in general, higher than those for Case 1 and in the direction of the traffic (South-North). This represents favourable conditions for smoke removal. Also, for the three Cases 2, 3, and 4 more fresh air is withdrawn at the North Portal which helps to trap the smoke close to exhaust fans VE-151 and VE-153.
Figure 10 shows the centreline temperature profiles for the four cases at different locations across the tunnel. In general, Case 4 (fans VA-103 and VA-201 operating with 50% capacity and upper side vents are closed) resulted in the lowest predicted temperatures. These predictions are believed to be the result of the fact that the fresh air is supplied at a lower height than the hot layer and thus causes no disturbance to the movement of the smoke and hot gases towards exhaust fans VE-151 and VE-153.
Figure 11 shows similar visibility conditions in the roadway for all cases. However, the four cases produced different visibility conditions in the service galleries of fan VA-103. Case 3 (with lower side vents closed) produced almost 30 m visibility throughout the service galleries. Cases 1 and 4 resulted in 25-27 m visibility. Case 2 created slightly lower visibility conditions that extended upstream of the fire.
Fan Operation Capacity Opening percentage (%) Case
VE-151 VE-153 VA-103 VA-201 Lower Upper 1 E: 60Hz E: 60Hz S: 60Hz S: 60Hz 100 100 2 E: 60Hz E: 60Hz S: 30Hz S: 30Hz 100 100 3 E: 60Hz E: 60Hz S: 30Hz S: 30Hz 0 100 4 E: 60Hz E: 60Hz S: 30Hz S: 30Hz 100 0 E: Exhaust S: Supply
Figure 8: Bulk soot volume fraction (Mid-Fire)
Figure 9: Bulk mass flow across the tunnel (Exhausted-Fire)
Figure 10: Centreline temperature profiles (Exhaust-Fire)
3 CONCLUSIONS
1. The results of the numerical analyses indicated that the phenomenon of “backlayering” did not occur in all simulated cases with the current dampers configuration. Therefore, the current ventilation scenarios and side vent openings are deemed appropriate with regards to preventing the occurrence of backlayering.
2. The numerical analyses revealed that lowering the capacity of fan VA in supply mode would, in addition to facilitating movement in the evacuation passage, improve the visibility downstream of the fire.
3. In general, it is recommended that while the VA fans operate in the exhaust mode to have the upper vents fully opened and the lower vents fully closed. This configuration would result in a more efficient extraction of smoke and hot gases from the tunnel.
4. On the other hand, it is favourable to have the upper side vents fully closed and the lower side vents fully opened while the VA fans operate in the supply mode. This configuration would result in a minimum disruption of the buoyant smoke and hot gases layers.
5. The air velocity in the evacuation passage was 14 m/s with VA-103 at maximum capacity. It might be difficult to walk against such a high airflow during an evacuation. Lower velocities (11 m/s) should be used to facilitate movement in the evacuation passage[ ]6.
6. While mentioned earlier the current procedures are deemed effective in controlling the smoke, in order to further improve the performance of these strategies the following recommendations may be considered:
a. The ideal situation would be to automate the side vent dampers in order to be able to change their configuration according to the fire location and the scenario used. In turn, this will provide the tunnel operator the maximum flexibility in dealing with different fire scenarios.
b. While it is suggested that the damper system be automated, this option could be expensive to implement and maintain operational in Canadian weather. An alternative option can be to optimize side vent configurations (opening/closure state) in accordance with the most critical scenarios used. In this
option, it is recommended that the upper vents of fans VA-101, VA-102, VA-104, VA-201, VA-203 and VA-204 be fully closed and the lower vents be fully opened. For fans VA-103 and VA-202, it is suggested that the upper vents be fully opened and the lower vents fully closed.
4 REFERENCES
1. K.B. McGrattan, H.R. Baum, R.G. Rehm, G.P. Forney, J.E. Floyd, and S. Hostikka., “Fire Dynamics Simulator (Version 2), Technical Reference Guide”, Technical Report NISTIR 6783, National Institute of Standards and Technology, Gaithersburg, Maryland, August 2001.
2. Kashef, A.; Bénichou, N.; Lougheed, G.D. Numerical Modelling of Movement and Behaviour of Smoke Produced from Fires in the Ville-Marie and L.-H.-La Fontaine Tunnels: Literature Review, Research Report, Institute for Research in Construction, National Research Council Canada, 141, pp. 66, Sep, 2003 (IRC-RR-141).
3. Kashef, A.; Bénichou, N.; Lougheed, G.D.; Debs, A. "CFD Simulation of in-situ Airflow Measurements in Road Tunnels," 5th International Conference Safety in Road and Rail Tunnels (Marseilles, France, 2003-10-06), pp. 609-618.
4. Kashef, A.; Bénichou, N.; Lougheed, G.D.; Debs, A. "Computational Fluid Dynamics Simulations of in-situ Fire Tests in Road Tunnels," 5th International Conference - Tunnels Fires (London, United Kingdom, October 25, 2004), pp. 185-196, October 2004 (NRCC-45174)
5. National Fire Protection Association, “NFPA 502 Standard for Road Tunnels, Bridges, and Other Limited Access Highways”, 2001 Edition, NFPA, Quincy, MA.
6. Cheung, Emil, Chan, Wilson, and Man, Richard, “Ventilation Scheme using Saccardo Nozzles”, Tunnel Management International, 5th International Conference, Safety in Road and Rail Tunnels, Volume 6, Number 1, 2003.
7. Klote, J., and Milke, J. 2002. “Principles of Smoke Management”. ASHRAE, Inc., 1791 Tullie Circle NE, Atlanta, GA 30329.