Publisher’s version / Version de l'éditeur:
Vous avez des questions? Nous pouvons vous aider. Pour communiquer directement avec un auteur, consultez la première page de la revue dans laquelle son article a été publié afin de trouver ses coordonnées. Si vous n’arrivez Questions? Contact the NRC Publications Archive team at
PublicationsArchive-ArchivesPublications@nrc-cnrc.gc.ca. If you wish to email the authors directly, please see the first page of the publication for their contact information.
https://publications-cnrc.canada.ca/fra/droits
L’accès à ce site Web et l’utilisation de son contenu sont assujettis aux conditions présentées dans le site LISEZ CES CONDITIONS ATTENTIVEMENT AVANT D’UTILISER CE SITE WEB.
Client Report (National Research Council of Canada. Construction), 2014-12
READ THESE TERMS AND CONDITIONS CAREFULLY BEFORE USING THIS WEBSITE.
https://nrc-publications.canada.ca/eng/copyright
NRC Publications Archive Record / Notice des Archives des publications du CNRC :
https://nrc-publications.canada.ca/eng/view/object/?id=afdf017b-9598-4ce9-9f39-21cb80dd29d2 https://publications-cnrc.canada.ca/fra/voir/objet/?id=afdf017b-9598-4ce9-9f39-21cb80dd29d2
NRC Publications Archive
Archives des publications du CNRC
For the publisher’s version, please access the DOI link below./ Pour consulter la version de l’éditeur, utilisez le lien DOI ci-dessous.
https://doi.org/10.4224/21274581
Access and use of this website and the material on it are subject to the Terms and Conditions set forth at
Mid-rise wood constructions: investigation of water penetration
through cladding and deficiencies: report to Research Consortium for
Wood and Wood-Hybrid Mid-Rise Buildings
NATIONAL RESEARCH COUNCIL CANADA
REPORT TO RESEARCH CONSORTIUM
FOR WOOD AND WOOD-HYBRID
MID-RISE BUILDINGS
Mid-Rise Wood Constructions –
Investigation of Water Penetration
through Cladding and Deficiencies
CLIENT REPORT: A1-100035-03.3
REPORT TO RESEARCH CONSORTIUM FOR WOOD
AND WOOD-HYBRID MID-RISE BUILDINGS
Mid-Rise Wood Constructions – Investigation of Water
Penetration through Cladding and Deficiencies
H.H. Saber, M.A. Lacasse, T.V. Moore, and M. Nicholls
Report No.
A1-100035-03.3
Report date: December 31, 2014
Contract No. B-7000 (A1-100035)
Prepared for Canadian Wood Council
FPInnovations
Régie du bâtiment du Québec
HER MAJESTY THE QUEEN IN RIGHT OF ONTARIO as
represented by the Minister of Municipal Affairs and Housing
23 p
ages
This report may not be reproduced in whole or in part without the written consent of both the client and the National Research Council of Canada.
Table of Contents
Table of Contents...i
List of Figures... ii
List of Tables... iii
Acknowledgements... iv
1 Introduction...1
2 Objectives...1
3 Approach... 2
3.1 Overview... 2
3.2 Water entry test apparatus... 3
3.2.1 Pressure Actuator...3
3.2.2 Mid-scale test apparatus... 3
3.3 Fabrication of test specimens... 4
3.4 Test method... 6
3.4.1 Water entry testing...6
3.4.2 Instrumentation... 7
4 Test results...7
4.1 Overview of test results... 7
4.2 Water entry test results for Specimen 1... 7
4.2.1 Test 1 of Specimen 1...7
4.2.2 Test 2 of Specimen 1...9
5 Discussion of results... 10
6 Water Entry Correlations for Hygrothermal Simulations... 13
6.1 Correlations for water entry through deficiencies...13
6.2 Correlations for water entry through NBC stucco...17
7 Summary... 20
8 References... 21
List of Figures
Figure 1: Pressure Actuator ...3
Figure 2: Mid-scale DWTF was used together with the actuator to simultaneously subject specimens to identical simulated wind driven rain conditions ...4
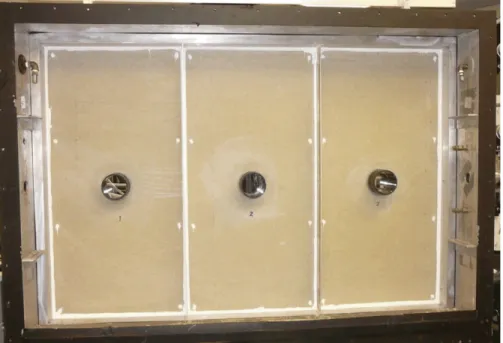
Figure 3: Test Specimen Frame containing three 0.61 m X 1.22 m (2ft wide by 4ft long) identically constructed fibre cement cladding panels. Located in center of panel is a 114m (4.5-in.) diameter ventilation duct. Numbered from left to right: Spec. 1, Spec. 2, and Spec. 3...5
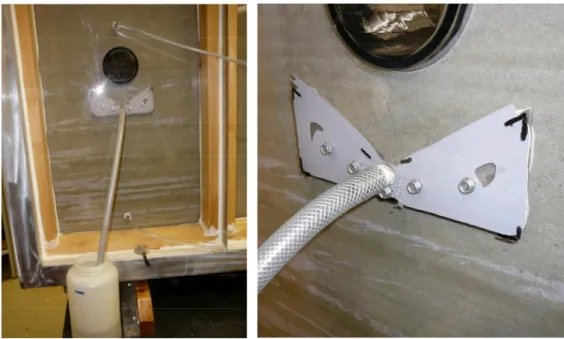
Figure 4: Three 2.5 mm diameter deficiencies. These deficiencies were created in the plasticine that is acting as a sealant in the 6mm (0.25 in) gap between the pipe and fibre cement cladding ...5
Figure 5: Water collection tray and collection vessel. Water collection tray located in 10 mm gap between fibre cement cladding and clear sheathing panel. Water entry collected in tray drained to collection vessel and thereafter weight of vessel was measured on a weigh scale ...6
Figure 6: Water entry results for deficiencies in a fibre cement cladding: Specimen 1; Test 1. Circled in red are peak values that occurred at 700 Pa. ...8
Figure 7: Water Entry Rate test results for Specimen 1; Test 2 ...10
Figure 8: A visual comparison between an absorptive stucco cladding on left and a non-absorptive fibre cement cladding on right. There is a distinct wetting pattern that is readily observed of stucco cladding whereas this effect is not as apparent for fibre cement cladding suggesting that the absorptivity of fibre cement cladding is comparatively less significant...11
Figure 9: Water droplet, rivulet and film formation due to water deposition on fibre cement cladding ...12
Figure 10: Hygrothermal modeling of building envelopes ...13
Figure 11: Representation of the location of ventilation pipes along a 7.3 m section of wall for a small dwelling unit of a mid-rise building ...14
Figure 12: Water Entry Percentage normalized to 2.44 m by 2.44 m (8 ft by 8 ft) wall...14
Figure 13: Comparison between measured water entry rate and that calculated in Eq. (1) ...16
Figure 14: Comparison between measured water entry rate and that calculated in Eq. (2) ...17
Figure 15: NBC stucco cladding test specimen showing nominal size and extent of cracks on cladding surface [3] ...18
Figure 16: Measurement of water entry rate behind NBC stucco [3]...18
Figure 17: Measurement of the percentage of water entry rate behind NBC stucco [3] ...19
Figure 18: Comparison between the measured percentage of water entry rate behind the NBC stucco cladding and that calculated in Eqs. (3) and (4) ...20
List of Tables
Table 1: Test protocol to assess water entry performance of fibre cement cladding...6 Table 2: Water entry rate (mL/min) at different spray rates (L/min-m2) for
Specimen 1: Test 1 ... ...8 Table 3: Water entry rates (mL/min) at different spray rates (L/min-m2) for
Specimen 1: Test 2 ... ...10 Table 4: Water Entry Percentage normalized to 2.44 m by 2.44 m (8 ft by 8 ft) wall...14 Table 5: Coefficients of correlation given by Eq. (1) for low and high wind pressure ...15
Acknowledgements
The authors would like to thank Mr. Steve Cornick for his expertise and advice in development of the test protocol.
MID-RISE WOOD CONSTRUCTIONS – INVESTIGATION OF WATER PENETRATION THROUGH CLADDING AND DEFICIENCIES
H. H. Saber, M. A. Lacasse, T. V. Moore, and M. Nicholls
1 Introduction
One of the key parameters required as input to the numerical simulations is the percentage of water entry behind the cladding systems and through deficiencies as a function of wind pressure and Wind Driven Rain (WDR). In cases that lack information about the percentage of the water entry, ASHRAE recommends a value equal to 1% of the WDR [1]. There is little published work related to justifying the value of 1% of WDR in respect to water entry of wall assemblies although Van den Bossche [2] has provided a concise review as relates to masonry walls. As such, in an effort to investigate extending the applicability of the current National Building Code (NBC) requirements in respect to low-rise wood frame structures to structures comprising mid-rise wood construction, the Heat and Moisture Performance of Envelope group of NRC-Construction was tasked by the Mid-Rise Wood Buildings consortium to investigate the moisture management and water penetration performance of cladding systems and related deficiencies relevant to mid-rise buildings.
To evaluate the moisture management performance of mid-rise buildings, one needs to account for water entry in two ways. In the first instance, if an absorptive cladding is used water can penetrate the cladding due to pressure difference alone and secondly, if a deficiency occurs in the cladding, water penetration can also occur. In this report, correlations of water entry through the cladding system have been developed for: (1) water entry rates around deficiencies based on tests conducted in this study, and (2) water entry rates through absorptive claddings based on previous test results [3] of a stucco clad wall specimen built to NBC requirements. In both cases, the correlations have been extended to cover wind pressures that could occur in mid-rise and taller buildings in some of Canada’s windiest locations.
In respect to the previous study [3] in which the water entry rates for NBC compliant stucco clad wall specimen were assessed, this work permitted developing practical correlations to determine the percentage of water entry rate per unit wall area due to WDR and pressure differentials. However, these correlations were only applicable to low-rise residential buildings where the wind pressure is < 150 Pa [3]. For mid-rise construction and taller buildings, however, the wind pressure can attain levels greater than 150 Pa. Therefore, there is a need to develop additional correlations that relate the percentage of water entry rate due to WDR that are applicable to situations where higher wind pressure loads exist. In this project, such results will be combined with those derived from water entry tests through deficiencies in a cladding system suitable for mid-rise buildings and subsequently used to assess the hygrothermal performance of mid-rise buildings under worse case water entry conditions.
2 Objectives
The objectives of this work include the following:
Conduct a series of water entry tests over a wide range of simulated wind pressure and WDR loads to measure the water entry rate passing the cladding through deficiencies located in a fibre cement cladding system;
Use the test results to develop correlations for determining the percentage of water entry rate through deficiencies as a function of pressure difference across the assembly and water spray rate onto the cladding surface;
Analyze the water entry data for the NBC stucco cladding for high wind pressures obtained in a previous study (see [3] for more details) and applicable for mid-rise and taller buildings and thereafter develop a correlation to determine the percentage of water entry rate as a function of wind pressure and WDR for absorptive claddings.
3 Approach
The water entry owing to deficiencies at penetrations in cladding systems (e.g. at the periphery of ventilation ducts and pipes) was evaluated in this study. The amount of water entry depends on a number of parameters such as the amount of WDR and the wind pressure acting on the wall, the nature of the surface and texture of the cladding material, the absorptivity of the cladding and other factors that affect the presence of and quantity of water at deficiencies. However, based on results derived from previous studies [3] in which water entry tests focused on deficiencies in a stucco cladding, it was determined that in this study, a less absorptive cladding would be used as this might provide more accurate results when measuring the water entry rate through deficiencies in the cladding. As such, the amount of water leakage through deficiencies is not likely to be absorbed by the cladding material as it migrates through the cladding, such as was observed for stucco [3], thereby allowing a more accurate characterization of water entry rates. Hence in this study, a fibre cement-based cladding was used to characterize water entry through deficiencies due to its low degree of water absorption. Fibre cement cladding was also featured in wall specimens investigated by the Fire Team.
3.1 Overview
The water entry evaluation of fibre cement cladding was conducted using the Mid-scale Dynamic Wall Test Facility (DWTF), a description of which is given in section 3.2. The mid-scale DWTF accommodates samples of up to 1.22 m by 1.83 m (4ft x 6ft) in size. The test set consisted of three 1.22 m by 0.61 m (4ft x 2ft) test specimens mounted into a single aluminum test frame having dimensions of 1.22 m by 1.83 m (4ft x 6ft).
Each specimen was tested for water entry in which was incorporated a deficiency consisting of three 2.5 mm diameter holes located directly above a ventilation pipe, which in this case consisted of a 114 mm (4.5 in) diameter PVC pipe. The three 2.5 mm diameter holes where intended to be representative of a sealant failure of the sealed gap located between the ventilation pipe and cladding. The full description of the test set up is provided in the section entitled “Water entry test apparatus”.
The test protocol consisted of subjecting each specimen to three water deposition rates for which water was sprayed directly above the deficiencies. To cover the range of driving rain wind pressures as might occur in different climatic regions of Canada, each water deposition rate was tested across several pressure steps that ranged between 0 Pa to 1150 Pa; this test range was determined by Cornick [4] on the basis of a review of driving rain wind pressures and rain fall data for selected Canadian locations. Based on an 1150 Pa peak test pressure, the water entry test conditions were representative of conditions at all Canadian locations excluding the Northeastern tip of Newfoundland (St. Anthony’s) and the Western side of the Queen Charlotte Islands. For each pressure step a water entry test was conducted at each of the three water deposition rates for a 10 min period. A more in-depth description of the test protocol follows in the section entitled “Test method”.
3.2 Water entry test apparatus
The mid-scale DWTF apparatus consists of two primary components: the pressure actuator and the mid-scale test apparatus; each is described in turn.
3.2.1 Pressure Actuator
The pressure actuator shown in Figure 1 was used with the mid-scale test frame to perform a water entry evaluation of deficiencies located above a sealed ventilation duct placed in a fibre cement cladding. The pressure actuator can provide either static or dynamic pressure conditions to the mid-scale test chamber. The combination of these two systems can produce driving pressures up to 1250 Pa, and dynamic pressure frequencies of up to 2 Hz.
Figure 1: Pressure Actuator
3.2.2 Mid-scale test apparatus
As shown in Figure 2, the mid-scale DWTF test apparatus is made up of a test chamber and specimen holder. The test chamber houses the water spray nozzles, and when properly mounted and sealed to the test frame, permits subjecting test specimens to pressure differentials of up to 1150 Pa. The pressure actuator is connected to the chamber by a flexible plastic reinforced pipe and thus can impart dynamic pressure loads to the chamber and across the test specimens. Water deposition to the specimens was provided by a total of nine water spray nozzles, three nozzles for each specimen and each set located 4-in. from the surface of the test specimen. The nozzles were oriented so that the water would be sprayed onto the cladding just above the ventilation pipe (~ 4.5 in.) and thereafter cascade down over the deficiencies.
Figure 2: Mid-scale DWTF was used together with the actuator to simultaneously subject specimens to identical simulated wind driven rain conditions
The specimen holder is a 1.22 m x 1.83 m (4ft x 6ft) aluminum frame which attaches to the mid-scale test chamber. Three identical specimens were built into this test frame, each measuring 1.22 m x 0.61 m (4ft x 2ft).
3.3 Fabrication of test specimens
The specimens were 0.61 m high by 1.22 m wide (2 ft by 4ft ), and contained a 114 mm (4.5 in) diameter ventilation pipe located in the centre of the cladding; the pipe was affixed to an acrylic panel that acted as a sheathing board as shown in Figure 3.
The ventilation pipe was incorporated into the wall specimens by cutting a 120 mm (4.75 in) hole in the centre of the fibre cement panels. This left a 6 mm (0.25 in) gap around the ventilation pipe the periphery of which was sealed using plasticine. The use of plasticine allowed for the incorporation of three deficiencies above the ventilation pipe, each a 2.5 mm diameter hole. The three deficiencies simulated a potential sealant failure in the gap between the ventilation pipe and cladding as shown in Figure 4.
To incorporate a water collection trough behind the cladding, the fibre cement cladding was mounted to two 10 mm furring strips themselves affixed to a transparent acrylic sheathing. The use of transparent acrylic sheathing enabled seeing in behind the cladding to note any discrepancies in water collection results (such as water entry due to sources other than those due to the deficiencies).
Figure 3: Test Specimen Frame containing three 0.61 m X 1.22 m (2ft wide by 4ft long) identically constructed fibre cement cladding panels. Located in centre of panel is a 114 mm (4.5-in.)
diameter ventilation duct. Numbered from left to right: Spec. 1, Spec. 2, and Spec. 3
Figure 4: Three 2.5 mm diameter deficiencies. These deficiencies were created in the plasticine that is acting as a sealant in the 6mm (0.25 in) gap between the pipe and fibre cement cladding
The water collection trough for each specimen was placed in the 10 mm cavity space directly below the ventilation pipe. Water collected in the trough drained by gravity to a collection vessel, where the weight of water in the vessel was recorded. The collection tray and collection vessel are shown in Figure 5.
Figure 5: Water collection tray and collection vessel. Water collection tray located in 10 mm gap between fibre cement cladding and clear sheathing panel. Water entry collected in tray drained to
collection vessel and thereafter weight of vessel was measured on a weigh scale
3.4 Test method
3.4.1 Water entry testing
The water entry test protocol consisted of subjecting three identically constructed fibre cement panels to three water deposition rates (Table 1) over a set of selected applied differential pressures ranging from 0 Pa to 1150 Pa; the 8 selected pressure steps are also given Table 1. This pressure range covers different building applications, including mid-rise and taller buildings, for most Canadian locations. Each test was conducted for a period of 10 minutes at each pressure step and the test protocol was conducted twice. The test protocol details used in this evaluation are given in Table 1.
Table 1: Test protocol to assess water entry performance of fibre cement cladding
Pre-test Wetting 500 Pa applied pressure, 1.74 L/min-m2deposition rate, for 20 min
Deposition Rate 0.58 L/min-m2, 1.16 L/min-m2, 1.74 L/min-m2
Applied
Pressures 0 Pa, 50 Pa, 75 Pa, 150 Pa, 300 Pa, 500 Pa, 700 Pa, 1150 Pa
Test Duration 10 min
To help ensure steady-state water collection conditions, a wetting sequence was first conducted prior to initiating each test series that commenced at the beginning of a test day. As provided in Table 1, the wetting sequence consisted of subjecting the specimens to a 500 Pa applied pressure at a water deposition rate of 1.74 L/min-m2 for a period of 20 minutes. This ensured that all parts of the water collection system were sufficiently wetted so that time
between water entry through the deficiency and collection in the collection vessel was consistent across all tests.
3.4.2 Instrumentation
For evaluations undertaken on the mid-scale DWTF, it was important to measure the pressure difference across the sample, the water deposition rate applied to the sample and the water entry through the deficiency in the seal around the ventilation pipe. Pressures were monitored using a set of pressure sensors (Omega Model PX2670-5BD10V; ± 5-in. H2O) and water deposition rates were determined gravimetrically. The deposition rate was calculated based on the water spray rate of the individual nozzle and the sample spray area (200 mm by 250 mm). The flow rate was determined by weighing the quantity of water spray collected over three minutes and from this determining the average volumetric spray rate in (L/min). These weight measurements were conducted using a digital balance (Sartorius, model: BP3100S; range: 0 g-3100 g; precision: 0.01 g).
4 Test results
4.1 Overview of test results
In order to account for the variability incurred in water penetration testing, the test protocol was conducted twice. This led to six water entry results per pressure step and deposition rate (two test protocols and three samples). The resulting water entry was individually plotted for each specimen. The trends presented in these plots, combined with visual observations, were used to determine the validity of water entry results.
As such, results for both Specimen 2 and Specimen 3 were not considered valid and thus were not included as a basis of developing correlations useful for input to the hygrothermal model. In the case of Specimen 2, the results were not considered valid because of a malfunction in one of the water spray nozzles. Whereas in the case of Specimen 3, the results were discounted due to a failure in the seal between the collection trough and the backside of the fibre cement cladding. This failure prevented the proper collection of water to the tray and thus results from this specimen were not considered reliable; results for Specimen 2 are provided in the appendix.
The results for Specimen 1 were consistent across all three deposition rates and are given in the subsequent section.
4.2 Water entry test results for Specimen 1
The results for Test 1 are presented in Figure 6 and Table 2, and those for Test 2 in Figure 7 and Table 3.
4.2.1 Test 1 of Specimen 1
The results for Test 1 of Specimen 1 show that in general, for a given deposition rate, increasing applied pressure results in increasing water entry rate. Likewise, for a given applied pressure, an increase in water deposition rate results in an increased water entry rate.
The results given in Table 2 also show that at 0 Pa differential pressure the water entry rate was 0.31, 0.36 and 0.56 mL/min for spray rates of 0.58, 1.16 and 1.74 L/min-m2, respectively. From these results it is apparent that there is water entry occurring at no applied pressure (i.e. P = 0 Pa). This means that water entry may take place with no positive pressure as a driving force.
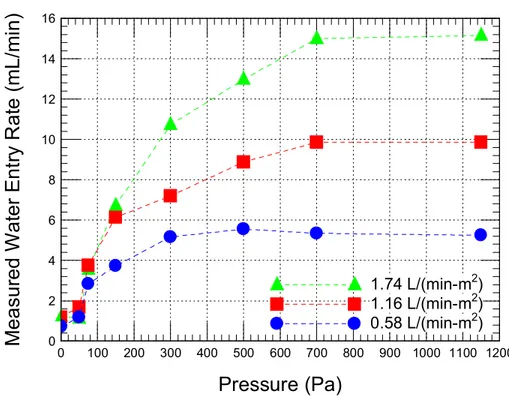
Figure 6: Water entry results for deficiencies in a fibre cement cladding: Specimen 1; Test 1. Circled in red are peak values that occurred at 700 Pa.
Table 2: Water entry rate (mL/min) at different spray rates (L/min-m2) for
Specimen 1: Test 1 Applied Pressure (Pa) Spray rate 0.58 L/min-m2 Spray rate 1.16 L/min-m2 Spray rate 1.74 L/min-m2 0 0.31 0.36 0.56 50 1.06 0.36 0.79 75 1.17 0.84 1.28 150 3.26 4.55 5.32 300 4.24 6.11 7.29 500 5.99 8.07 10.33 700 6.29 11.63 16.36 1150 5.85 9.99 15.45
The reason for this occurrence might be explained by the nature of water entry through a deficiency. At different spray rates, a continuous liquid film of water, water droplets and water rivulets, as well as dry patches, can be formed on the surfaces of the test specimens even at no applied pressure (see references [5, 6 and 7] for more details). Water entry requires the presence of an opening or deficiency through which water can pass, that water is present at the
0 2 4 6 8 10 12 14 16 18 0 100 200 300 400 500 600 700 800 900 1000 1100 1200
1.74 L/(min-m
2)
1.16 L/(min-m
2)
0.58 L/(min-m
2)
Pressure (Pa)
M
ea
su
re
d
W
at
er
E
nt
ry
R
at
e
(m
L/
m
in
)
deficiency, and a force to drive that water through the deficiency (e.g. gravity, air pressure). When no air pressure differential is evident (i.e. 0 Pa) the potential driving force for water entry is primarily due to gravity. However, capillary action may draw water into openings and eventually water may traverse the opening.
An anomaly in this test set, identified in Figure 6, is a data point occurring at 700 Pa applied pressure and circled in red. It shows a peak value for water entry rate for the entire test occurring at 700 Pa and a decrease in the rate of water entry for 1150 Pa. Water entry rates obtained at the 1150 Pa test level, as compared to those at 700 Pa, resulted in a drop in water entry rates of 7%, 14%, and 6% for deposition rates, respectively, of 0.58 L/min-m2, 1.16 L/min-m2, and 1.74 L/min-m2. The decrease in water entry rate from 700 Pa to 1150 Pa is likely due to the water deposition method used in this evaluation; additional information regarding this anomaly is provided in the subsequent section on the discussion of results.
4.2.2 Test 2 of Specimen 1
The water entry test results for Test 2 of Specimen 1 are presented in Figure 7 and Table 3. The results for Test 2 (Figure 7) conform to the same trends as that observed for Test 1 of Specimen 1 (Figure 6), specifically that, in general, increased pressure applied at each deposition rate results in an increased rate of water entry, and that increasing the water deposition rate onto the specimens at each applied pressure level likewise results in an increased water entry rate. One exception to this was the test undertaken at a water deposition rate of 0.58 L/min-m2in which where the water entry rate reaches a peak value at the 500 Pa pressure level. Further investigation of this shows that a water entry rate of 5.56 mL/min was achieved at 500 Pa as compared to 5.99 mL/min at the same water deposition rate in Test 1. This result is simply due to variability in the results and likely reflects this as a peak value for water entry.
A comparison of tests results between that obtained in Test 2 to that of Test 1 indicates that up to the 300 Pa level, all results for water entry achieved in Test 1 were less than that obtained in Test 2 irrespective of the water deposition rate. Whereas at higher pressure levels of 700 and 1150 Pa, the reverse was true, and results of Test 2 were less than that obtained in Test 1. The changeover of results from occurred at the 500 Pa pressure level where, at the lowest water deposition rate (0.58 L/min-m2), the water entry rate was 7% less in Test 2 as compared to that obtained in Test 1, whereas it was 10 and 26% greater at respective water deposition rates of 1.16 and 1.74 L/min-m2at this same pressure level.
Figure 7: Water Entry Rate test results for Specimen 1; Test 2 Table 3: Water entry rates (mL/min) at different spray rates (L/min-m2) for
Specimen 1; Test 2 Applied Pressure (Pa) Spray rate 0.58 L/min-m2 Spray rate 1.16 L/min-m2 Spray rate 1.74 L/min-m2 0 0.73 1.19 1.23 50 1.17 1.68 1.12 75 2.83 3.76 3.56 150 3.73 6.14 6.72 300 5.16 7.19 10.73 500 5.56 8.88 12.98 700 5.34 9.86 15.00 1150 5.25 9.86 15.15
5 Discussion of results
Variability of water entry results
The variability of water entry results obtained from test Specimen 1 are related in part to the manner in which water migrates to the deficiency from the moment it is deposited to the test specimen surface. 0 2 4 6 8 10 12 14 16 0 100 200 300 400 500 600 700 800 900 1000 1100 1200 1.74 L/(min-m2) 1.16 L/(min-m2) 0.58 L/(min-m2)
Pressure (Pa)
M
ea
su
re
d
W
at
er
E
nt
ry
R
at
e
(m
L/
m
in
)
In section “Specimen Construction” the water deposition to the surface of the specimen was described as being deposited directly above the deficiency onto the cladding surface and thereafter cascades downwards over the cladding surface to the deficiency. When water cascades down a surface it can: (1) Be absorbed by the surface (2) Remain separated in droplets, (3) Form a rivulet by the coalescence of droplets, or (4) Form a thin film that flows over the surface.
Whether water deposited onto the cladding surface thereafter forms a film, rivulets or individual droplets is largely dependent on the interaction between water and the cladding surface and the rate of water deposited to the surface. The interaction between water and the cladding surface relates to the absorption capacity of the cladding material and the degree to which the water can easily spread over the surface to either form a film or droplets. The formation of a water film or droplets relates to the contact angle of a water droplet to the cladding surface that in turn is dependent on the cladding surface roughness.
The degree of absorptivity of fibre cement cladding as compared to a stucco cladding is illustrated in Figure 7. The fibre cement cladding has a lower degree of absorptivity as compared to stucco as is shown in Figure 7, in which a stucco cladding has been subjected to similar test conditions as that of a fibre cement cladding. The stucco cladding more readily absorbs water as is evident from the distinct wetting pattern evident on its surface as compared to that of the fibre-cement cladding.
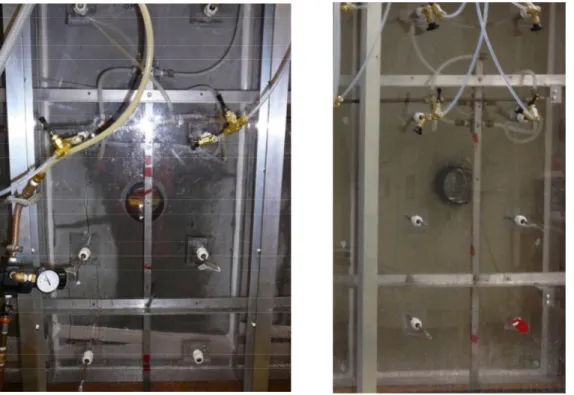
Figure 8: A visual comparison between an absorptive stucco cladding on left and a non-absorptive fibre cement cladding on right. There is a distinct wetting pattern that is readily observed of stucco cladding whereas this effect is not as apparent for fibre cement cladding
suggesting that the absorptivity of fibre cement cladding is comparatively less significant The surface roughness can affect the transition from droplet to rivulet formation or to the formation of a continuous film of water. For a rivulet or continuous film to form several droplets need to coalesce. The smooth surface of fibre cement lends itself to the formation of rivulets and films of water provided there is a sufficient amount of water deposition to the surface. This
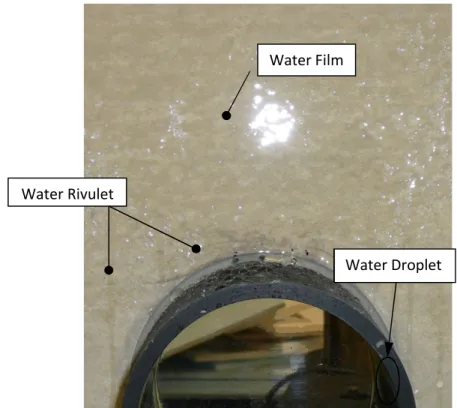
test. In this figure one can see that droplets, rivulets and films have formed on the cladding surface.
Figure 9: Water droplet, rivulet and film formation due to water deposition on fibre cement cladding
Both water film and rivulet formation occurred on the smooth surface of this cladding at the deposition rates applied. In the case where rivulets form as water cascades down the cladding surface, the rivulet may or may not encounter the deficiency. Given that for water entry to occur water must be present at the deficiency, there is therefore in this test method the possibility for two extremes conditions to occur when water migrated downwards over the cladding surface in the form of rivulets; specifically the water rivulet:
(1) Does not encounter the deficiency, resulting in a diminished water entry rate (in this case, water entry is due only to water droplets attaining the deficiencies);
(2) Directly interacts with a deficiency causing a heightened rate of water entry.
During a water entry test one would expect that direct interaction of a water rivulet or film would occur intermittently, as would the other extreme, and as such, rates of entry could vary considerably from test to test.
Water Rivulet
Water Film
6 Water Entry Correlations for Hygrothermal Simulations
6.1 Correlations for water entry through deficiencies
Water entry rates through the cladding systems and deficiencies as functions of a wide range of wind pressure and Wind Driven Rain (WDR) loads are important parameters in determining the hygrothermal performance of building envelopes (see Figure 10). In order to apply the water entry results to the hygrothermal simulations, as provided in the previous section, the results must be normalized to an appropriate value. In this case the water entry results were normalized to a standard 2.44 m x 2.44 m (8 ft x 8 ft) wall system. Due to the nature of the type of deficiency through which water penetrated (three 2.5 mm diameter holes located above a ventilation pipe), further consideration was required to estimate the number of ventilation pipes, or other penetrations, that might be encountered in an 8 ft x 8 ft wall section.
Figure 10: Hygrothermal modeling of building envelopes
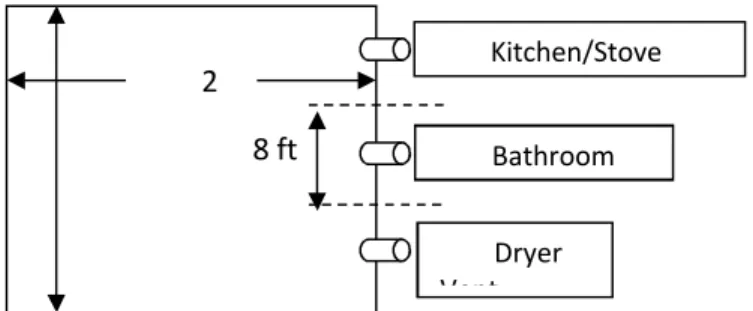
Considering a potential worst case scenario, the following situation was proposed focusing on the expected number of pipes that might penetrate the walls of a small dwelling unit (e.g. bachelor apartment) of a mid-rise building. If it is supposed that the dwelling unit has dimensions of 7.3 m by 7.3 m, or approximately 54 m2in size (24 ft x 24 ft), and has only one exterior wall in which are located three ventilation pipes (e.g. ventilation for kitchen stove, bathroom and dryer), then this provides for three ventilation pipes along a 7.3 m (24 ft) wall. Assuming the ventilation pipes are equally distributed along the wall, this suggests that there is a ventilation pipe every 2.4 m (8 ft); such a scenario is depicted in Figure 11.
Using the previous designation of one vent per 2.44 m x 2.44 m (8 ft x 8 ft) of wall section allows the water entry rate results to be converted to a percentage water entry between the water passing the cladding and the total amount deposited onto the cladding in relation to the applied pressure differential across the wall and normalized to a 2.44 m by 2.44 m (8 ft by 8 ft) section of wall; the results derived from Test 2 of Specimen 1 are presented in Figure 12 and Table 4.
Input
Climate Loads
Material Properties
Wall Configurations
Start
Output
*Water Entry through
NBC Stucco Cladding
and Deficiencies (e.g.
Ducts)
Analyzing Results Using
MEWS Approach
Numerical
Simulation
Figure 11: Representation of the location of ventilation pipes along a 7.3 m section of wall for a small dwelling unit of a mid-rise building
Figure 12: Water Entry Percentage normalized to 2.44 m by 2.44 m (8 ft by 8 ft) wall Table 4: Water Entry Percentage normalized to 2.44 m by 2.44 m (8 ft by 8 ft) wall
Pressure Applied (Pa)
Spry rate
0.58 L/min-m2 1.16 L/min-mSpry rate 2 1.74 L/min-mSpry rate 2
0 0.02% 0.02% 0.01% 50 0.03% 0.02% 0.01% 75 0.08% 0.05% 0.03% 150 0.11% 0.09% 0.06% 300 0.15% 0.10% 0.10% 500 0.16% 0.13% 0.13% 700 0.15% 0.14% 0.14% 1150 0.15% 0.14% 0.15% 0 0.02 0.04 0.06 0.08 0.10 0.12 0.14 0.16 0.18 0 100 200 300 400 500 600 700 800 900 1000 1100 1200 1.74 L/(min-m2) 1.16 L/(min-m2) 0.58 L/(min-m2)
Pressure (Pa)
P
e
rc
en
ta
g
e
of
W
at
e
r
E
nt
ry
R
at
e
(%
)
Fibre Cement Water Entry Test Results - Specimen 1: Test 2
8 ft 2 4 ft Kitchen/Stove Bathroom Dryer Vent
In general the trends in the data hold true to other water entry rate tests in that the increased deposition rate leads to a decrease in percentage of water entry. This is the case for most pressures tested, however at the 1150 Pa pressure level, the percentage rate of water entry at a water deposition rate of 1.16 L/min-m2was less than that at 1.74 L/min-m2. This might be due to the uncertainties in the measurements. In fact in the 1.16 L/min-m2 case the water entry percentage (0.14%) has reached its maximum value at 700 Pa, and increasing to 1150 Pa results in the exact same water entry percentage, where the 1.74 L/min-m2has not yet reached a threshold and increases in water entry percentage from 700 Pa to 1150 Pa.
The results obtained at a water deposition rate of 0.58 L/min-m2 also reach a plateau at 500 Pa and further increases in pressure do not result in an increase in percentage of water entry. This might be due to the uncertainties introduced in the test by the cascading water and whether or not a water rivulet will encounter the deficiency as was previously discussed.
The measurements of water entry rates through deficiencies at different water deposition rates (see Figure 13 and Figure 14) were used to develop a correlation that covers a wide range of wind pressures and wind driven rain loads; the data to develop the correlation were those given in Figure 12. This correlation is given as:
b
P
c
WDR
a
b i i i
2 1 3 3
(1) Where: = Water entry through deficiencies (mL/min),
WDR = Wind driven rain (L/min-m2), and
P = Wind pressure (Pa).
The coefficients in the correlation given by Eq. (1) are given in Table 5 for wind pressures of P 150 and P ≥ 150 Pa; the coefficients were determined using a multiple regression analysis.
Table 5: Coefficients of correlation given by Eq. (1) for low and high wind pressure
Coefficients P ≤ 150 Pa P ≥ 150 Pa a1 5.66376E-01 9.35336E-01 a2 6.38328E-02 3.90900E-01 a3 -1.31473E-01 -2.19004E-01 b1 2.82601E-01 5.71688E-01 b2 7.21125E-01 3.75283E-01 c 9.56514E-01 1.09301E+00
It can be seen in Figure 13 that most of the measured rates of water entry are in good agreement with the values calculated using Eq. (1); that is, the calculated values are within ±10% of those obtained from tests. In the case where an estimate is needed of the percentage of water entry rate for a 2.44 m x 2.44 m (8 ft x 8 ft) wall section having one vent per section, the percentage of water entry rate ( in %) can be given as:
1.68186102
/WDR
(2)
The value of WDR in the above equation must be in (L/min-m2). A comparison between the measured percentage of water entry rate and that calculated using Eq. (2) are shown in Figure 14. As shown in this figure both measured and calculated percentages of water entry rate are in reasonable agreement. The correlations given in Eq. (1) and (2) will be used in the hygrothermal simulations (see Figure 10) to determine water entry rates through deficiencies as a function of the wind pressure and wind driven rain loads as might occur in the different climatic regions of Canada.
Figure 13: Comparison between measured water entry rate and that calculated in Eq. (1)
0 5 10 15 20 0 5 10 15 20 P150 Pa P150 Pa -10% +10%
Measured Water Entry Rate (mL/min)
C
al
cu
la
te
d
W
a
te
r
E
nt
ry
R
at
e
(m
L/
m
in
)
Figure 14: Comparison between measured water entry rate and that calculated in Eq. (2)
6.2 Correlations for water entry through NBC stucco
Porous cladding systems subjected to wind driven rain may absorb water and permit water entry passing the cladding through cracks and other openings in the cladding itself, such as deficiencies that may occur adjacent to penetrations, e.g., vent ducts and pipes. The water entry rates through deficiencies were addressed in the previous section. As indicated earlier, water entry tests were conducted in a previous project [3] on a number of full-scale cladding systems including NBC stucco (see Figure 15). In that project, correlations to determine the percentage of water entry behind the cladding systems were developed and used to assess the hygrothermal performance of residential buildings. Given that these correlations were applicable to residential buildings they were therefore only developed for wind pressures of up to 160 Pa. For mid-rise construction and taller buildings, wind pressures can attain values greater than 160 Pa. As such, all water entry results behind the NBC stucco system [3] were reanalyzed to develop a correlation for water entry that is applicable for a broader range of wind pressures. Figure 15 shows the NBC stucco cladding system that was tested in a previous study. Figure 16 and Figure 17 show the results of the water entry testing, specifically the water entry rate and the percentage of water entry rate behind the NBC stucco system. More details about these results are available in reference [3].
0 0.05 0.10 0.15 0.20 0 0.05 0.10 0.15 0.20 P150 Pa P150 Pa +10% -10%
Measured Water Entry Rate (%)
C
al
cu
la
te
d
W
at
er
E
nt
ry
R
a
te
(%
)
Figure 15: NBC stucco cladding test specimen showing nominal size and extent of cracks on cladding surface [3]
Figure 16: Measurement of water entry rate behind NBC stucco [3] 0 100 200 300 400 500 600 700 800 0 100 200 300 400 500 600 700 800 3.4 L/(min-m2) 1.6 L/(min-m2) 0.8 L/(min-m2)
Low-, Mid- and High-Rise Buildings
Low-Rise Buildings Pressure (Pa) W a te r E n tr y R at e (m L/ m in )
Figure 17: Measurement of the percentage of water entry rate behind NBC stucco [3]
The results of the water entry behind the NBC stucco cladding, as provided in Figure 17, were used to develop correlations for the percentage of water entry rate. These correlations are given as:
(1) For wind pressure, P 160 Pa [3]
85 . 1 685 . 0
5
2
.
6
10
4
54
.
2
P
E
E
WDR
(3)(2) For wind pressure, P 160 Pa 096 . 1 52012 . 0 005207 . 0 WDR P
(4) Where:λ = Water entry to the back surface of cladding (%),
WDR = Wind driven rain or spray rate (L/min-m2), and
P = Pressure (Pa).
Figure 18 shows a comparison between the measured percentage of water entry behind the NBC stucco and that calculated using the correlations given by Eqs. (3) and (4). As shown in this figure, both the measured and the calculated water entry rates are in good agreement for
0 1 2 3 4 5 6 7 8 0 100 200 300 400 500 600 700 800 3.4 L/(min-m2) 1.6 L/(min-m2) 0.8 L/(min-m2)
Low-, Mid- and High-Rise Buildings
Low-Rise Buildings Pressure (Pa) P er ce nt ag e of W at er E nt ry (% )
Figure 18: Comparison between the measured percentage of water entry rate behind the NBC stucco cladding and that calculated in Eqs. (3) and (4)
7 Summary
In an effort to investigate extending the applicability of the current National Building Code (NBC) requirements in respect to low-rise wood frame structures to structures comprising mid-rise wood construction, the Heat and Moisture Performance of Envelope group of NRC-Construction was tasked by the Mid-Rise Wood Buildings consortium to investigate the moisture management and water penetration performance of cladding systems and related deficiencies relevant to mid-rise buildings.
The testing consisted of incorporating a set of three deficiencies, each a 2.5 mm diameter circular opening located above a circular 405 mm ventilation pipe mounted in a fibre cement cladding. The cladding was subjecting to water deposition rates of 0.58, 1.16, and 1.74 L/min-m2 and at each of these water deposition rates the wall specimens were subjected to a sequence of pressure steps in which the differential pressures ranged from 0 Pa to 1150 Pa. This range of pressures was chosen as it encompasses all conditions found in Canada with the exception of the Northeastern tip of Newfoundland (St. Anthony’s) and the Western coast of the Queen Charlotte Islands (see reference [4] for more details). The test results were used to
0 1 2 3 4 5 6 7 8 0 1 2 3 4 5 6 7 8 P160 Pa P160 Pa +5% -5%
Measured Water Entry (%)
C
a
lc
ul
at
ed
W
at
er
E
n
tr
y
U
si
ng
C
o
rr
el
at
io
n
s
(%
)
develop correlations for determining the water entry percentage as functions of the water deposition rate (i.e. Wind Driven Rain, WDR) and pressure differential. These correlations are given by Eqs. (1) and (2), which are in good agreement with the experimental results.
In the second part of this report, the results of the water entry testing conducted in a previous study [2] on NBC stucco were used to develop correlations for determining the percentage of water entry as function of the WDR and wind pressure acting on the wall assembly. These correlations are given by Eqs. (3) and (4). The calculated water entry behind the NBC stucco using these correlations was in good agreement (within ±5%) with the measurements derived from the experimental results
In a subsequent step in this project the correlations provided in this report for both water entry through deficiencies (Eqs. (1) and (2)) and water entry behind the NBC stucco (Eqs. (3) and (4)) will then be used as inputs to a hygrothermal simulation model. The simulation model will thereafter be used to derive results on the hygrothermal performance for wood based structures of mid-rise construction when subjected to a number of different climatic conditions for various Canadian locations.
8 References
1. ASHRAE, ANSI/ASHRAE Standard 160 -2009 — Criteria for Moisture Control Design Analysis in Buildings, ASHRAE, Atlanta, GA, p.16.
2. Van Den Bossche, N.; Lacasse, M. A.; and Janssens, A., “Watertightness of masonry walls: an overview”, 12thInternational Conference on the Durability of Building Materials and Components (12DBMC), Porto, PT, April 12-15, 2011, pp. 1-8;
NRCC- 53970
3. Swinton, M.C., Lacasse, M.A., Armstrong, M.M., Saber, H.H., Mukhopadhyaya, P., Maref, W., Lohmann, F., Kumaran, M.K., Ganapathy, G., Nicholls, M., Abdulghani, K., Moisture Management Assessment of the Adhered Stone Cladding System - Final Summary Report,
Internal Report (IRC-IR-909). National Research Council of Canada, Institute for Research in Construction, Ottawa, Ontario, Canada,
March, 2012.
4. Cornick, S., Climatological Analysis for Hygrothermal Performance Evaluation: Mid-rise Wood, Client Report, National Research Council of Canada, Construction Portfolio, Ottawa, Ontario, Canada, February 2013.
5. Saber, H.H, and El-Genk, M.S, "On the breakup of a thin liquid film subject to interfacial shear," Journal of Fluid Mechanics, (500), pp. 113-133, 2004.
6. El-Genk, M.S., Saber, H.H., "Minimum thickness of a flowing down liquid film on a vertical surface," International Journal of Heat and Mass Transfer, 44, (15), pp. 2809-2825, 2001. 7. El-Genk, M.S., Saber, H.H., "An investigation of the breakup of an evaporating liquid film,
falling down a vertical, uniformly heated wall," Journal of Heat Transfer, 124, (1), pp. 39-50, 2002.
Appendix A
Test data
Specimen 2: Test 1 Data
0.00 2.00 4.00 6.00 8.00 10.00 12.00 14.00 16.00 18.00 0 50 100 15 0 20 0 25 0 30 0 35 0 40 0 45 0 50 0 55 0 60 0 65 0 70 0 75 0 80 0 85 0 90 0 95 0 10 00 10 50 11 00 11 50 12 00 W at er E nt ry R at e (m l/ m in )
Pressure Applied (Pa)
Fibre Cement -Specimen 2: Test 1 Water Entry Rate
Test Results
0.58 L/min-m2 1.16 L/min-m2 1.74 L/min-m2 Pressure Applied 0.58 L/min-m2 [mL/min] 1.16 L/min-m2 [mL/min] 1.74 L/min-m2 [mL/min] 0 0.00 0.00 0.05 50 0.00 0.00 0.03 75 0.72 0.35 1.38 150 2.59 2.05 3.38 300 1.67 1.11 4.33 500 2.40 0.24 6.63 700 4.16 2.09 11.66 1150 5.65 3.25 10.05Specimen 2 Test 2 Data
0.00 2.00 4.00 6.00 8.00 10.00 12.00 14.00 16.00 18.00 0 50 100 15 0 20 0 25 0 30 0 35 0 40 0 45 0 50 0 55 0 60 0 65 0 70 0 75 0 80 0 85 0 90 0 95 0 10 00 10 50 11 00 11 50 12 00 W at er E nt ry R at e (m L/ m in )Pressure Applied (Pa)