Augmenting Drug Process Development Capacity through Applications
of Lean Principles and High Throughput Tchnology
by
Maria Dominique Bautista Rustia
B.S., Industrial Engineering, De La Salle University, Philippines, 2012 M.S., Industrial Engineering, De La Salle University, Philippines, 2012
Submitted to the MIT Sloan School of Management and the Department of Mechanical Engineering in partial fulfilment of the requirements for the degrees of
Master of Business Administration and
Master of Science in Mechanical Engineering
in conjunction with the Leaders for Global Operations Program at the
MASSACHUSETTS INSTITUTE OF TECHNOLOGY
June 2018
@
2018 Maria Dominique Bautista Rustia. All rights reserved.The author hereby grants to MIT permission to reproduce and to distribute publicly paper and electronic copies of this thesis document in whole or in part in any medium now known or hereafter created.
Signature redacted
Au
thorCe~rtified
... ...
MIT Sloan School of Management and Department of Mechanical Engineering May 11. 2018
b
...
Signature
redacted
Richard Braatz, Thesis Supervldor Edwin R. Gilliland Prpfessor7Cyrnical Engineering
Certified by
...
.
...
S ig natu re red acted
Nelson Repenning, Thesis Supe risor School of Management Distinguished Professor of System Dynamics & Organization Studies
Signature redacted
Accepted b
Accepted b
y...
..---Daniel Whh ' s, is Reader
Senior Research Scientist, Emeritus, Lecturer, MIT Leaders for Global Operations, and Senior Lecturer, Mechanical Engineering
...
Signature redacted
y
...
S g a u e r d c e
Whan Abeyaratne Chairman, Committee on Graduate Students, Ijpartment ofjMechanical Engineering
Signature redacted.
yV . . . .- -MASSACHUSETS INSTITUTE OF TECHNOLOGY-JUN 0 7 2018
Maura Herson Director, MBA Program, MIT Sloan School of ManagementAugmenting Drug Process Development Capacity through Applications of
Lean Principles and High Throughput Technology
by
Maria Dominique Bautista Rustia
Submitted to the MIT Sloan School of Management and the Department of Mechanical Engineering on May 11, 2018, in partial fulfilment of the requirements for the degrees of
Master of Business Administration and
Master of Science in Mechanical Engineering
Abstract
The long development lead time and high R&D costs for biologics drugs makes it imperative to eliminate delays and inefficiencies. Limited process development capacity can lead to delays in the availability of life-saving drugs and a large opportunity cost for biopharmaceutical companies. This study investigates the combined viability and impact of two approaches, namely applying lean principles and using high-throughput technology to increase capacity and productivity in pivotal biologics drug process development. Specifically, the project will explore a framework for improved handoffs and work design, and propose management systems to sustain implementation. In parallel, the study tests the sensitivity of the process development cycle to various resource constraints through a discrete event simulation and develops heuristics for the effective use of high-throughput equipment in upstream and downstream processes to increase process development capacity. The two approaches identified a potential increase in throughput of 2.75X (+175%) in preparation for an anticipated 2.3X (+129%) growth in biologics program demand in pivotal process development.
Thesis Supervisor: Richard Braatz
Edwin R. Gilliland Professor, Department of Chemical Engineering
Thesis Supervisor: Nelson Repenning
School of Management Distinguished Professor of System Dynamics & Organization Studies
Thesis Reader: Daniel Whitney
Senior Research Scientist, Emeritus, Lecturer, MIT Leaders for Global Operations, and Senior Lecturer, Mechanical Engineering
Acknowledgements
'7f I have seen further than others, it is by standing on the shoulders of giants. "- Isaac Newton
This research would not have been possible without the incredible support of several people. First, I would like to thank my thesis advisers, Professors Richard Braatz, Nelson Repenning and Dan Whitney, for their visits to Amgen Massachusetts, for the guiding principles they provided throughout my research, and for their keen insights on my paper. It has been a pleasure working with them.
Second, I would like to thank Amgen, which welcomed me as an intern for a semester to conduct this research. Much gratitude goes to my executive sponsors, Margaret Faul and Shekar Ganesa, and to my executive champions, Aine Hanly and Sam Guhan, for ensuring that I had all the resources I needed to complete my work. I would like to thank my project supervisor, Lauro Gonzalez, and my local mentor, Roger Hart, for their enthusiastic direction, wisdom and objective review of my work. I also thank Matt Dumouchel, my LGO buddy and teammate at Amgen, for listening to my wild ideas, connecting me to knowledgeable experts, and helping me keep up the momentum for the project. This research would not have been possible without the efforts and patience of my teammates, namely Nitya Jacob and Christina Ives, whose critical feedback, optimistic outlook and late nights with me enabled the transformational results of this project. There are many other people to thank from Amgen's Pivotal Drug Substance, Attribute Sciences, CMC Lifecycle Management and DIPT teams whose names can easily fill a page. I thank them for their openness and participation in my research. I thank the LGO alumni at Amgen, especially Leigh Hunnicutt, who helped me navigate the complex world of a biotechnology company. Most of all, I would like to thank our HR representatives, Dollie Grajczak and Diana Ecker, who truly made me feel at home during my internship.
I thank my family and friends, whose weekly check-ins reminded me that I am not just here to learn, but to also have fun. I thank God and my special intercessor in heaven, Fr. Joseph Muzquiz. I am humbled to be at MIT and will never forget to pay it forward.
Finally, to my MIT LGO family: Thank you for giving me the best two years of my life. These projects are a mere preview of where we can bring value to the world. I look forward to the next leg of our journey.
The author wishes to acknowledge the
Table of Contents
C h ap ter 1 Introd uction ... 18
1.1 B ackground of the Study... 18
1.1.1 Productivity and Capacity Issues in the Biopharmaceutical Industry...18
1.1.2 Business Context: Process Development Capacity at Amgen ... 20
1.2 Problem Statem ent and O bjectives ... 22
1.3 Research Methodology and Conceptual Framework ... 23
1.4 Scope and Lim itations... 25
1.5 T h esis O verv iew ... 26
C hapter 2 Literature R eview ... 28
2 .1 In trod u ction ... 28
2.2 The Large-Molecule Drug Development Process... 29
2.3 Trends in the Biopharmaceutical Industry Influencing Speed-to-Market and Productivity ... 3 1 2.3.1 Process Analytical Technology (PAT) ... 31
2.3.2 Q bD (Q uality by D esign)... 32
2.4 Lean Principles in Drug Process Development...34
2.4.1 M easuring R& D Productivity... 34
2.4.2 Capacity Management Paradigms in New Product Development ... 36
2.4.3 Cases of Lean Process Improvements in the Biopharmaceutical Industry...38
2.5 High Throughput Technology in Drug Development ... 41
2.5.1 High Throughput Technology and Its Perceived Benefits...41
2.5.2 Past Applications of High Throughput Technology...42
2.6 Applications of Simulation Modelling in the Biopharmaceutical Industry... 45
2.7 G ap A nalysis from Literature Review ... 48
Chapter 3 C urrent System A nalysis...50
3.1 Problem Diagnosis and Root Cause Analysis...50
3.1.1 Organizational Evolution of Process Development Operations ... 50
3.1.3 Problem Classification and Prioritization...53
3.2 State of High Throughput Technology Implementation...55
3.2.1 Process Flow Mapping and Results ... 55
3.2.2 Upstream Operations ... 56
3.2.3 Downstream Operations...57
3.3 Summary of Focus Areas for Dual Approach Investigation ... 59
Chapter 4 W orking Faster: Lab Process Excellence in Experimental W ork ... 61
4.1 Defining Optimal Experimental W ork Design ... 61
4.1.1 Current Method of Experiment Design... 61
4.1.2 Key Principles for Optimizing Experimental W ork Design... 62
4.2 Rightsizing Process Development W ork ... 64
4.2.1 Development of Rightsizing Template...64
4.3 Leveraging Prior Knowledge in Experiment Design... 67
4.3.1 Proposed Management System ... 67
4.4 Hypothesis Generation Testing...69
4.4.1 Statement of Hypothesis ... 69
4.4.2 Test M ethodology ... 69
4.4.3 Test Results and Analysis... 70
4.5 Streamlining Commercial Process Development and Process Characterization...71
4.5.1 Diagnosis and Data Gathering ... 71
4.5.2 Upstream Process...73
4.5.3 Downstream Process ... 76
4.5.4 Proposed Pivotal Process Design...79
4.6 Key Findings and Recommendations... 80
Chapter 5 Doing M ore: Applications of High Throughput Technology... 82
5.1 Summary of High Throughput Initiatives and Assessment ... 82
5.2 Hypothesis Generation ... 83
5.3 Simulation Design ... 85
5.3.1 M odel Overview ... 85
5.3.3 Assumptions and Limitations... 86
5.3.4 Simulation Parameters, Inputs and Outputs ... 89
5.3.5 Simulation Validation ... 89
5.4 Hypothesis Testing...90
5.4.1 Hypothesis 1: Capacity for Upcoming Program Pipeline ... 90
5.4.2 Hypothesis 2: Total Impact of Current HTT Initiatives... 92
5.4.3 Hypothesis 3: Cross-Training Benefits in Pivotal DS PD ... 95
5.5 Process Sensitivity Analysis ... 98
5.5.1 Other System Constraints and Scenario Generation...98
5.5.2 Equipment Downtime ... 99
5.5.3 Program Team Size... 101
5.5.4 Number of Runs... 102
5.5.5 Portfolio Scheduling ... 104
5.6 Key Findings and Recommendations... 105
Chapter 6 Conclusions and Future W ork... 108
6.1 Summary of Key Findings... 108
6.1.1 Lean Principles through Lab Process Excellence ... 108
6.1.2 High Throughput Technology ... 109
6.2 Assessing Combined Impact and Viability... 110
6.2.1 Combined Cycle Time Savings and Throughput Improvement... 110
6.2.2 Estimating the Financial Value of Improvements... 110
6.2.3 Viability of Proposed Improvements ... 112
6.3 Recommendations for Future W ork ... 113
6.3.1 Pilot Implementation and Immediate Actions... 113
List of Figures
Figure 1-1: Declining R&D expenditure-to-approval ratio over time [9]. Reprinted by permission from Springer Nature: Nature Reviews Drug Discovery, Diagnosing the decline in pharmaceutical
R&D efficiency, J.W. Scannell, A. Blanckley, H. Boldon, et al.
@
2012. ... 19Figure 1-2: Overview of the drug development process ... 20
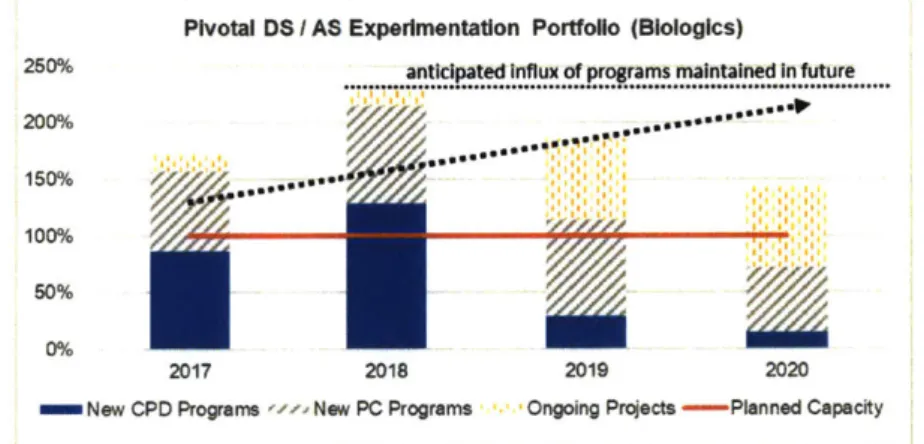
Figure 1-3: Amgen's planned FTE capacity vs. program demand from 2017 to 2020 ... 21
Figure 1-4: Conceptual framework of thesis study... 24
Figure 1-5: Research scope within the drug development process...25
Figure 2-1: Fed-batch versus perfusion processes [24]. It should be noted that both fed-batch and perfusion processes start with an expansion of cells prior to bioreactor processing...30
Figure 2-2: Typical mAb process flow [26]. Reprinted by permission from Elsevier: Trends in Biotechnology, Purifying biopharmaceuticals: Knowledge-based chromatographic process development, A.T. Hanke & M . Ottens.
@
2014. ... 31Figure 2-3: An idealized configuration of processing with the application of PAT [30]. Reprinted by permission from CRC Press: PAT applied in biopharmaceutical process development and manufacturing: an enabling tool for quality-by design, Strategic vision for integrated process analytical technology and advanced control in biologics manufacturing, C. Undey, D. Low, J.C. M enezes, M . K och .
@
2012...32Figure 2-4: Quality by Design milestones [36]. Reprinted by permission from Elsevier: Trends in Biotechnology, Quality by design (QbD)-based process development for purification of a biotherapeutic, A . R athore.
@
2016 ... 33Figure 2-5: A productivity map for biopharmaceutical companies in 2014 [39J. Reprinted by permission from John Wiley and Sons: Journal of Clinical Pharmacy and Therapeutics, Research and development productivity map: Visualization of industry status, H. Shimura, S. Masuda, H. K im u ra .
@
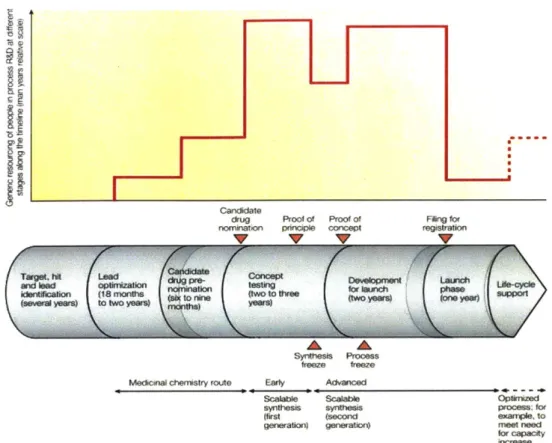
20 14 . ... 35Figure 2-6: FTE resource requirements in Process R&D throughout drug development [13]. Reprinted by permission from Springer Nature: Nature Reviews Drug Discovery, A guide to drug
discovery: Logistics of process R&D: transforming laloratory methods to manufacturing scale,
H-J . F ed ersel.
@
2003 ... 38Figure 2-7: Conceptual FTE resource and cycle time benefits of high throughput technology. 41 Figure 2-8: History of high throughput screening (HTS) in Pfizer [53]. Reprinted by permission from John Wiley and Sons: British Journal of Pharmacology, Origin and evolution of high throughput screening, D.A. Pereira & J.A. Williams.
@
2007. ... 42Figure 2-9: Correlation between experimental design and analytical effort [54]. Reprinted by permission from John Wiley and Sons: Chemical Engineering & Technology, High throughput screening of chromatographic phases for rapid process development, M. Bensch, P.S. Schulze, E. von Lieres, J. H ubbuch.
@
2005. ... 43Figure 2-10: Tornado diagram detailing the influence of various factors on an NPD's value [651. Reprinted by permission from John Wiley and Sons: Chemical Engineering & Technology, Modelling of the biopharmaceutical drug development pathway and portfolio management, A. Rajapakse, N.J. Titchener-Hooker, S. S. Farid.
@
2005...47Figure 3-1: The Lab Process Excellence (LPE) framework ... 54
Figure 3-2: Breakdown of process cycle times in upstream operations...56
Figure 3-3: Breakdown of process cycle times in downstream operations ... 58
Figure 4-1: Applied principles to optimize experimental work design ... 63
Figure 4-2: Information handoffs within Attribute Sciences (AS) process steps...65
Figure 4-3: Sample of a rightsized template for upstream experimentation. See Appendix for the other tem plates developed...67
Figure 4-4: Proposed review process incorporating the rightsizing templates...68
Figure 4-5: Automated PD process workflow to support proposed management system and tools ... 6 9 Figure 4-6: Redefined upstream process design with breakdown of process design experimentation ... 7 3 Figure 4-7: Redefined downstream process design with breakdown of early experimentation .. 76
Figure 4-8: Further details of confirmation runs and late design experimentation for downstream ... 7 6 Figure 4-9: Summary of proposed pivotal process design ... 79
Figure 5-1: Generic process flow diagram used in simulation model...88 Figure 5-2: Summary of simulation model inputs and outputs...89 Figure 5-3: FTE resource utilization changes throughout projected biologics programs over the next three years. Dates hidden for confidentiality. ... 92 Figure 5-4: Reductions in FTE utilizations at each process development phase. Each chart also displays a lower peak FTE utilization under a HTT scenario throughout a program lifetime.... 95 Figure 5-5: FTE utilization before and after cross-training ... 97 Figure 5-6: Simulation results showing the impact of equipment downtime on pivotal PD program throughput and Total PD FTE utilization... 100 Figure 5-7: Simulation results showing the impact of program team size on pivotal PD program throughput. Utilization is not mapped as there is an evident and proportional increase in utilization w ith a decrease in team size. ... 101 Figure 5-8: Simulation results showing the impact of run size on pivotal PD program throughput and peak F T E utilization . ... 103 Figure 5-9: Illustration of the impact of portfolio timing ("phasing") on Pivotal PD FTE utilization with HTT fully implemented in Pivotal PD. ... 105 Figure 6-1: Combined impact of proposed initiatives ... 110 Figure 6-2: Assessment of the viability of each initiative where the origin is the optimal level
List of Thbles
Table 3-1: Classification of root causes identified into five of the seven wastes...54
Table 3-2: Summary of process cycle times across unit operations in pivotal PD. Highlighted process steps represent > 70% of cycle time while steps in red are currently exploring high throughput technologies that can influence cycle time. The red process steps have not yet implemented high throughput technology (HTT) and therefore do not yet reflect the effects of H T T ... 5 5 Table 3-3: Comparison of average CPD and PC run sizes...58
Table 4-1: Information required for handoffs during pivotal portfolio review meeting ... 66
Table 4-2: Summary of experiment reductions across programs...70
Table 5-1: High throughput initiatives at Amgen Pivotal Drug Substance Process Development. The table also presents the unit operations, sub-processes and their current, low throughput contributions to the total FTE time required across upstream and downstream operations. ... 82
Table 5-2: Summary of estimated FTE capacity freed by all HTT initiatives in Pivotal PD... 84
Table 5-3: Highlights of the simulation validation... 90
Table 5-4: FTE resource utilization for pipeline programs without HTT implemented...91
Table 5-5: PD FTE time requirements and capacity improvements due to HTT ... 94
Table 5-6: Cycle time and throughput improvements due to HTT...94
List of Equations
Equation 1-1: Manufacturing expression of Little's Law [15]. Throughput or the average output of a production process is a function of the WIP (inventory of products during a process) and cycle time (the time a product spends as W IP) [16]. ... 22 Equation 2-1: Little's Law as presented by Little & Graves [16]. L refers to the average items in a queue or system, X arrival rate of items per unit of time, and W the average waiting time in th e sy stem ... 3 5 Equation 2-2: R&D Productivity Equation as proposed by Paul, et al. [1]. R&D productivity (P) is a function of work in process (WIP), the probability of a program's technical success (p(TS)), the market value of the program if successful (V), the cycle time (CT) and program cost
(C ). ... ... ... 35
Equation 5-1: Formula to calculate total FTE capacity freed based on Table 5-1 data. Sij refers to the FTE time required per sub-process as a % of total FTE time requirements. Ri refers to the FTE time required per unit operation as a % of total FTE time requirements. Each upstream and downstream unit operation is represented by a number (i) while each sub-process within those unit operations is represented by a num ber (j)... 84 Equation 5-2: Formula for throughput increase (%) where LT cycle time refers to low throughput cycle time and HT cycle time refers to high throughput cycle time...93 Equation 5-3: Equation for Relationship of Throughput and Equipment Failures ... 100 Equation 5-4: Equation for Relationship of Total PD FTE Utilization and Equipment Failures
... 1 0 0
Equation 5-5: Equation for Relationship of Throughput and DS Team Size ... 102 Equation 5-6: Equation for Relationship of Throughput and AS Team Size ... 102 Equation 5-7: Equation for Relationship of Throughput and Experiment Run Size ... 103 Equation 5-8: Equation for Relationship of Peak DS FTE Utilization and Experiment Run Size
... 1 0 3
Equation 5-9: Equation for Relationship of Peak AS FTE Utilization and Experiment Run Size
Acronyms
AS Attribute Sciences
ASTL Attribute Sciences Team Lead
cGMP Critical Good Manufacturing Practices
CPD Commercial Process Development
CPP Critical Process Parameters
CQA Critical Quality Attributes
DEA Data Envelopment Analysis
DIA Drug Information Association
DOE Design of Experiments
DS Drug Substance
DSTL Drug Substance Team Lead
FAL Functional Area Lead
FDA Food and Drug Administration
FIH First-in-Human
FTE Full-Time Employee
GCSF Granulocyte Colony-Stimulating Factor
HTPD High Throughput Process Development
HTT High Throughput Technology
ICH International Conference on Harmonization
KPI Key Performance Indicator
LPE Lab Process Excellence
NBE New Biological Entity
NME New Molecular Entity
NPV Net Present Value
PAT Process Analytical Technology
PC Process Characterization
PD Process Development
QbD Quality by Design
QTPP Quality Target Product Profile
SKU Stock-Keeping Unit
UF/DF Ultrafiltration / Diafiltration
Chapter 1
Introduction
This section provides a background on the productivity and capacity issues in the biopharmaceutical industry and Amgen, highlighting the importance of capacity management methods. Two approaches are proposed with the goal of testing their
combined efficacy on program throughput. The overall research methodology, conceptual framework and limitations of the thesis are also discussed
"We firmly Lelieve that Loth good process and good science are not only compatible, but together will yield the greatest return on R&D investments and thus, have the greatest impact on R&D productiity."- Paul, et al. [1 ]
1.1 Background of the Study
1.1.1 Productivity and Capacity Issues in the Biopharmaceutical Industry
One of the defining characteristics of medicine is the long period of time required for its development. A typical biologics drug can take 10 to 15 years to develop and release into the market
12].
For rampant illnesses like cardiovascular disease, which kills 34 people across the world every minute [31, the timeliness of drug availability is essential. This high potential to save human lives places increased pressure on the $163 billion global biopharmaceutical industry with over 7000 medicines currently under development but with only an average of 32 successful Food and Drug Administration (FDA) approvals each year since the year 2000[4].
Several factors make it imperative to eliminate time delays and inefficiencies in the drug development process. First, rising healthcare costs as a result of an aging population is increasing pressure on biopharmaceutical companies to deliver drugs at a lower cost and higher efficiency. This is particularly true for biologics or large-molecule drugs which are roughly 22 times the daily cost of small-molecule drugs [5]. Second, despite a compounded annual growth rate of 8% [6], biologics have experienced increasing R&D (research and development) costs as a result of declining clinical approval success rates (Figure 1-1). Total capitalized costs have increased at an annual rate of 8.5%, well above price inflation, and R&D costs have increased to above $2.5 billion per drug. These are due to rising costs in the clinical phase (contributing 57% increase in the total cost) and labor costs increasing by 8 to 9% annually [2]. On average, only 12% of drugs entering the clinical trial phase result in an approved medicine [4]. The low productivity of biopharmaceutical drug development has increased pressures on companies to reduce costs [7].
Third, patent expirations and the prevalence of biosimilars now threaten the market competitiveness of biopharmaceutical companies. Every month of delay presents a valuable opportunity cost to the developer. Being first-to-market for a New Biological Entity (NBE) could grant a company a 6% market share advantage over later entrants [8]. These impacts highlight the importance of improving efficiency and productivity in drug development.
100
-Drugs per billion US$ R&D spending 5 years previously
10
Drugs per billion US$ R&D spending
0-1950 1960 1970 1980 1990 2000 2010
Figure 1-1: Declining R&D expenditure-to-approval ratio over time [9]. Reprinted by permission from Springer Nature: Nature Reviews Drug Discovery, Diagnosing the decline in pharmaceutical R&D efficiency, J.W. Scannell, A. Blanckley, H. Boldon, et al.
@
2012.Accounting for an uncontrollable ten months of FDA review and a trial success rate that is difficult to predict, companies must turn to endogenous factors that can increase productivity. Pursuing a larger pipeline of parallel research programs increases chances at yielding success, factoring in standard rates of attrition [10], [11]. However, this large volume of work will only be possible with sufficient R&D and manufacturing capacity throughout the different phases of drug development. Insufficient resource capacity can lead to delays in the development of life-saving drugs. While there may be a tendency to operate at capacity, building sufficient slack equips an organization with the flexibility to adjust to pipeline variability, whether due to changes in strategy or due to actual technical roadblocks. Building sufficient capacity also protects a company against firefighting scenarios [12].
Much of existing literature have investigated capacity improvement methods solely for commercial drug manufacturing and provided high-level overviews for R&D as a whole. The drug development process is summarized in Figure 1-2. The process begins with drug discovery, which can take between two to ten years. Several proteins, compounds, antibodies or substances are generated and tested until a target is selected, based on the desired properties and characteristics
that are critical for a disease. Lead candidates are then compared with each other until a molecule is selected to advance into development. Pre-clinical and first-in-human (FIH) process development follows by generating cell banks and a fit-for-purpose FIH process. The drug then enters clinical trials (Phases 1 to 3), each phase corresponding to a different patient group size and testing purpose. During these clinical trials, Pivotal Process Development occurs whereby a commercial drug manufacturing process is developed and tested for robustness. Once the drug passes all three phases of clinical trials, all pertinent document is filed to the FDA for review and
approval. Once approved, the drug can proceed to commercial manufacturing and launch.
CLINICAL TESiNG
Figure 1-2: Overview of the drug development process
Limited, granular research is available on capacity management and productivity improvement at the Pivotal Process Development phase of large-molecule drugs. Pivotal Process Development, the phase during which the manufacturing process of a drug is designed and tested for robustness, is performed during Phases II and III. In a deeper analysis of 60% of the global R&D spend in pharmaceuticals, Phase II has the highest attrition and vulnerability among all drug development phases. Trends between 2008 to 2010 also reveal that although efficacy is the primary reason behind program attrition (51%), purposeful suspension due to strategic reasons (29%) is the second driver [111. The poor risk--reward ratio and market pressures cited earlier prompt biopharmaceutical companies to be more selective in their portfolio management and allocation of resources to programs. To add to this, process changes often occur within Phase II itself, increasing demand on the limited resources available in a shortened timeline [131. Given these trends and research gaps, there is an opportunity to explore capacity management methods in the biopharmaceutical industry's process development realm.
1.1.2
Business Context: Process Development Capacity at Amgen
Amgen, Inc. is a global biopharmaceutical company that has focused on developing medicine
foundation in 1980, Amgen has successfully commercialized 15 drugs and currently has the industry's largest toolkit with 13 modalities across its pipeline and marketed products. At present, Amgen has publicly disclosed 33 preclinical and clinical targets under development with strong genetic support. With its increasing pipeline and resource utilization, Amgen has realized the need to augment its process development capacity to meet program demands.
From an organizational perspective, Pivotal Process Development (PD) at Amgen is a combination of R&D and Manufacturing, with primary activities involving lab experimentation by Upstream and Downstream project teams. Since these experiments are not pressured by scale, full-time employee (FTE) resources are the primary constraint or capacity-defining resource. As shown in Figure 1-3, Amgen is expecting a 129% (2.3X) increase in the number of Pivotal PD biologics programs over the next three years, but relatively static FTE capacity. Although the chart indicates that Pivotal PD is operating above 100% of its planned capacity (and has been validated as doing so by activity trackers and resource management platforms), this has been managed by the cancellation and spreading out of programs. Although throughput has not waned, the situation presents a risk of entering and remaining in a firefighting condition which may impair future productivity. Past process improvement projects have been made within the Drug Discovery stage, specifically in Therapeutic Discovery and Medicinal Chemistry [14], but similar initiatives have yet to be conducted for Pivotal Process Development (PD), hence the proposal of this study.
Pivotal DS I AS Experimentation Portfolio (Blologics)
250% antcipated ...influx of programs maintained In future 200%
100% 50% 0%
2017 2018 2019 2020
inNew CPD Programs wz New PC Programs Ongoing Projects -Planned Capacity
1.2 Problem Statement and Objectives
Amgen can take several approaches to augment pivotal PD capacity to at least match its growing pipeline. As illustrated in Figure 1-3, the anticipated rate of increase in the number of programs is approximately 129% (2.3X), therefore the objective of this study is to increase the current program throughput of the pivotal PD process by at least 2.3X. However, considering queuing theory and a recommended productivity capacity utilization of 80% to minimize blocking as program demand approaches capacity, the target throughput increase should be at least 2.8X. In selecting which approaches to take, we can revisit the R&D productivity formula introduced by Paul et al [1], which will be discussed in greater detail in Chapter 2. Isolating the variables that are more readily controllable in the formula, we arrive at a translation of Little's Law popularized by Hopp & Spearman [151:
Throughput (X) Work-in-Process (WIP)
Cycle Time (CT)
Equation 1-1: Manufacturing expression of Little's Law [15]. Throughput or the average output of a production process is a function of the WIP (inventory of products during a process) and cycle time (the time a product spends as WIP) 116].
Based on this equation, increasing throughput may be done by optimally manipulating the number of programs (WIP) and cycle time (CT). The ability to estimate the resources required to achieve the desired throughput and to balance both WIP and CT is defined as capacity management
11].
Capacity management is important to minimizing any potential delays that may arise as a result of having insufficient FTE resources available to work on program demand, which may consequently affect speed to market. Given the relatively static FTE capacity against the growing program demand in the coming years, continuously improving the number of programs that FTEs can complete within a given time period ("efficiency") without incurring significant additional risk is also important to maintaining the productivity of the Pivotal PD organization. To address resource constraints and to guide future investments in Amgen Pivotal PD capacity, there is a need to determine the combined viability and impact of the two Amgen-proposed approaches on overall FTE capacity and throughput:(1) working faster by using lean principles ("Lab Process Excellence" or LPE) to reduce cycle time, and
(2) doing more by investing in high throughput technology (HTT) to run more programs, thereby increasing WIP and also decreasing cycle time.
The goal of the study is to perform this investigation and to provide heuristics or recommendations to augment Pivotal PD capacity for biologics. Specifically, the study will explore a framework for optimized work design, and propose management systems to sustain implementation. In parallel, the project will test the sensitivity of the process development cycle to various FTE resource constraints and develop heuristics for the effective use of high-throughput equipment in upstream, downstream and analytical lab processes. The study also seeks to fill an identified gap in the available research on the combined impact of both process and technological improvements in the PD realm of large-molecule drugs.
1.3 Research Methodology and Conceptual Framework
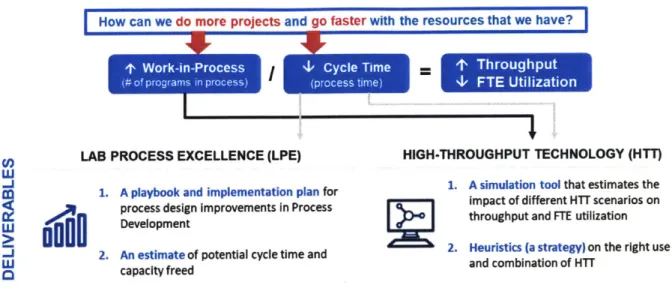
The research methodology uses the two approaches defined in the problem statement with the goal of providing process development scientists and key decision makers with useful tools and insights to increase their program throughput. As summarized in the conceptual framework in Figure 1-4, the study seeks to answer one question: How can we do more projects and go faster with a finite set of resources? Each approach tackles the two variables driving throughput, based on Equation 1-1: work-in-process (the number of biologics programs per year) and cycle time (how fast each unit operation and drug development phase takes). There are several factors that can potentially limit both variables. The rate at which equipment can process samples is one factor to consider, but its use is also dictated by the availability of FTEs to run the equipment. Aside from this, beginning an actual experiment also relies on FTEs to plan and design the experiment. Therefore, in a hierarchy of constraints, human resources are the primary rate-limiting resource for drug development [17]. The two approaches proposed in this study also seek to free up FTE capacity. It is important to note that increased FTE capacity does not necessarily translate directly into increased throughput since FTEs are not used for the entirety of the PD process.
How can we do more projects and go faster with the resources that we have?
LAB PROCESS EXCELLENCE (LPE) HIGH-THROUGHPUT TECHNOLOGY (HTT)
1. A playbook and implementation plan for 1. A simulation tool that estimates the process design improvements in Process impact of different HTT scenarios on
Development throughput and FTE utilization
2. An estimate of potential cycle time and 2. Heuristics (a strategy) on the right use
W caaiyfedand combination of HiT
o
capacity freedFigure 1-4: Conceptual framework of thesis study
In the first approach (Lab Process Excellence), a framework is developed for applying lean principles through optimized work design, then supported by a proposed set of management systems and tools. The goal of this approach is to define the optimal experiment design for process development. Interviews of experienced scientists are used to identify the root causes of limited throughput and high resource utilization. The study investigates three components to work design: (1) defining the optimal type and number of experiments required, (2) establishing systems that will enforce the use of prior knowledge for continuous learning and reduced experimentation, and (3) streamlining program phases. A hypothesis is generated on the potential cycle time and throughput improvements that can be gained from improved work design. Given the absence of active biologics programs for testing and the limited research period, the study relies on a retrospective exercise where a recent program's actual experiments are fitted into the proposed framework, and the potential savings that could have been realized are quantified.
In the second approach (High Throughput Technology), the different applications of high-throughput technology (HTT) in upstream, downstream and analytical lab unit operations are reviewed based on their viability and load capacity. The goals of this approach are to quantify the potential impact of HTT on process development capacity and to provide a simulation tool that can be used to test the system's sensitivity to a hierarchy of constraints. Test scenarios are developed based on select technologies and tested on a discrete event simulation that is designed and validated for accuracy. To isolate the effects of HTT, the simulation follows the new process design proposed under Lab Process Excellence. The simulation takes into account portfolio
scheduling, FTE resource availability, cycle times, scale-up method, load sizes and equipment capability to model end-to-end unit operations in Pivotal PD. Hypotheses are generated based on a theoretical cycle time and throughput calculation using cycle time data recorded from time-and-motion studies. These hypotheses are then tested using the simulation. The insights gained from both approaches form recommendations for further implementation and research.
1.4 Scope and Limitations
The scope focuses on large-molecule (biologics) pivotal PD which is the phase performed in parallel with Phase II and III clinical trials where the manufacturing process for a biologics drug is tested and qualified for effectiveness and robustness. Figure 1-5 summarizes the research scope in the context of the drug development process. There are currently two stages:
(1) Commercial Process Development (CPD) - the stage where a manufacturing process is developed and tested for its ability to produce the targeted drug at a smaller scale (2) Process Characterization (PC) -the stage where process developed in CPD is tested for
robustness.
CLINICAL TRIALS
- --- ii-- --- l i i
S consistent product qualityfor each critcal quaty attrbus (CQA)
I~
: 1g
Ing~ru I PVTLPOSsEVnLeO( ME) T
Figure 1-5: Research scope within the drug development process
The same program team is responsible for conducting both CPD and PC, implying labor constraints. The program team can be divided into two groups:
(1) Drug Substance (DS) - the scientists that conduct upstream and downstream
experimentation (i.e. expression, scale-up and purification)
(2) Attribute Sciences (AS) - scientists with expertise in assay method development,
Although both groups are involved in pivotal PD, this thesis focuses mostly on the DS team due to their sponsorship of this research.
The detailed limitations of the LPE and HTT approaches will be discussed in their corresponding chapters, but the following limitations govern the overall study:
* The study will focus on process development for traditional fed-batch processes for large-molecule drug development. The development of perfusion or continuous manufacturing processes will not be considered in this thesis but is proposed for further research as Amgen and the rest of the industry gain more experience with this for process development. The details and differences between these two processes are discussed further in Chapter 2.
0 The effects of the LPE and HTT improvements will not be studied outside the Pivotal Process Development phase for large-molecule drugs.
0 Small-molecule applications will not be considered.
0 Design of Experiments studies to assess the full capabilities of the HTT will not be explored in this study. The discrete event simulation will focus on unit operations, not the mechanics of the equipment.
0 No new equipment will be sourced or developed outside Amgen's existing portfolio. 0 Due to a limited research timeframe and the absence of active programs for pilot tests,
the validation of the proposed solutions is constrained to retrospective studies and simulation runs.
0 The proposed changes might not be applicable to all modalities. Hypothesis testing is restricted to monoclonal antibodies (mAbs) and bi-specific T-cell engagers (biTEs) due to wider availability of historical data.
1.5 Thesis Overview
The study lays its foundation on literature reviews on lean applications in the biotech or pharmaceutical industry and high-throughput technology, ongoing technology development initiatives at Amgen, interviews with scientists, process mapping exercises and collection of cycle times and load sizes from past experiments. These reviews and calculations of theoretical cycle time and FTE capacity savings generate the study's hypotheses under the two approaches.
Chapter 2 provides an overview of the drug development process for large molecule drugs to guide further discussion. It then examines the latest trends that are driving productivity and speed-to-market in the biopharmaceutical industry, both from the aspect of process improvement and from the use of high throughput technology. Gaps in existing literature on the use of lean principles and simulation modelling are also discussed, which builds the case further for this study. Chapter 3 provides an overview of the dual-approach methodology that is used by the study and the analysis that was done to narrow down the focus areas for both approaches. Results from shadowing scientists, interviews and a broad assessment of HTT initiatives at Amgen are funnelled into specific actions for the succeeding experiments.
Chapter 4 details the first approach which employs lean principles to improve process development. It addresses three areas of interest, resulting in a proposed pivotal process design, supported by a set of tools and management systems that can enable its successful implementation. Chapter 5 details the second approach which employs high throughput technology (HTT) to release FTE capacity and increase overall pivotal PD throughput. It discusses the model used in the simulation exercises, the hypotheses to be tested and the actual results of the tests. The last section is used to test a high throughput system's sensitivity to other variables such as equipment failures, experiment run size and team size, then establishes further heuristics for the
appropriate use of HTT as a result of these tests.
Chapter 6 summarizes the conclusions from the study, assesses the combined impact of the two approaches relative to total pivotal PD throughput, FTE utilization and financial value. It ends with recommendations to continue the work that has been started and to conduct further research.
Chapter
2
Literature Review
This chapter defines the gaps in existing literature that this research aims to fill. It gives a brief overview of the process development in biologics drug development, examines trends influencing productivity in the industry, including past research conducted on the application of lean principles, high throughput technology and simulation modelling to increase process throughput.
2.1 Introduction
New biological entities (NBEs) have been studied to have a higher chance of success compared to small-molecule drugs [1], hence the expansion of several pharmaceutical companies into biologics. The growth of proportion of pipeline dedicated to specialty products and biologics exceeded 10% between 2010 to 2014 [18]. With the growing competition in the market but the low approval rates of drugs, there is a need to increase productivity in biopharmaceutical companies. As Federsel summarizes, the increasing pressure from the market to reduce the cost of medicine, the upcoming expiration of several drug patents and the significant opportunity costs to be incurred from failing to be first-to-market have increased the awareness within the biopharmaceutical industry of the importance of process R&D [131. Process development, sometimes called process R&D in other organizations, is responsible for developing the manufacturing process for a drug. In this phase, the process parameters are not only developed, but are also tested for robustness. Two logical approaches to increasing productivity would be (1) achieving speed-to-market through faster process development and (2) reducing costs by streamlining the production process for drugs 119].
Some suggestions from previous research to improve productivity are to involve a more data-or evidence-based approach to decision-making and aligning infdata-ormation with Quality Target Product Profile (QTPP), seeking expertise during decision-making, and reducing cycle time and operational costs [201. Reducing process development times, adopting a fail-fast approach given the low success rate of candidate drugs during trials, enhancing protocol design and control and boosting productivity are all necessary to maintain competitiveness in the biopharmaceutical industry [21]. Nfor et al. [22] summarize four rising techniques in process development: (1) heuristic or knowledge-based process development, which relies on the building up of prior knowledge and
experience for parameter selection and optimization, (2) process optimization through mathematical models to increase understanding of unit operations, (3) high throughput process development with the assistance of automation and data processing, and lastly, (4) a hybrid of all techniques. Literature reviews identify multiple articles for each technique individually, but very few highlight the effectiveness of a hybrid of techniques. This presents an opportunity for further research.
2.2 The Large-Molecule Drug Development Process
A biologics or large-molecule drug, as defined by the FDA, is a complex product that is derived from a natural source or living organism, typically Chinese hamster ovary (CHO) cells or E-coli. Biologics bind to cell receptors that are identified with a specific disease. Because of the complex behavior of biologics, they undergo a different drug development process, divided into upstream and downstream processing.
In upstream processing, the cell line for a protein is generated, cultivated or scaled up in media over several days, then harvested for further processing or filtration. Upstream processing is time-sensitive since the drug substance degrades over time in a bioreactor system. There are two dominant methods of cell culture used in the industry: fed-batch processing and perfusion. In a typical fed-batch process, a vial of drug substance is thawed over a few hours, pipetted into a shake flask with media addition for increased yield, then undergoes culturing over time, moving from a shake flask to eventually inoculating a bioreactor for production of large volumes. Centrifugation or filtration is then used to harvest the desired material for downstream filtration. In perfusion processes, the vial of drug substance undergoes the same process steps as those in fed-batch production, media is continuously added to the cell culture while harvest is done in parallel for material containing the desired protein. Fed-batch processes last up to two weeks while perfusion processes can run between one to two months [231. This timing is influenced by the growth rate of cells during expansion and the expression rate of cells during production.
m~d BIOREACTOR
Figure 2-1: Fed-batch versus perfusion processes [24]. It should be noted that both fed-batch and perfusion
processes start with an expansion of cells prior to bioreactor processing.
Downstream processing takes the cultivated material and purifies the desired protein through several filtration steps. Xenopolous [25] and Hanke & Ottens [26] provide templates for a
typical downstream process for a monoclonal antibody (mAb), which consist of a Capture step
via affinity chromatography for Protein A (ProA), the chemical inactivation of viruses, further filtration through two Polishing steps that use different types of chromatography, depending on the desired protein. Some examples of chromatography techniques used in these stages by industry are cation exchange (CEX), anion exchange (AEX), hydrophobic interaction (HIC) and mixed-mode chromatography (MMC). Alternatively, polishing steps may be separated by viral filtration
steps. In some processes, gradient elution is used, followed by Viral Filtration, another flow-through chromatography process step, then a final filtration using Ultrafiltration
/
Diafiltration.Both upstream and downstream processes provide samples that are used for further
statistical analysis. These samples can undergo different assays which are lab tests that are
conducted to qualitatively and quantitatively measure specific parameters for the target protein. These further contribute to the total process development lead time for a drug. In the 2016 High Throughput Process Development (HTPD) Conference [27], a more critical area for improvement cited by attending biopharmaceutical companies is the inconsistency in workflows when transferring samples from PD to analytics highlighting the need for coordination of the two to meet PD needs.
Upo.M P ahmwy c.apuM Va renbvavl.n POWi*ig *areomsimal FUO m~Com
MUM- Cnrt~gtln Prti A PH1 adjusMent Fitratio CEX -4 ACYq'W4MC~,.i 205 nm cu-n Uafraton caN csiiore
TMEAM In DIM Id f P f
Figure 2-2: Typical mAb process flow [261. Reprinted by permission from Elsevier: Trends in Biotechnology, Purifying biopharmaceuticals: Knowledge-based chromatographic process development, A. T. Hanke & M. Ottens.
@
2014.2.3 Trends in the Biopharmaceutical Industry Influencing
Speed-to-Market and Productivity
2.3.1 Process Analytical Technology (PAT)
Several FDA guidelines and industry practices have been proposed in response to the growing need for increased productivity and cost competitiveness in the biopharmaceutical industry. One of these guidelines was Process Analytical Technology (PAT) which was proposed in 2004 as a response to a call for more innovative and risk-taking means of promoting more efficient production methods for as long as they maintain product safety [19]. The PAT framework proposes the use of in-line measurements to ensure compliance with quality standards, reduce production cycle time, increase capacity, reduce rejects and manage variability. The goal of PAT is enable process understanding to thereby control variability in the process. Some of the tools proposed under PAT include the use of at-line process analyzers and measurement systems, process control tools, multivariate tools for design and analysis, simulations and other tools that are capable of multivariate analysis and rigorous statistics [28]. With the increased use of continuous manufacturing processes, PAT is also needed to continuously monitor changes in critical quality attributes (CQA) [29]. Other recognized advantages of PAT include faster process optimization, reduced cycle times and FTE resource requirements due to the reduced need for offline sampling, increased process control and therefore increased quality.
Process optimization Process SPC monitoring/ 6-sigma
improvement Quality by design
PCA/PLS Information Filtering
Raw data processing Process model
State estimation
Process & Advanced prod. quality Model-based
Process variable adjustments control Base regulatory
Figure 2-3: An idealized configuration of processing with the application of PAT [30]. Reprinted by permission from CRC Press: PAT applied in biopharmaceutical process development and manufacturing: an enabling tool for quality-by design, Strategic vision for integrated process analytical technology and advanced control in biologics manufacturing, C. Undey, D. Low, J.C. Menezes, M. Koch. 2012.
As shown in Figure 2-3, Undey et al. [30] view PAT as integrating into biopharmaceutical PD in its collection of data in real time and timely optimization of the process to achieve desired product specifications. Simon et al.
131]
reviewed existing applications of PAT in the industry, most notably in bioreactor monitoring, in focusing the realm on PD. Cramer & Holstein [32] also present principal component analysis tools for the prediction of protein A chromatography. While PAT applications continue to grow for PD, there is also a growing need for sufficient training among scientists for PAT techniques but also increasing potential for large data sets to be processed and analysed within the same or shorter period of time, with the help of software and in silico runs. This emphasizes the need for sufficient automation and capacity support for analytics in PD.2.3.2 QbD (Quality by Design)
In 2005, the FDA also introduced Quality by Design (QbD) guidelines under the International Conference on Harmonization (ICH) as a means of designing quality into the manufacturing process of a drug. As defined by the FDA, QbD refers to "a systematic approach to development that begins with predefined objectives and emphasizes product and process understanding and process control, based on sound science and quality risk management [33]." Adoption of QbD would require more statistical rigor and appropriate risk-taking [34]. Under QbD, the Quality Target Product Profile (QTPP) and critical quality attributes (CQA) are first defined, comprising of the quality characteristics of a drug product that must be achieved, considering safety and efficacy [33]. The design space, which is a collection of DOEs to test the
interaction of critical process parameters (CPPs) and their effects on CQAs, is then defined, together with a control strategy and risk assessment that will ensure that the design space is met. Process validation and filing are then performed, followed by continuous monitoring of process robustness. The wider operating ranges contrast with the traditional process of finalizing a process within very tight operating ranges and ensuring that products are only manufactured within those ranges. The goal under QbD is to be able to develop a manufacturing process that produces the targeted product quality consistently.
As illustrated in Figure 2-4, QbD has a significant impact on Process Development, influencing the targets set within PD and the control strategy to ensure that the product meets the design space. In the 4 2nd Annual Meeting for the Drug Information Association (DIA), Amgen
highlighted QbD as the "umbrella over the connection between Process Development, Process Characterization and Process Validation [35]." In this presentation, QbD was also described as an application of Juran's principles for quality control, which are often used in conjunction with six sigma and lean practices. There are, however, limited studies that explore process improvements within PD performed in conjunction with QbD practices and tools.
Prcdlom
- QbO Wecydle
I
F oundatl %Wetools ct r Knowlede management
d*i sumn nd managenM con'o P,"*"
~~ ~
proems anatycal technoloyWW sffWdesign ad analso Pb
Figure 2-4: Quality by Design milestones [36]. Reprinted by permission from Elsevier: Trends in
Biotechnology, Quality by design (QbD)-Lbsed process development for purification of a biotherapeutic, A.
Rathore.
@
2016.Significant benefits from QbD have been estimated by past studies. Rathore [36] compared a QbD-based biosimilar (granulocyte colony-stimulating factor or GCSF) downstream purification process with the traditional process. The QbD-based process produced a larger operating range, enhanced process robustness, higher overall yield, a 3X reduction in process cycle time and 1OX
improvement in productivity. A previous study conducted within Amgen [37] identified several potential throughput improvements that could be gained within Process Development as a result of QbD practices and corresponding management support. In one of the Amgen business cases examined for PD, a potential 80% reduction in cycle development time was identified per lyophilized stock-keeping unit (SKU).
The emphasis on creating a design space, control strategy and risk assessment by leveraging multiple data points, prior knowledge and design of experiments strengthened not only the need for PAT but also high throughput process development (HTPD) platforms that would enable the testing and analysis of multiple CPPs especially in a resource-constrained organization [38]. As more parameters are tested to define an operating range, more PD capacity will be needed for these DOEs. HTT is therefore viewed as a critical enabler for reaping the benefits of QbD.
2.4 Lean Principles in Drug Process Development
2.4.1 Measuring R&D ProductivitySince R&D processes do not produce an exact or standard product, several studies have attempted define R&D productivity in a more quantitative and objective manner. Shimura et al. [391 define R&D productivity as a function of both efficiency and effectiveness, where efficiency measures the cost efficiency of developing a new molecular entity (NME) and effectiveness is the average value generated by the NME. In their 2014 study, scores were assigned to various biopharmaceutical companies for both efficiency and effectiveness. High numerical scores in efficiency translated into high efficiency while low numerical scores translated into high effectiveness. A data envelopment analysis (DEA) model (a method of gauging distance from the efficient frontier) is then used to translate the distance between efficiency and effectiveness scores into productivity. A highly productive company would therefore have a shorter triangular distance or low DEA score. Although there were limitations to the study, especially in the predictability of a drug's marketability, the study showed Amgen as having a relatively high productivity score compared to its peers. There are opportunities to improve productivity by both increasing the number of NMEs explored, thereby requiring more efficient processes and development, and maximizing NME value through speed-to-market.
Low efficiency MOMmy High efficiency 0300 OM fe 04" o, In s iinn 04N0 F -: d y r pm tas. n
r JhW ya sJraf may T pus,
prodctiitymap Viualzaton f inusty satu, H. Simua, . asH.im ur. 42g 4
Fgr2-AnatrtieapahtodfngR& productivity mpfrbohmcetalopnies 2014 [3a Rerntdn by perittsso
Law, which is summarized in Equation 2-1. Paul et al. [1] adapted this and defined productivity as "the medical and commercial value created by a new medicine and the investments required to
generate that medicine." The translation of this concept into R&D throughput as it relates to process cycle times, the actual number of programs in the pipeline, the potential value of the drugs, the likelihood of failure and the costs of development, are summarized in Equation 2-2.
L =XW
Equation 2-1: Little's Law as presented by Little & Graves [16]. L refers to the average items in a queue or system,
X
arrival rate of items per unit of time, and W the average waiting time in the system.WIP x p(TS) x V
P =0
CTx C
Equation 2-2: R&D Productivity Equation as proposed by Paul, et al. [1]. R&D productivity (P) is a function of work in process (WIP), the probability of a program's technical success (p(TS)), the market value of the program if successful (V), the cycle time (CT) and program
![Figure 2-1: Fed-batch versus perfusion processes [24]. It should be noted that both fed-batch and perfusion processes start with an expansion of cells prior to bioreactor processing.](https://thumb-eu.123doks.com/thumbv2/123doknet/14126517.468439/30.917.121.782.129.336/figure-perfusion-processes-perfusion-processes-expansion-bioreactor-processing.webp)

![Figure 2-4: Quality by Design milestones [36]. Reprinted by permission from Elsevier: Trends in Biotechnology, Quality by design (QbD)-Lbsed process development for purification of a biotherapeutic, A.](https://thumb-eu.123doks.com/thumbv2/123doknet/14126517.468439/33.917.288.615.616.876/milestones-reprinted-permission-elsevier-biotechnology-development-purification-biotherapeutic.webp)
![Figure 2-7: Conceptual FTE resource and cycle time benefits of high throughput technology Aside from parallelism, other forms of HTT also enable high-volume processing whether through miniaturization or simple automation [38], c](https://thumb-eu.123doks.com/thumbv2/123doknet/14126517.468439/41.917.164.741.683.908/conceptual-resource-throughput-technology-parallelism-processing-miniaturization-automation.webp)
![Figure 2-8: History of high throughput screening (HTS) in Pfizer [51]. Reprinted by permission from John Wiley and Sons: British Journal of Pharmacology, Origin and evolution ofhigh throughput screening, D.A.](https://thumb-eu.123doks.com/thumbv2/123doknet/14126517.468439/42.917.143.775.266.652/throughput-screening-reprinted-permission-pharmacology-evolution-throughput-screening.webp)
![Figure 2-9: Correlation between experimental design and analytical effort [52]](https://thumb-eu.123doks.com/thumbv2/123doknet/14126517.468439/43.917.198.686.206.409/figure-correlation-experimental-design-analytical-effort.webp)
![Figure 2-10: Tornado diagram detailing the influence of various factors on an NPD's value [17]](https://thumb-eu.123doks.com/thumbv2/123doknet/14126517.468439/47.917.230.670.123.377/figure-tornado-diagram-detailing-influence-various-factors-value.webp)
