HAL Id: hal-03013134
https://hal.uca.fr/hal-03013134
Submitted on 22 Mar 2021
HAL is a multi-disciplinary open access
archive for the deposit and dissemination of sci-entific research documents, whether they are pub-lished or not. The documents may come from teaching and research institutions in France or abroad, or from public or private research centers.
L’archive ouverte pluridisciplinaire HAL, est destinée au dépôt et à la diffusion de documents scientifiques de niveau recherche, publiés ou non, émanant des établissements d’enseignement et de recherche français ou étrangers, des laboratoires publics ou privés.
Trends in the prevalence of overweight, obesity and
underweight in French children, aged 4–12 years, from
2013 to 2017
Jeremy Vanhelst, Jean-Benoît Baudelet, David Thivel, Hervé Ovigneur,
Thibault Deschamps
To cite this version:
Jeremy Vanhelst, Jean-Benoît Baudelet, David Thivel, Hervé Ovigneur, Thibault Deschamps. Trends in the prevalence of overweight, obesity and underweight in French children, aged 4–12 years, from 2013 to 2017. Public Health Nutrition, 2020, Public Health Nutrition, 23 (14), pp.2478-2484. �10.1017/S1368980020000476�. �hal-03013134�
1
Title: Trends in prevalence of overweight, obesity and underweight in French children, age 4-12 1
years, from 2013 to 2017 2
3
Jérémy Vanhelst1, Jean-Benoît Baudelet2, David Thivel3, Hervé Ovigneur4, Thibault Deschamps4 4
5 6
2 ABSTRACT 7
8
Objective: To assess the prevalence of underweight, overweight and obesity in French children 9
from 2013 to 2017. 10
Design: Cross-sectional study performed in fourteen regions of France. Physical measures included 11
weight, height and Body Mass Index (BMI). Underweight, overweight and obesity were defined 12
according to age- and sex-specific BMI cut-off points from the International Obesity Task Force. 13
Setting: France. 14
Subjects: Children (10 159 boys, 9 757 girls) from the voluntary, non-representative Diagnoform 15
program between 2013 and 2017, at the age of 4 to 12 years. 16
Results: The prevalence of overweight and obesity were higher in girls compared to boys 17
(P<0.001). Underweight was also more prevalent in girls (P<0.05). Although there were no 18
significant changes in the prevalence of obesity in boys or girls from 2013 to 2017, a significant 19
decrease in overweight among boys and girls was found (P<0.001) during the same time period. In 20
contrast, prevalence of underweight increased in girls and boys (from 10.0 to 20.0%; P <0·0001) 21
between 2013 and 2017. 22
Conclusions: Results of this study show that the prevalence of obesity was stable, while the 23
prevalence of overweight decreased significantly, despite high in French children. Findings suggest 24
also that thinness is becoming becomes an important phenomenon in children. Developing 25
preventive and nutritional programs in order to modify the lifestyle might help to control 26
underweight and obesity in children. 27
3 Introduction
28
Overweight and obesity are pathologies marked by an increase in body fat as a consequence of a 29
positive energy balance, when the energy intake exceeds energy expenditure over a prolonged 30
period. Obesity in children is considered the main childhood health problem in European countries. 31
In 2010, based on International Obesity Task Force (IOTF) definitions and the World Health 32
Organization’s Childhood Obesity Surveillance Initiative, the authors estimated that about 25% of 33
European children (aged 6 to 9 years) were overweight or obese(1). A recent systematic review and 34
meta-analysis observed a high prevalence of childhood overweight and obesity with a trend for 35
stabilization in most European countries(2). Paediatric obesity and related consequences on physical, 36
social and psychological parameters have been widely demonstrated(3). In addition, the persistence 37
of paediatric obesity into adulthood can lead to increased morbidity from type 2 diabetes, cardio-38
vascular diseases and cancer, and increased early mortality(4). While the prevalence of overweight 39
and obesity has been studied broadly, data on the prevalence of underweight are scarce and limited. 40
Nevertheless, some studies suggested that the prevalence of underweight tends to increase in 41
developed countries(5-7). Underweight in children is also linked to many serious physical, 42
psychological and social consequences on health from childhood to adulthood(8,9). 43
Monitoring weight status in children across different countries is essential and may help to identify 44
the target population for primary prevention and be helpful for health promotion policies. To date, 45
tracking of children about their weight status (underweight, overweight and obesity) in France has 46
been inconsistent and data are missing since 2010(1,2). 47
The purpose of the present study was first to measure the prevalence of underweight, overweight 48
and obesity in French children from 2013 to 2017 and to compare the results with findings prior to 49
2013. 50
Methods 51
This ancillary study used data from the French health program “Diagnoform®” (https://irfo.fr/). The 52
principal objective of this program was to assess the physical fitness of a large, voluntary, non-53
representative sample of the French population aged from 5 years to 60 years and older. This 54
program is divided into four categories: (i) DiagnoKid for children aged 4–10 years; (ii) 55
DiagnoTonic for adolescents and young adults aged 10–25 years; (iii) DiagnoActif for adults aged 56
25–60 years; and (iv) DiagnoHealth for people aged 60 years and older. The program was 57
performed in large settings throughout France, such as school playgrounds or sports club 58
gymnasiums. 59
4
All procedures were performed in accordance with the 1975 Helsinki Declaration as revised in 2008 60
and European Good Clinical Practices. As the research did not involve an intervention and the data 61
were collected retrospectively using the organizational structure of the study (Institut des 62
Rencontres de la Forme; https://irfo.fr/), this study was considered an epidemiological study. In this 63
context, written informed consent was not required according to French human research regulations. 64
All data obtained from the organizer (results of physical fitness tests and anthropometrics data) of 65
the event were anonymous, declared and approved by the French National Commission of the 66
Informatics Personal Data (Commission Nationale de l’Informatique et des Libertés, CNIL). The 67
aims and objectives of the Diagnoform programme were explained carefully to each child and to 68
their parents. After this explanation, the children and parents could accept or decline to participate 69
in this event and to record their information technology data anonymously. The data were recorded 70
into an electronic data system by the organizer. For the present study, the data analyses were 71
performed using only the children’s data. 72
Many schools in France were invited to participate in the study, with each school director deciding 73
whether to participate or not. From the 356 schools invited, 309 have accepted to participate the 74
Diagnoform program (i.e 85% of positive response rate). When director accepted the invitation, all 75
students were invited to participate. However, due to sick or absent children on the day of the 76
assessment, 11% of students (3 534) could not participated. Each year, a different group of students 77
was measured. In addition, data were collected from 14 of the 22 regions of France (i.e 64%). From 78
the Diagnoform program performed between 2010 and 2018 with an age range from 4 to 17 years, 79
32 132 (16 378 boys and 15 754 girls) volunteered to participate. Because of the small sample size 80
of participants aged 13–17 years compared with other age–sex classes and the data obtained from 81
2010 to 2012 and 2018, we restricted the analysis to 19 916 (10 159 boys and 9 757 girls) children 82
and adolescents aged 4–12 years. 83
Measurements
84
Anthropometric measures
85
Body weight was measured to the nearest 0.1 kg using an electronic scale with the participant 86
wearing light clothes and without shoes. Height was measured without shoes to the nearest 0.1 cm 87
using a standard physician’s scale. Body mass index (BMI) was calculated as weight/height squared 88
(kg/m2). Nutritional status was assessed using the IOTF scale(10). 89
5
Statistical analysis
90
The data are presented as percentages for categorical variables and as means and standard 91
deviations for continuous variables. The normality of the distribution was checked graphically using 92
the Shapiro–Wilk test. 93
Comparisons of underweight, overweight and obesity between boys and girls were assessed by the 94
χ2 test. Changes in underweight, overweight and obesity from 2013 to 2017 were assessed using the 95
Cochran–Armitage trend test. 96
All statistical tests were performed at the two-tailed α level of 0·05. Data were analysed using the 97
statistical software packages IBM SPSS Statistics for Windows (Version 22.0; IBM SPSS, Armonk, 98
NY, USA) R Project for Statistical Computing (v. 3.6.1) and Excel 2013 (Microsoft, Redmond, 99
WA, USA). 100
Results 101
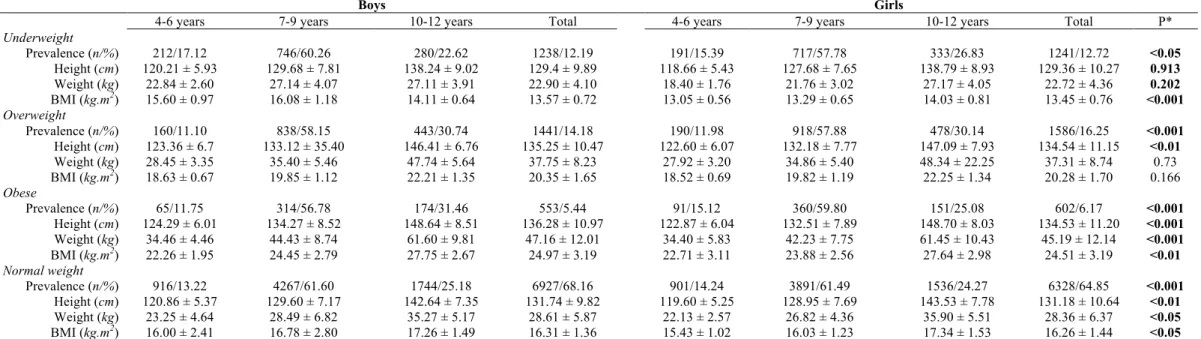
The mean age for boys and for girls was 8.7 ± 1.6 and 8.6 ± 1.6 years, respectively. Mean height, 102
weight, BMI and prevalence rates of underweight, overweight and obesity by sex and age group are 103
presented in Table 1. Overweight and obesity were significantly greater in girls compared with boys 104
(P<0.001) (Table 1). The prevalence of underweight was also higher in girls than boys (P<0.01). 105
The prevalence rates from 2013 to 2017 for boys and girls combined and by sex are presented in 106
Table 2 and Figure 1. No significant changes in obese was found for boys and girls, respectively 107
(P>0.05) (Table 2). The proportion of overweight was lower in 2017 than in 2013 among boys and 108
girls (P<0.01) (Table 2). Conversely, the prevalence of underweight increased in girls and boys 109
(from 10.0 to 20.0%, P<0.0001) between 2013 and 2017. 110
Discussion 111
Many countries have developed public health initiatives and policies to prevent and treat unhealthy 112
weight issues in children. Therefore, monitoring underweight, overweight and obesity in youth is 113
essential for accurate tracking and to evaluate the effectiveness of these public health 114
recommendations and intervention programs. However, data on tracking in childhood are scarce, 115
limited and missing among French children and adolescents since 2010(2). 116
Using the IOTF criteria, the results of our present study suggest that the prevalence of overweight 117
changed significantly, showing a decrease between 2013 and 2017 (17.3 to 13.4%). During the 118
same period, the obesity prevalence also decreased by 38%, from 6.1% to 3.8%, although not 119
significantly. These findings concur with the results from a recent meta-analysis performed from 120
1999 to 2016 in European children(2). The researchers reported that in some European countries 121
6
during the last two decades, the growing overweight and obesity prevalence trend had reached a 122
plateau or sometimes showed a slight decline(2). A similar observation was also observed at the 123
international level, especially in high-income countries(11). Even though our data show encouraging 124
results, the proportion remains high. Current national public health initiatives in children must be 125
maintained and strengthened in the future. 126
Another outcome from our study is the difference between boys and girls found in the prevalence of 127
overweight and obesity. The prevalence rates of overweight and obesity were significantly higher in 128
girls compared with boys; however, the sex differences were small (14.5% vs 16.4% for overweight 129
boys and girls; 5.2% vs 5.8% for obese boys and girls). This finding is also consistent with previous 130
results from other studies(2,11,12). 131
Although the data on overweight and obesity prevalence from this survey are encouraging, another 132
major concern was highlighted. Our results show the alarming progression of underweight between 133
2013 and 2017 among both boys and girls. The prevalence of underweight has effectively doubled 134
in five years (10.0% vs 20.7% and 10.5% vs 20.5% for boys and girls, respectively). Previous 135
studies have highlighted the maturing of this phenomenon and underlined the need for further 136
attention(5,6,13). Since underweight is also associated with adverse health consequences (physical, 137
psychological and social) throughout the life course, there is an urgent need to develop strategies to 138
reduce this growing prevalence. In addition, when monitoring overweight and obesity is performed, 139
we recommend also systematically assessing the rate of underweight prevalence. 140
The current study has strengths and limitations. One of the first strengths of the study was the large 141
sample size of children with age- and gender-specific information across France. The use of 142
standardized procedures to assess anthropometric measures was another strength. Although the 143
present data derive from a large sample belonging to 65% of the administrative French regions, this 144
study did not use a stratified sample design. Therefore, it is not possible to assume that the studied 145
cohort is fully representative of the child population in France. In addition, our results showing 146
increasing underweight and decreasing overweight must be used with caution because we cannot 147
exclude whether there is a general shifting of the bell curve (or spreading out) or just a difference in 148
our sample between the measurement date (2013 to 2017). Indeed, due to the voluntary programme, 149
the number of participants across the years studied differs dramatically and may affect our results. 150
Another potential weakness is the lack of socio-economic information that were not collected, 151
which could have impacted our findings. A socio-economic gradient in overweight and obesity was 152
effectively reported in most partly developed countries, with a higher prevalence of overweight and 153
obesity being observed in more-disadvantaged groups(14-15). Consequently, we recommend studies 154
that incorporate random subject selection and to assess socio-economic status. 155
7
In summary, the data from our study suggest a quite stable prevalence of obesity with a declining 156
prevalence of overweight despite remaining high in French children between 2013 and 2017. Our 157
results also indicate that underweight increased significantly in both sexes. This concern becomes 158
an important phenomenon in children and warrant careful monitoring in coming years. Based on the 159
study results, the authors support the public health policies currently being developed and also 160
encourage the development of new strategies to prevent and treat underweight issues. 161
8 References
162
1. Wijnhoven TM, van Raaij JM, Spinelli A et al. (2013) WHO European Childhood Obesity 163
Surveillance Initiative 2008: weight, height and body mass index in 6-9-year-old children. Pediatr 164
Obes 8, 79-97.
165
2. Garrido-Miguel M, Cavero-Redondo I, Álvarez-Bueno C et al. (2019) Prevalence and Trends of 166
Overweight and Obesity in European Children From 1999 to 2016: A Systematic Review and Meta-167
analysis. JAMA Pediatr e192430. 168
3. Hruby A, Manson JE, Qi L et al. (2016) Determinants and Consequences of Obesity. Am J 169
Public Health 106, 1656-1662.
170
4. Llewellyn A, Simmonds M, Owen CG et al. (2016) Childhood obesity as a predictor of 171
morbidity in adulthood: a systematic review and meta-analysis. Obes Rev 17, 56-67. 172
5. Vanhelst J, Baudelet JB, Fardy PS et al. (2017) Prevalence of overweight, obesity, underweight 173
and normal weight in French youth from 2009 to 2013. Public Health Nutr 20, 959-964. 174
6. Martin K, Rosenberg M, Pratt IS et al. (2014) Prevalence of overweight, obesity and underweight 175
in Western Australian school-aged children; 2008 compared with 2003. Public Health Nutr 17, 176
2687-2691. 177
7. Martínez-Vizcaíno V, Sánchez López M, Moya Martínez P et al. (2009) Trends in excess weight 178
and thinness among Spanish schoolchildren in the period 1992-2004: the Cuenca study. Public 179
Health Nutr 12, 1015-1018.
180
8. Flegal KM, Graubard BI, Williamson DF et al. (2007) Cause-specific excess deaths associated 181
with underweight, overweight, and obesity. JAMA 298, 2028-2037. 182
9. Sato H, Nakamura N, Sasaki N. (2008) Effects of bodyweight on health-related quality of life in 183
school-aged children and adolescents. Pediatr Int 50, 552-556. 184
10. Cole TJ, Bellizzi MC, Flegal KM et al. (2000) Establishing a standard definition for child 185
overweight and obesity worldwide: international survey. BMJ 320:1240-1243. 186
11. NCD Risk Factor Collaboration (NCD-RisC). (2017) Worldwide trends in body-mass index, 187
underweight, overweight, and obesity from 1975 to 2016: a pooled analysis of 2416 population-188
9
based measurement studies in 128·9 million children, adolescents, and adults. Lancet 390, 2627-189
2642. 190
12. Rokholm B, Baker JL, Sørensen TI. (2010) The levelling off of the obesity epidemic since the 191
year 1999--a review of evidence and perspectives. Obes Rev 11, 835-846. 192
13. Lazzeri G, Rossi S, Kelly C et al. (2014) Trends in thinness prevalence among adolescents in 193
ten European countries and the USA (1998-2006): a cross-sectional survey. Public Health Nutr 17, 194
2207-2215. 195
14. Péneau S, Salanave B, Maillard-Teyssier L et al. (2009) Prevalence of overweight in 6- to 15-196
year-old children in central/western France from 1996 to 2006: trends toward stabilization. Int J 197
Obes 33, 401-407.
198
15. Devaux M, Sassi F. (2013) Social inequalities in obesity and overweight in 11 OECD countries. 199
Eur J Public Health 23, 464-469.
200 201 202
10 203
* The χ2 was performed to assess differences in prevalence rates by sex; Student’s t test was performed to assess differences in anthropometric data by sex. Significant P values are
204
indicated in bold font.
205
Percentages are row percentages for prevalence rates by age group; percentages are column percentages for total prevalence rates by sex.
206
Table 1. Prevalence rates of underweight, overweight and obesity, and mean anthropometric characteristics with standard deviations in French boys and girls, age 4-12 years, during the period 2013-2017 (n = 19916)
Boys Girls
4-6 years 7-9 years 10-12 years Total 4-6 years 7-9 years 10-12 years Total P* Underweight Prevalence (n/%) 212/17.12 746/60.26 280/22.62 1238/12.19 191/15.39 717/57.78 333/26.83 1241/12.72 <0.05 Height (cm) 120.21 ± 5.93 129.68 ± 7.81 138.24 ± 9.02 129.4 ± 9.89 118.66 ± 5.43 127.68 ± 7.65 138.79 ± 8.93 129.36 ± 10.27 0.913 Weight (kg) 22.84 ± 2.60 27.14 ± 4.07 27.11 ± 3.91 22.90 ± 4.10 18.40 ± 1.76 21.76 ± 3.02 27.17 ± 4.05 22.72 ± 4.36 0.202 BMI (kg.m2) 15.60 ± 0.97 16.08 ± 1.18 14.11 ± 0.64 13.57 ± 0.72 13.05 ± 0.56 13.29 ± 0.65 14.03 ± 0.81 13.45 ± 0.76 <0.001 Overweight Prevalence (n/%) 160/11.10 838/58.15 443/30.74 1441/14.18 190/11.98 918/57.88 478/30.14 1586/16.25 <0.001 Height (cm) 123.36 ± 6.7 133.12 ± 35.40 146.41 ± 6.76 135.25 ± 10.47 122.60 ± 6.07 132.18 ± 7.77 147.09 ± 7.93 134.54 ± 11.15 <0.01 Weight (kg) 28.45 ± 3.35 35.40 ± 5.46 47.74 ± 5.64 37.75 ± 8.23 27.92 ± 3.20 34.86 ± 5.40 48.34 ± 22.25 37.31 ± 8.74 0.73 BMI (kg.m2) 18.63 ± 0.67 19.85 ± 1.12 22.21 ± 1.35 20.35 ± 1.65 18.52 ± 0.69 19.82 ± 1.19 22.25 ± 1.34 20.28 ± 1.70 0.166 Obese Prevalence (n/%) 65/11.75 314/56.78 174/31.46 553/5.44 91/15.12 360/59.80 151/25.08 602/6.17 <0.001 Height (cm) 124.29 ± 6.01 134.27 ± 8.52 148.64 ± 8.51 136.28 ± 10.97 122.87 ± 6.04 132.51 ± 7.89 148.70 ± 8.03 134.53 ± 11.20 <0.001 Weight (kg) 34.46 ± 4.46 44.43 ± 8.74 61.60 ± 9.81 47.16 ± 12.01 34.40 ± 5.83 42.23 ± 7.75 61.45 ± 10.43 45.19 ± 12.14 <0.001 BMI (kg.m2) 22.26 ± 1.95 24.45 ± 2.79 27.75 ± 2.67 24.97 ± 3.19 22.71 ± 3.11 23.88 ± 2.56 27.64 ± 2.98 24.51 ± 3.19 <0.01 Normal weight Prevalence (n/%) 916/13.22 4267/61.60 1744/25.18 6927/68.16 901/14.24 3891/61.49 1536/24.27 6328/64.85 <0.001 Height (cm) 120.86 ± 5.37 129.60 ± 7.17 142.64 ± 7.35 131.74 ± 9.82 119.60 ± 5.25 128.95 ± 7.69 143.53 ± 7.78 131.18 ± 10.64 <0.01 Weight (kg) 23.25 ± 4.64 28.49 ± 6.82 35.27 ± 5.17 28.61 ± 5.87 22.13 ± 2.57 26.82 ± 4.36 35.90 ± 5.51 28.36 ± 6.37 <0.05 BMI (kg.m2) 16.00 ± 2.41 16.78 ± 2.80 17.26 ± 1.49 16.31 ± 1.36 15.43 ± 1.02 16.03 ± 1.23 17.34 ± 1.53 16.26 ± 1.44 <0.05
11
Table 2. Overall and sex-specific number, proportions (%) children, age 4-12 years, classified as underweight, healthy weight, overweight and obese in 2013 and 2017 from the Diagnoform
program. 2013 (n 7211) 2014 (n 3540) 2015 (n 2937) 2016 (n 4256) 2017 (n 1972) n % n % n % n % n % P for trend* 4-6 years Underweight Overall 69 13.64 39 13.36 52 15.62 226 15.86 17 10 0.5294 Boys 38 15.32 15 10.07 32 19.28 117 16.39 10 13.16 0.4994 Girls 31 12.02 24 16.78 20 11.98 109 15.33 7 7.45 0.8283 Healthy weight Overall 344 67.98 195 66.78 230 69.07 931 65.33 117 68.82 0.4148 Boys 167 67.34 99 66.44 113 68.07 481 67.37 56 73.68 0.6266 Girls 177 68.60 96 67.13 117 70.06 450 63.29 61 64.89 0.1108 Overweight Overall 66 13.04 43 14.73 39 11.71 176 12.35 26 15.29 0.7809 Boys 34 13.71 27 18.12 18 10.84 73 10.22 8 10.53 0.0307 Girls 32 12.40 16 11.19 21 12.57 103 14.49 18 19.15 0.1111 Obese Overall 27 5.34 15 5.14 12 3.60 92 6.46 10 5.88 0.2731 Boys 9 3.63 8 5.37 3 1.81 43 6.02 2 2.63 0.2931 Girls 18 6.98 7 4.90 9 5.39 49 6.89 8 8.51 0.5933 7-9 years Underweight Overall 456 10.46 215 9.40 283 13.97 315 14.51 194 16.10 <0.0001 Boys 238 10.92 109 9.11 146 14.05 144 12.70 109 17.67 <0.0001 Girls 218 9.99 106 9.71 137 13.88 171 16.49 85 14.46 <0.0001 Healthy weight Overall 2910 66.73 1588 69.41 1405 69.35 1447 66.65 808 67.05 0.9297 Boys 1483 68.06 838 70.07 734 70.64 803 70.81 409 66.29 0.66 Girls 1427 65.40 750 68.68 671 67.98 644 62.10 399 67.86 0.7065 Overweight Overall 719 16.49 353 15.43 259 12.78 274 12.62 151 12.53 <0.0001 Boys 339 15.56 174 14.55 118 11.36 133 11.73 74 11.99 <0.001 Girls 380 17.42 179 16.39 141 14.29 141 13.60 77 13.10 <0.001 Obese Overall 276 6.33 132 5.77 79 3.90 135 6.22 52 4.32 0.0153 Boys 119 5.46 75 6.27 41 3.95 54 4.76 25 4.05 0.0510 Girls 157 7.20 57 5.22 38 3.85 81 7.81 27 4.59 0.1466 10-12 years Underweight Overall 227 9.68 102 10.63 76 13.15 58 8.79 150 25.13 <0.0001 Boys 112 8.99 43 8.74 30 11.11 25 7.42 70 23.65 <0.0001 Girls 115 10.47 59 12.61 46 14.94 33 10.22 80 26.58 <0.0001 Healthy weight Overall 1519 64.80 612 63.75 377 65.22 430 65.15 342 57.29 0.0209
12 Boys 825 66.21 328 66.67 181 67.04 236 70.03 174 58.78 0.2866 Girls 694 63.21 284 60.68 196 63.64 194 60.06 168 55.81 0.0387 Overweight Overall 442 18.86 181 18.85 92 15.92 121 18.33 85 14.24 0.0170 Boys 231 18.54 89 18.09 37 13.70 44 13.06 42 14.19 0.0044 Girls 211 19.22 92 19.66 55 17.86 77 23.84 43 14.29 0.5122 Obese Overall 156 6.66 65 6.77 33 5.71 51 7.73 20 3.35 0.0661 Boys 78 6.26 32 6.50 22 8.15 32 9.50 10 3.38 09763 Girls 78 7.10 33 7.05 11 3.57 19 5.88 10 3.32 0.0088 Total Underweight Overall 752 10.43 356 10.06 411 13.99 599 14.07 361 18.31 <0.0001 Boys 388 10.56 167 9.09 208 14.10 286 13.09 189 19.11 <0.0001 Girls 364 10.29 189 11.10 203 13.89 313 15.11 172 17.50 <0.0001 Healthy weight Overall 4773 66.19 2395 67.66 2012 68.51 2808 65.98 1267 64.25 0.238 Boys 2475 67.38 1265 68.86 1028 69.69 1520 69.57 639 64.61 0.9895 Girls 2298 64.95 1130 66.35 984 67.31 1288 62.19 628 63.89 0.1031 Overweight Overall 1227 17.02 577 16.30 390 13.28 571 13.42 262 13.29 <0.0001 Boys 604 16.44 290 15.79 173 11.73 250 11.44 124 12.54 <0.0001 Girls 623 17.61 287 16.85 217 14.84 321 15.50 138 14.04 0.0012 Obese Overall 459 6.37 212 5.99 124 4.22 278 6.53 82 4.16 0.1507 Boys 206 5.61 115 6.26 66 4.47 129 5.90 37 3.74 0.2738 Girls 253 7.15 97 5.70 58 3.97 149 7.19 45 4.58 0.3395
*Cochran–Armitage trend test. Significant P values are indicated in bold font.
207 208
13 209
14 210