Immigration Policy and Macroeconomic
Performance in France
Université de Paris Ouest Nanterre La Défense (bâtiment G) 200, Avenue de la République 92001 NANTERRE CEDEX Tél et Fax : 33.(0)1.40.97.59.07
Document de Travail
Working Paper
2015-05
Hippolyte d’Albis
Ekrame Boubtane
Dramane Coulibaly
Immigration Policy and Macroeconomic
Performance in France
∗
Hippolyte d’ALBIS
†Paris School of Economics - University Paris 1
Ekrame BOUBTANE
CERDI, Universit´
e d’Auvergne
Dramane COULIBALY
EconomiX-CNRS, University of Paris Ouest
Abstract
This paper quantitatively assesses the interaction between per-manent immigration into France and France’s macroeconomic perfor-mance as seen through its GDP per capita and its unemployment rate. It takes advantage of a new database where immigration is measured by the flow of newly-issued long-term residence permits, categorized by both the nationality of the immigrant and the reason of permit issuance. Using a VAR model estimation of monthly data over the period 1994-2008, we find that immigration flow significantly responds to France’s macroeconomic performance: positively to the country’s GDP per capita and negatively to its unemployment rate. At the same time, we find that immigration itself increases France’s GDP per capita, particularly in the case of family immigration. This family immigration also reduces the country’s unemployment rate, especially when the families come from developing countries.
JEL classification: E20, F22, J61.
Keywords: Immigration, Female and Family Migration, Growth, Un-employment, VAR Models.
∗We thank the associate editor P. F`eve and an anonymous referee for their stimulating
critics and comments as well as M. Aleksynska, S. Bertoli, X. Chojnicki, C. Gorinas, A. Mountford and H. Rapoport for useful remarks. We thank X. Thierry for having made available the database. H. d’Albis acknowledges financial support from the European Research Council (ERC Stg Grant DU 283953).
†Corresponding author: Centre d’Economie de la Sorbonne, 106 boulevard de l’Hˆopital,
1
Introduction
The theoretical relationship between immigration and host country economic growth is generally ambiguous. Immigration, for instance, increases the pop-ulation of the destination country, which can potentially lead to “capital dilution” and consequently a temporary decline in GDP per capita - if the returns-to-scale of the country’s production are constant. On the other hand, it can lead to a “scale effect” and therefore a permanent increase in the eco-nomic growth rate if these returns-to-scale are increasing. Immigration may also increase the diversity of the population. The personal characteristics of immigrants such as age, level of human capital and assets may vary sig-nificantly from those of the resident population. The economic impact of such an increase in diversity would depend on the degree of complementarity between the characteristics of immigrants and residents in the production process.
Recognizing that most economic effects of immigration pass through the labor market, an assessment of immigration impact would often look at the extent to which immigrants can work in their destination country. The de-gree of geographical and occupational mobility of resident professionals and the mechanism of wage formation are also key parameters. Several micro-econometric studies have proposed evaluating these different mechanisms, but they have not been sufficient for assessing the overall impact of immi-gration.
The purpose of this study is to provide a quantitative assessment of the re-lationship between immigration to France and the country’s macroeconomic performance, without reverting to theoretical assumptions. As these vari-ables are likely to be themselves endogenous, we estimate a set of VAR models to circumvent this issue. Our empirical analysis utilizes a recently-available database on the flow of long-term residence permits for immigrants in France, coming from countries that are required to hold a residence per-mit in France. It covers the period from 1994 to 2008 - a period that saw large immigration flows of families, students and refugees1. This database has
been constructed by the Institut National d’´Etudes D´emographiques (INED) based on administrative data collected by the Ministry of the Interior. It is a very rich database, providing information on immigrant characteristics (age, sex, and nationality) as well as residence permit details (date of issue, period of validity, and administrative reason of issue). It tracks the monthly flows of these permits, giving sufficient time coverage and permitting the
analy-1For a description of the immigration policy in France for these years see, in particular,
sis of this paper without the need to construct a panel dataset of countries to see the interaction between immigration and a country’s macroeconomic performance. This paper marks the first time that this database is used for econometric work.
Taking advantage of this detailed and frequent data, a set of VAR mod-els are estimated, taking into account the composition of immigration flows by age, sex, country of origin and category of entry. To compute impulse response functions, we first consider the Choleski identification. We then check the robustness of our results using sign restrictions. More specifically, we compute the response of immigration variables to a “labor demand shock” that is driven by improvement in France’s general economic condition. We then implement sign restrictions so that the response to this labor demand shock is an increase in real GDP and a decrease in the unemployment rate.
Based on the impulse responses from the Choleski decomposition and sign restrictions, we find that all categories of immigration (further detailed in section 3) significantly respond to France’s macroeconomic conditions: positively to GDP per capita and negatively to the unemployment rate. This can be explained either by an immigration policy that tends to be more favorable during high growth periods or by a greater demand for permits during those periods. The issuance of permits for immigrant workers, a clear discretionary immigration policy, is influenced by economic conditions. Family immigration, over which government can exercise little discretionary control, also reacts to macroeconomic performance. Therefore, the demand effect cannot be eliminated. Overall, the empirical results indicate some pro-cyclicality between immigration and France’s macroeconomic performance.
At the same time, we find that immigration itself impacts these macroe-conomic indicators, emphasizing a feedback mechanism. Our results show that the immigration rate has a positive and significant effect on GDP per capita in France. These results are robust to controlling for the composition of these immigration flows. We also find, in particular, that the immigration rate of young immigrants (aged below 40 years old), as well as immigration from developing countries, have a noticeable positive and significant effect on France’s GDP per capita. Our results also indicate that both male and female immigration contribute to this positive effect. Family immigration appears to be at the origin of this positive effect on GDP, whereas labor immigration has no significant impact.
The response of the unemployment rate to immigration variables, on the other hand, are ambiguous. France’s unemployment rate does not signifi-cantly respond to aggregate immigration: it rises signifisignifi-cantly following an increase in labor immigration, but falls significantly following an increase in family immigration.
The remainder of this article is structured as follows: Section 2 presents the econometric methodology; Section 3 describes the data sets, especially the immigration database; Section 4 presents the empirical results; Section 5 discusses our econometric results and compares them to relevant findings in the literature; and finally, Section 6 concludes.
2
Econometric Methodology
Our analysis of the relationship between immigration and the macroeconomic situation is carried out using a VAR model with the following specification:
Yt= µ0+ µ1t + A1Yt−1+ ... + ApYt−p+ εt, (1)
where Yt = (y1t, ..., yKt)0 is a (K × 1) vector of endogenous variables observed
at time t, the Aj are fixed (K × K) coefficient matrices, µ0 = (µ01, ..., µ0K)
is a fixed (K × 1) vector of intercept terms, µ1 = (µ11, ..., µ1K) contains the
parameters of the deterministic trend, and εt = (ε1t, ..., εKt)0 is the (K × 1)
vector of residuals satisfying E(εtε0t) = Ω, ∀ t and E(εtε0s) = 0, ∀ t 6= s.
The purpose of the analysis is not to characterize a long-term relationship between the variables. Such a task would be difficult and unfeasible given the information of the dataset and the limited temporal coverage of the series used. To investigate the short-run dynamics, variables are considered in levels for the following reason. As explained in Sims et al. [1990], not taking the first-difference process allows us to avoid losing information contained in the data when a cointegration relationship exists between the variables2.
To conduct our analysis, several models (vectors Y ) are considered. The first model is a three dimensional VAR model with the following specification:
M odel 1 : Yt= [GDPt, Ut, Mt]0 (2)
where GDP denotes the logarithm of GDP per capita, U denotes the log-arithm of unemployment rate, and M is the loglog-arithm of immigration rate where immigration incorporates all permits issued, regardless of the admin-istrative reason for issuance.
The analysis can be improved by estimating three other VAR models in which total immigration is decomposed by age, country of origin and sex of the permit holders in Models 2, 3 and 4, respectively:
M odel 2 : Yt= [GDPt, Ut, Y Mt]0 (3) 2Preliminary tests implemented in Section 4 indicate that the series are non stationary
M odel 3 : Yt= [GDPt, Ut, M DEVt]0 (4)
M odel 4 : Yt = [GDPt, Ut, M Mt, F Mt]0 (5)
where Y M denotes the immigration rate of the young (those who are younger than 40 years), M DEV denotes the immigration rate of foreigners from developing countries, M M and F M are male and female immigration rates, respectively. All immigration rate variables are expressed in logarithm. Since most immigrants to France are young and come from developing coun-tries (see Section 3), Model 2 and Model 3 are used to check the robustness of the results from Model 1. Model 4 allows a comparison by gender.
As the immigration policy primarily concerns the purpose of stay, we decompose immigration by reasons for issuing residence permits (work vs family) in Model 5 given by
M odel 5 : Yt= [GDPt, Ut, M Wt, M Ft]0 (6)
where M W and M F are, in logarithms, the rates of immigration of work-ers and of families from all countries, respectively.
Finally, the analysis is further refined in Model 6 by considering work and family immigration from developing countries:
M odel 6 : Yt= [GDPt, Ut, M W DEVt, M F DEVt]0 (7)
where M W DEV and M F DEV are the immigration rate of workers and families from developing countries.
The choice of lag was made using AIC (Akaike information criterion) and BIC (Bayesian information criterion) tests and lead to selecting between one and three lags according to the specification.
To compute the structural impulse response, we first consider the Choleski decomposition. The corresponding structural VAR (SVAR) is given by the following specification:
B0Yt= ν0+ ν1t + B1Yt−1+ ... + BpYt−p+ ηt (8)
where B0 is a (K × K) matrix, ν0 = B0µ0, ν1 = B0µ1, Bj = B0Aj, and ηt=
B0εt is the structural shock with covariance matrix E(ηtη0t) = B0ΩB00 = IK
or Ω = W W0 with W = B0−1.
It follows that the moving average representation for the SVAR is: Yt= µ0+ µ1t + ∞ X j=0 Φjεt−j = µ0+ µ1t + ∞ X j=0 ψjηt−j (9)
Let S denotes the unique lower triangular Choleski factor of Ω, ie. Ω = SS0. The orthogonalized impulse responses based on Choleski decomposition are obtained by choosing B0 = S−1 or W = S. In this decomposition, series
listed earlier in the VAR order can impact the other variables contemporane-ously, while series listed later in the VAR order can affect those listed earlier only with lag.
Since the decision to issue a residence permit in month t is generally taken considering the economic conditions of the previous month(s), we first place the immigration variable in the Choleski decomposition as in Boubtane et al. [2013]. GDP per capita is placed in the ordering before unemployment rate. Therefore, we consider the following Choleski orderings in the different models: M odel 1 : (Mt, GDPt, Ut) M odel 2 : (Y Mt, GDPt, Ut) M odel 3 : (M DEVt, GDPt, Ut) M odel 4 : (M Mt, F Mt, GDPt, Ut) M odel 5 : (M Wt, M Ft, GDPt, Ut)
M odel 6 : (M W DEVt, M F DEVt, GDPt, Ut)
For Models 4, 5 and 6, it is difficult to give an ordering between differ-ent forms of immigration. In Model 4, male immigration is ranked first and the female immigration second for several reasons. If there is a contempo-raneous link between male and female immigration, this link must run from male immigration to female immigration, since men generally initiate family reunification of spouses and children, for the same family. Moreover, labor migrants are mainly men and family migrants tend to be predominantly fe-male (see Section 3). So, we place the immigration of workers before the immigration of families in Models 5 and 6. Changing this ordering does not alter the results of the interaction between the immigration variables and host country economic conditions.
To check the robustness of our results regarding the response of immi-gration to host country economic conditions, we also consider the sign re-strictions developed by Faust [1998], Canova and De Nicol´o [2002] and Uhlig [2005]3. The sign restrictions identification is based on the fact that the vector of structural shocks is not unique. In fact, any vector ηt = QS−1εt,
where Q is a rotation matrix QQ0 = Q0Q = IK, has a covariance matrix
equal to IK and is thus a candidate for structural shocks. Therefore, the sign
restrictions are made by selecting the matrices Q so that the correspond-ing impulse responses respect the qualitative restrictions involvcorrespond-ing the sign
of some shocks on some variables. To implement sign restrictions, we use Householder transformation based on the algorithm of Rubio-Ramirez et al. [2010].
Based on the sign restrictions, we compute the response of immigra-tion variables to a “labor demand shock” that is driven by improvements in France’s macroeconomic conditions. We implement sign restrictions so that in response to this labor demand shock, real GDP per capita should in-crease and unemployment rate should dein-crease. We impose the restrictions for a duration of one year (12 periods) after the shock. Changing the horizon at which the sign restrictions are imposed does not significantly alter our results.
3
Data Description
Three types of variables for which we have the time series are used: GDP per capita, the unemployment rate, and the immigration rate. The latter is, for some estimations, broken down by age, gender, nationality and admission reasons. The monthly data sets used cover the period 1994-2008 and are seasonally adjusted4. They concern metropolitan France.
GDP is calculated by converting the quarterly series of real GDP pro-vided by the Institut National de la Statistique et des ´Etudes ´Economiques (INSEE) into monthly data (Denton [1971]), utilizing the monthly indica-tor of industrial production that is available on the Organization for Eco-nomic Co-operation and Development’s (OECD) Main EcoEco-nomic Indicators database. GDP per capita is then calculated using the INSEE’s population series, which determines the size of the population in France on the first day of each month. Monthly unemployment rates, on the other hand, are extracted from the OECD Labor Force Statistics database.
Immigration flows into France are calculated by INED from the AGDREF administrative database of the Ministry of Interior, which gathers informa-tion on residence permit applicants5. These database statistics include the
starting date of the first long-term residence permit issued to an adult for-eigner, valid for at least one year. The starting date of the permit’s validity is usually after the arrival of the immigrant in France. This may be due to the permit issue process, but also potentially accounting for the fact that an immigrant may have previously received a permit of less than one year or may have resided illegally in France prior to his/her long-term residence
per-4The papers that use monthly immigration data are Hanson and Spilimbergo [1999],
Orrenius and Zavodny [2003] and Bertoli et al. [2013].
mit. In either case, the date of issue provides valuable information because it shows the date that an immigrant begins a long-term immigration status and, in some cases, acquires new labor market rights in France6. Finally,
im-migration rates are obtained by dividing the monthly entries by the number of inhabitants in France on the first of each month.
In this study, only those permits issued to citizens of a certain number of countries are included. In the basic version of the estimates, we include all countries except for the EU15 and the European Economic Area (i.e. Iceland, Switzerland, Liechtenstein, and Norway). Excluding these countries is justified by the fact that since November 20, 2003, residence permits are no longer required for their nationals settling in France. We also choose to retain the permits issued to nationals of Estonia, Latvia, Lithuania, Hungary, Czech Republic, Poland, and Slovenia, although they were no longer obliged to hold a permit from July 1, 2008. It should also be noted that since 2009 the process of issuing residence permits has been modified, with the introduction of new types of visas that are equivalent to residence permits but issued by French consulates abroad. The date of issue shown on these visas may be prior to arrival in the country - hence we end the study period for this paper in 2008.
A breakdown of the flow of residence permits based on the nationality of the recipients reveals that the majority of permits are issued to nationals of African countries, and a quarter is issued to nationals of Asian countries. To test the robustness of our results, we decompose the permits issued by the average standard of living in the immigrant’s country of origin. From these living standards, we create a database of permits issued to nationals of developing countries7, finding that they constitute 87.3% of total permits
issued during the period of the study.
Further decomposing the INED database by age and sex of the permit recipient also indicates that permanent immigration in France is overwhelm-ingly young and female. During the period 1994-2008, those aged 18 to 39 years old accounted for 83.2% of residence permit recipients, while females accounted for 51.7%.
As the INED database also allows us to look at the flow of permits based on the administrative reasons behind their issuance, we have grouped these numerous reasons into three main categories according to their economic relevance to the purpose of this study, as follows: 1) permits for work-related
6It is worth noting, however, that a major restriction in the database is that immigrant
residence permits are not required for persons aged less than 18 years old.
7We use the designation “developing” for convenience. We consider all countries except
Australia, Canada, Hong Kong, Israel, Japan, New-Zealand, the USA as well as European countries, as developing countries.
purposes; 2) permits for family purposes, which include family reunification for residing immigrants and families of French citizens, and finally what we call; 3) “other” permits, which may include student permits, visitor visas and various others.
Residence permits who have been granted to immigrants for work pur-poses represent 7.8% of the total issued permits and 5.8% of the permits issued to nationals of developing countries. Men constituted the majority of recipients for this category during the period of study. Permits granted under our constructed second category, family purpose, accounted for 37.7% of total permits issued and 40.6% of the permits issued to nationals of devel-oping countries. In this case, women constituted the majority of recipients of these permits.
It is worth noting that categories 2 and 3 may still allow for access into the labor market (and therefore influencing, and being influenced by, France’s macroeconomic conditions). Family reunification permits, as in all OECD countries, are governed by international conventions and recognized human rights. The government normally exercises little discretionary control over family immigration with changing eligibility criteria for issuing residence permits such as the duration of residence requested and minimum income required to reside in the country. Although the procedures for obtaining per-mits are not the same for foreign families versus families of French nationals, in both cases, however, the residence permit gives access to the labor market. “Student” residence permits, which fall under our constructed category 3 (and accounted for 29% of total permits) also give the right to work part-time8. The “retiree” permit, which has existed since 2004, and the “visitor” permit, which can be given to applicants with family ties to residents in France, on the other hand, do not allow for labor market access.
However, permits issued for “regularization” purposes (i.e. to regulate the status of residing immigrants, some of whom reside illegally), which were relatively high in 1997 and 1998, and permits issued for “refugees and state-less persons” that accounted for 11.9% of total permits, indeed give access to the labor market. However, it is not possible to untangle which of them could be for work-related purposes, and which for family purposes. Included in this third category also are permits issued for “private and family life” rea-son, which concerns various situations such as families accompanying workers holding a one-year and more permit as well as the recent recipients of “Skills and Talents” cards designed for scientists.
8Note, however, that international students are not considered as permanent residents
because they are not likely to settle in the host country with their families. In many cases they also have visas of less than 1 year.
Figure 1: Economic variables (GDP and unemployment) in France 1994:01 1996:01 1998:01 2000:01 2002:01 2004:01 2006:01 2008:011.1 1.2 1.3 1.4 1.5 1.6x 10
5 Real GDP per capita
1994:01 1996:01 1998:01 2000:01 2002:01 2004:01 2006:01 2008:017 8 9 10 11 12 Unemployment rate
Notes: Real GDP per capita is seasonally-adjusted GDP in vol-ume at chained-linked prices (reference year 2005) divided by total population. Unemployment rate is the seasonally-adjusted unem-ployment rate in percentage. Sources: INSEE.
Figure 2: immigration variables 1994:010 1996:01 1998:01 2000:01 2002:01 2004:01 2006:01 2008:01 0.1 0.2 0.3 0.4
Migration rate, all and developing countries
1994:010 1996:01 1998:01 2000:01 2002:01 2004:01 2006:01 2008:01 0.1
0.2 0.3 0.4
Migration rate, all and young migration
1994:010 1996:01 1998:01 2000:01 2002:01 2004:01 2006:01 2008:01 0.05
0.1 0.15 0.2
Male and female migration rate
1994:010 1996:01 1998:01 2000:01 2002:01 2004:01 2006:01 2008:01 0.05
0.1
Workers and families migration rate (from all countries)
1994:010 1996:01 1998:01 2000:01 2002:01 2004:01 2006:01 2008:01 0.05
0.1
Workers and families migration rate (from developing countries) All Developing countries All Young Male Female Workers Families Workers Families
Notes: immigration rate is immigration per 1000 inhabitants. Sources: INSEE, INED.
Table 1: Descriptive statistics
Variable Mean Std. Dev. Min Max
Real GDP per capita 2,216 151 1,930 2,489
Unemployment rate (in %) 9.55 1.14 7.50 11.30
immigration rate (per 1,000 population)
total 0.1645 0.0876 0.0503 0.4462
young 0.1371 0.0807 0.0385 0.4064
from dev. countries 0.1435 0.0776 0.0410 0.3884
male 0.0793 0.0445 0.0198 0.2297
female 0.0852 0.0434 0.0276 0.2196
workers 0.0128 0.0065 0.0050 0.0369
families 0.0618 0.0284 0.0212 0.1210
workers from dev. countries 0.0084 0.0049 0.0031 0.0252 families from dev. countries 0.0582 0.0276 0.0189 0.1142
Notes: Real GDP per capita is seasonally-adjusted GDP in volume at chained-linked prices (reference year 2005) divided by total population at the beginning of the month. Unemployment rate is the seasonally-adjusted unemployment rate in percentage. Immigration rate is immigration per 1,000 inhabitants. Source: authors’ calculations from INSEE, INED and OECD databases.
Table 1 shows descriptive statistics and Figures 1 and 2 display the time evolution of the variables used in our empirical analysis. During the period of study, real GDP per capita (volume at chained-linked prices, reference year 2005) of France ranged from 1,930 EUR to 2,489 EUR with an average of 2,216 EUR per month during the 1994-2008 period. The monthly unemploy-ment rate ranged from 7.50% to 11.30% with a mean of 9.55%. On average, the monthly immigration per 1,000 inhabitants is 0.1645. As shown in Table 1 and Figure 2, much of the immigration flow is explained by young im-migration and imim-migration from developing countries. Family imim-migration appears to be more important than labor immigration.
4
Econometric Results
This section presents the results of the impulse response functions. We begin with some preliminary diagnostic tests of our series, mainly the unit root and cointegration tests.
To test the stationarity properties of our series, we used the Augmented Dickey-Fuller (ADF) unit root test. The results reported in Table 2 show that at conventional 1% levels of significance, all series are found to be
non-Table 2: Stationarity test
Level First difference
Variable t-stat. p-value t-stat. p-value
Y 0.0930 0.9970 -12.3293 0.0000 U -1.8191 0.6915 -4.9635 0.0000 M -2.5768 0.2915 -5.8796 0.0000 YM -2.2670 0.4494 -17.8360 0.0000 MDEV -2.5579 0.3003 -6.0006 0.0000 MM -2.4727 0.3413 -6.1418 0.0000 FM -2.6127 0.2753 -17.8711 0.0000 MW -1.3337 0.8762 -17.4889 0.0000 MF 0.2921 0.9985 -15.8378 0.0000 MWDEV -1.3922 0.8602 -16.9173 0.0000 MFDEV 0.2432 0.9982 -15.7051 0.0000
Notes: The test statistic is the Augmented Dickey-Fuller (ADF) test statistic. For variables in level, constant and time trend are included; for the first-difference of variables, only the constant is included. The p-values are MacKinnon [1996] one-sided p-values.
stationary in level, but stationary in first difference.
Given this, we performed cointegration tests between the variables in lev-els. To this end, we employ the Johansen’s trace cointegration test. The results in Table 3 show that at a 1% significance level for all models consid-ered, there is at least one co-integrating relationship. As a result, the VAR estimation in level will be super-consistent. Particularly, impulse response matrices can be computed based on VARs (in level) with integrated variables ([L¨utkepohl, 2005, chap. 6, p. 258-263]). As stressed by Sims et al. [1990], when a cointegration relationship exists between the variables, not taking the first-difference process avoids loss of information contained in the data.
4.1
Estimates with All Residence Permits
Figure 3 displays the impulse responses of Model 1 which includes the log-arithm of GDP per capita, the loglog-arithm of unemployment rate, and the logarithm of immigration (all permits issued, regardless of the administra-tive reason for issuance) rate. We scale shocks so that they represent one unit change in corresponding variable. The response of immigration to GDP per capita is positive and significant for at least 3 years after the shock, whereas it is negative and significant to unemployment rate for the same period. Seen
Figure 3: Impulse responses in Model 1 10 20 30 0 0.05 0.1 0.15 0.2 0.25 0.3 0.35 0.4 M to GDP 10 20 30 −0.25 −0.2 −0.15 −0.1 −0.05 0 M to U 10 20 30 −0.1 0 0.1 0.2 0.3 0.4 0.5 0.6 0.7 GDP to M 10 20 30 −0.8 −0.6 −0.4 −0.2 0 0.2 0.4 0.6 U to M
Notes: The variables in Model 1 are, in logarithm, real GDP per capita (GDP ), unemployment rate (U ) and total immigration rate (M ). The identification is based on Choleski decomposition with the following ordering (M, GDP, U ). Shocks are scaled so they repre-sent one unit change in corresponding variable. The 90% confidence intervals are computed via with 5,000 bootstrap replications.
Figure 4: Impulse responses in Model 2
10 20 30 0 0.05 0.1 0.15 0.2 0.25 0.3 0.35 0.4 YM to GDP 10 20 30 −0.25 −0.2 −0.15 −0.1 −0.05 0 YM to U 10 20 30 −0.1 0 0.1 0.2 0.3 0.4 0.5 0.6 0.7 GDP to YM 10 20 30 −0.8 −0.6 −0.4 −0.2 0 0.2 0.4 0.6 U to YM
Notes: The variables in Model 2 are, in logarithm, real GDP per capita (GDP ), unemployment rate (U ), and young immigration rate (Y M ). The identification is based on Choleski decomposition with the following ordering (Y M, GDP, U ). Shocks are scaled so they represent one unit change in corresponding variable. The 90% confidence intervals are computed via with 5,000 bootstrap replica-tions.
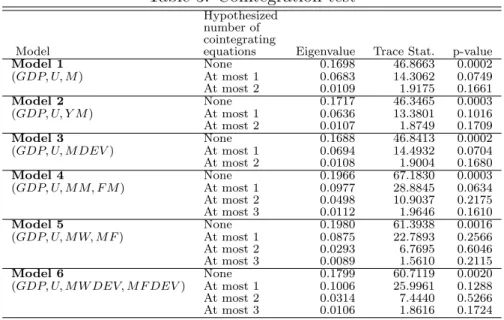
Table 3: Cointegration test
Hypothesized number of cointegrating
Model equations Eigenvalue Trace Stat. p-value Model 1 None 0.1698 46.8663 0.0002 (GDP, U, M ) At most 1 0.0683 14.3062 0.0749 At most 2 0.0109 1.9175 0.1661 Model 2 None 0.1717 46.3465 0.0003 (GDP, U, Y M ) At most 1 0.0636 13.3801 0.1016 At most 2 0.0107 1.8749 0.1709 Model 3 None 0.1688 46.8413 0.0002 (GDP, U, M DEV ) At most 1 0.0694 14.4932 0.0704 At most 2 0.0108 1.9004 0.1680 Model 4 None 0.1966 67.1830 0.0003 (GDP, U, M M, F M ) At most 1 0.0977 28.8845 0.0634 At most 2 0.0498 10.9037 0.2175 At most 3 0.0112 1.9646 0.1610 Model 5 None 0.1980 61.3938 0.0016 (GDP, U, M W, M F ) At most 1 0.0875 22.7893 0.2566 At most 2 0.0293 6.7695 0.6046 At most 3 0.0089 1.5610 0.2115 Model 6 None 0.1799 60.7119 0.0020 (GDP, U, M W DEV, M F DEV ) At most 1 0.1006 25.9961 0.1288 At most 2 0.0314 7.4440 0.5266 At most 3 0.0106 1.8616 0.1724
Notes: GDP , U , M , Y M , M DEV , M M (F M ), M W (M W DEV ) and M F (M F DEV ) are, in logarithm, real GDP per capita, unemployment rate, to-tal immigration rate, young immigration rate, immigration from developing countries rate, male (female) immigration rate, immigration rate of workers (from developing countries) and immigration rate of families (from develop-ing countries), respectively. The test is the unrestricted cointegration rank (trace) test with the null hypothesis at most r cointegrating relationship. The p-values are MacKinnon-Haug-Michelis [1999] p-values.
from the other direction, the response of GDP per capita to the immigration rate is also positive and significant for at least 3 years, whereas the response of the unemployment rate is non-significant.
The robustness of this first model is evaluated using only young adult immigrants (under the age of 40 years), which, again, constitute the largest portion of the immigration. The impulse responses of this robustness anal-ysis are displayed in Figure 4. This figure is very similar to what is seen in Figure 3. The response of young immigration rate to GDP per capita (un-employment) is positive (negative) and significant for at least 3 years after the shock. The response of GDP per capita to the young immigration rate is also positive and significant for at least 3 years, while the response of the unemployment rate to this immigration remains non-significant.
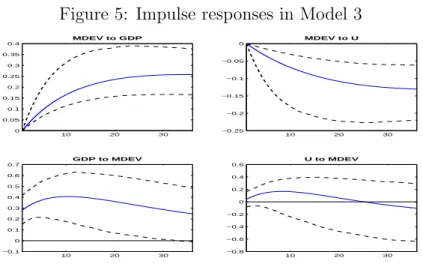
If we only use residence permits issued to nationals of developing coun-tries, we obtain very similar results, illustrated in Figure 5. The response of immigration rate from developing countries to GDP per capita (unem-ployment) is positive (negative) and significant for at least 3 years after the shock. The response of GDP per capita to the immigration rate from
devel-Figure 5: Impulse responses in Model 3 10 20 30 0 0.05 0.1 0.15 0.2 0.25 0.3 0.35 0.4 MDEV to GDP 10 20 30 −0.25 −0.2 −0.15 −0.1 −0.05 0 MDEV to U 10 20 30 −0.1 0 0.1 0.2 0.3 0.4 0.5 0.6 0.7 GDP to MDEV 10 20 30 −0.8 −0.6 −0.4 −0.2 0 0.2 0.4 0.6 U to MDEV
Notes: The variables in Model 3 are, in logarithm, real GDP per capita (GDP ), unemployment rate (U ) and rate of immi-gration from developing countries (M DEV ). The identification is based on Choleski decomposition with the following ordering (M DEV, GDP, U ). Shocks are scaled so they represent one unit change in corresponding variable. The 90% confidence intervals are computed via with 5,000 bootstrap replications.
oping countries is positive and significant for 3 years after the shock, while the response of unemployment rate remains non-significant.
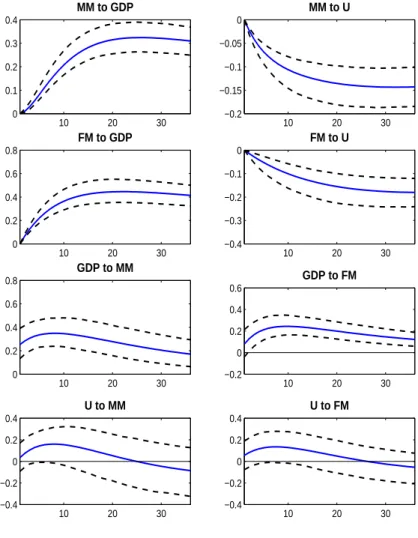
A similar estimate was made by distinguishing the permit recipients by sex. The impulse response functions are shown in Figure 6. These results in-dicate that the response of male and female migrations to an improvement in France’s GDP per capita are positive and significant for at least 3 years after the shock. Their responses to unemployment rate are negative and signifi-cant, also for at least 3 years after the shock. Seen from the other direction, a shock of male immigration causes a significant increase in France’s GDP per capita for at least 3 years, while a shock of female immigration increases GDP per capita non-significantly for the first month and significantly after-ward until at least 3 years after the shock. The response of the unemployment rate to male or female immigration shocks are, however, non-significant.
To check the robustness of the Choleski identification, we also employ a sign restrictions approach. Figure 7 displays the responses based on sign re-strictions of immigration variables with all resident permits issued to a labor demand shock induced by an improvement in host macroeconomic condi-tions9. The results in Figure 7 corroborate the results from the Choleski
Figure 6: Impulse responses in Model 4 10 20 30 0 0.1 0.2 0.3 0.4 MM to GDP 10 20 30 −0.2 −0.15 −0.1 −0.05 0 MM to U 10 20 30 0 0.2 0.4 0.6 0.8 FM to GDP 10 20 30 −0.4 −0.3 −0.2 −0.1 0 FM to U 10 20 30 0 0.2 0.4 0.6 0.8 GDP to MM 10 20 30 −0.2 0 0.2 0.4 0.6 GDP to FM 10 20 30 −0.4 −0.2 0 0.2 0.4 U to MM 10 20 30 −0.4 −0.2 0 0.2 0.4 U to FM
Notes: The variables in Model 4 are, in logarithm, real GDP per capita (GDP ), unemployment rate (U ), male immigration rate (M M ) and female immigration rate (F M ). The identification is based on Choleski decomposition with the following ordering (M M, F M, GDP, U ). Shocks are scaled so they represent one unit change in corresponding variable. The 90% confidence intervals are computed via with 5,000 bootstrap replications.
Figure 7: Immigration responses using sign restrictions 10 20 30 −5 0 5 10
M to labour demand shock
10 20 30 −5
0 5 10
YM to labour demand shock
10 20 30 −2 0 2 4 6 8
MDEV to labour demand shock
10 20 30 −10 −5 0 5 10
MM to labour demand shock
10 20 30 −2 0 2 4 6
FM to labour demand shock
Notes: GDP , U , M , Y M , M DEV , M M (F M ) are, in logarithm, real GDP per capita, unemployment rate, total immigration rate, young immigration rate and rate of immigration from developing countries, male (female) immigration rate, respectively. Shocks are scaled so they represent one unit change in corresponding variable. The 68% confidence intervals are computed via with 10,000 boot-strap replications.
orthogonalized impulse responses. More specifically, in response to improve-ments in France’s economic conditions, all the immigration variables, except for male immigration, increase significantly from 1 to at least 3 years after the shock. The response of male immigration to improvement in France’s economic condition is non-significant.
4.2
Estimates with Residence Permits issued for Labor
and Family Reasons
The analysis in this section decomposes immigration by reason of residence permit issued, mainly labor and family reasons. Figure 8 reports the im-pulse responses considering immigration from all countries. We find that in response to shocks on GDP per capita, the immigration of workers increases significantly for at least 3 years after the shock, whereas the immigration of families increases insignificantly for the first 7 months and significantly for the following months until at least 3 years. In response to a shock on un-employment, the immigration for both labor and family purposes decreases significantly for at least 3 years after the shock.
On the other hand, the response of GDP per capita to labor immigra-tion is non-significant (slightly significant only for the 1st month) while its response to family immigration is positive and significant for at least 3 years. The response of unemployment to labor immigration is positive and signif-icant from the 2nd month and until at least 3 years. On the contrary, the unemployment response to family immigration is negative and slightly sig-nificant from the 28th month after the shock.
As in the previous sub-section, the robustness of these results was tested by focusing only on the residence permits issued to nationals from develop-ing countries. The impulse response functions reported in Figure 9 are very similar to those in Figure 8. More specifically, in response to a shock on GDP per capita, labor and family immigration from developing countries in-crease significantly for at least 3 years after the shock, whereas they dein-crease significantly for the same period in response to unemployment shock.
The response of France’s GDP per capita to labor immigration from de-veloping countries remains non-significant while its response to family immi-gration from these countries is positive and significant for at least 3 years. In addition, the response of unemployment rate to labor immigration from
usual interpretation of sampling uncertainty but, here, they refer to the distribution across models. Following Fry and Pagan [2011], the solid line represents the response from a single model whose impulse responses are as close to the median values as possible. The dashed line represents the 16th and 84th percentiles of the accepted responses.
Figure 8: Impulse responses in Model 5 10 20 30 0 0.2 0.4 0.6 0.8 MW to GDP 10 20 30 −0.4 −0.3 −0.2 −0.1 0 MW to U 10 20 30 0 0.2 0.4 0.6 0.8 MF to GDP 10 20 30 −0.4 −0.3 −0.2 −0.1 0 MF to U 10 20 30 −0.2 0 0.2 0.4 0.6 GDP to MW 10 20 30 0 0.2 0.4 0.6 0.8 GDP to MF 10 20 30 −0.5 0 0.5 1 U to MW 10 20 30 −1 −0.5 0 0.5 U to MF
Notes: The variables in Model 5 are, in logarithm, real GDP per capita (GDP ), unemployment rate (U ), immigration rate of work-ers (M W ) and immigration rate of families (M F ). The identifica-tion is based on Choleski decomposiidentifica-tion with the following ordering (M W, M F, GDP, U ). Shocks are scaled so that they represent one unit change in corresponding variable. The 90% confidence intervals are computed with 5,000 bootstrap replications.
Figure 9: Impulse responses in Model 6 10 20 30 0 0.1 0.2 0.3 0.4 MWDEV to GDP 10 20 30 −0.4 −0.3 −0.2 −0.1 0 MWDEV to U 10 20 30 0 0.1 0.2 0.3 0.4 MFDEV to GDP 10 20 30 −0.4 −0.3 −0.2 −0.1 0 MFDEV to U 10 20 30 −0.2 0 0.2 0.4 0.6 GDP to MWDEV 10 20 30 0 0.2 0.4 0.6 0.8 GDP to MFDEV 10 20 30 −0.5 0 0.5 1 U to MWDEV 10 20 30 −1 −0.5 0 0.5 U to MFDEV
Notes: The variables in Model 6 are, in logarithm, real GDP per capita (GDP ), unemployment rate (U ), immigration rate of work-ers from developing countries (M W DEV ) and immigration rate of families from developing (M F DEV ). Shocks are scaled so that they represent one unit change in corresponding variable. The identifica-tion is based on Choleski decomposiidentifica-tion with the following ordering (M W DEV, M F DEV, GDP, U ). The 90% confidence intervals are computed with 5,000 bootstrap replications.
Figure 10: Immigration responses using sign restrictions 10 20 30 −5 0 5 10 15
MW to labour demand shock
10 20 30 −2 −1 0 1 2 3 4 5
MF to labour demand shock
10 20 30 −5 0 5 10 15 20 25 30
MWDEV to labour demand shock
10 20 30 −2 −1 0 1 2 3 4 5
MFDEV to labour demand shock
Notes: GDP , U , M W (M W DEV ), M F (M F DEV ) are, in loga-rithm, real GDP per capita, unemployment rate, immigration rate of workers (from developing countries), immigration rate of families (from developing countries), respectively. Shocks are scaled so they represent one unit change in corresponding variable. The 68% con-fidence intervals are computed with 10,000 bootstrap replications.
developing countries is positive and significant from the 2nd month and until at least 3 years, while its response to family immigration from developing countries is negative and significant from the 20th month to at least 3 years. In recent years, there has been an attempt to increase skilled-labor immi-gration and to reduce family immiimmi-gration in many OECD countries. In line with this, recent changes in French immigration policy, since the adoption of the new legislation on immigration control and foreign residence in November 2003, reflect the wish to shift policies from family immigration (immigration “subie”) to selective labor immigration (immigration “choisie”)10. On the
one hand, changes in family immigration policy have tended to impose more restrictive conditions such as some residency requirements, some income re-quirements and integration criteria. On the other hand, labor immigration policy tends to ensure a close link between immigrant worker entries and labor market needs by attracting skilled immigration and temporary immi-gration.
10The first law, adopted on 26 November 2003, represented the beginning of a series of
reforms of French immigration policy. On 24 July, 2006 a new Immigration and Integration Act entered into force which was replaced by the law on the management of immigration integration and asylum of 20 November 2007. These laws provide for new measures in order to attract skilled workers and to combat illegal immigration. These laws also introduce restrictive conditions for family reunification, such as higher resource requirements.
To evaluate the effects of this policy change, we have re-estimated Model 6, which distinguishes between labor and family immigration particularly from developing countries, over the period 1994-2003. The impulse response results reported in Figure A1 in the Appendix show that considering data before this policy change does not affect our findings except that the unem-ployment rate does not significantly respond to labor nor family immigration. Moreover, as in the previous sub-section, Figure 10 reports the response of labor and family immigration to a labor demand shock driven by an improve-ment in France’s macroeconomic conditions, using sign restrictions. The re-sults in this Figure 10 show that labor and family immigration, whatever is the origin country, increases significantly from the 7th month to at least 3 years after the shock.
5
Discussion of the Results
Our VAR analysis on French data for the period 1994-2008 allows for a bet-ter understanding of the nature of the relationships between the policy of issuing residence permits to immigrants and national macroeconomic perfor-mances. Table 4 reports the Choleski orthogonalized impulse responses at different horizons after the shock between France’s economic variables (GDP per capita and unemployment rate) and immigration rates. This table is useful for the comparison of the results from different models.
5.1
Effect of Macroeconomic Performances on
Immi-gration
We note from this paper’s findings that the number of residence permits is-sued in France evolves with the country’s macroeconomic conditions. Indeed, in all cases considered, the number of residence permits issued increases sig-nificantly following improvements in France’s economic condition (increase in GDP per capita or/and decrease in unemployment rate). However, when we restricted the analysis to permits issued for work or family reasons, the re-sults become much more convincing. Indeed, eliminating the permits issued to students, refugees, or foreign patients can only improve the analysis of the effect of macroeconomic conditions on immigration. It is more relevant to distinguish permits issued to workers than those issued to families. Permits issued to workers depend on political decisions, including the adoption of a list of jobs for which foreigners are allowed to apply for a permit, which is certainly affected by the labor market situation. We find that the reaction of labor immigration, whether from OECD countries or not, to GDP per capita
Table 4: Impact (elasticity) at 1 month, 1 quarter, 1 year and at the peak after the shock
Impact
Model 1 month 1 quarter 1 year peak
Model 1 M to GDP 0 0.0784 0.1993 0.2699 M to U 0 -0.0288 -0.0825 -0.1338 GDP to M 0.2692 0.3495 0.3978 0.3997 U to M 0.0445 0.1408 0.1663 0.1812 Model 2 Y M to GDP 0 0.0796 0.2015 0.2663 Y M to U 0 -0.0327 -0.0898 -0.1337 GDP to Y M 0.2820 0.3649 0.4075 0.4117 U to Y M 0.0330 0.1396 0.1672 0.1839 Model 3 M DEV to GDP 0 0.0721 0.1857 0.2578 M DEV to U 0 -0.0271 -0.0786 -0.1304 GDP to M DEV 0.2800 0.3575 0.4044 0.4062 U to M DEV 0.0416 0.1312 0.1517 0.1676 Model 4 M M to GDP 0 0.0549 0.2431 0.3242 M M to U 0 -0.0564 -0.1152 -0.1436 F M to GDP 0 0.1774 0.3953 0.4458 F M to U 0 -0.0413 -0.1154 -0.1802 GDP to M M 0.2529 0.3240 0.3368 0.3492 U to M M 0.0347 0.1275 0.1401 0.1600 GDP to F M 0.0791 0.1934 0.2397 0.2436 U to F M 0.0552 0.1161 0.1162 0.1342 Model 5 M W to GDP 0 0.2760 0.4371 0.4400 M W to U 0 -0.1274 -0.2325 -0.2333 M F to GDP 0 0.0906 0.1945 0.2197 M F to U 0 -0.0600 -0.1465 -0.1882 GDP to M W 0.1611 0.1039 0.0079 0.1611 U to M W 0.0757 0.2731 0.4412 0.4430 GDP to M F 0.3054 0.3718 0.4244 0.4244 U to M F 0.0343 0.1368 0.0698 -0.3502 Model 6 M W DEV to GDP 0 0.1614 0.2882 0.2882 M W DEV to U 0 -0.1150 -0.2370 -0.2405 M F DEV to GDP 0 0.0834 0.2086 0.2567 M F DEV to U 0 -0.0396 -0.1203 -0.1771 GDP to M W DEV 0.1220 0.0276 -0.0469 0.1220 U to M W DEV 0.0910 0.3078 0.6040 0.6309 GDP to M F DEV 0.3150 0.3777 0.4450 0.4471 U to M F DEV 0.0060 0.0993 0.0307 -0.4889 Notes: GDP , U , M , Y M , M DEV , M M (F M ), M W (M W DEV ) and M F (M F DEV ) are, in logarithm, real GDP per capita, unemployment rate, total immigration rate, young immigration rate, rate of immigra-tion from developing, male (female) immigraimmigra-tion rate, immigraimmigra-tion rate of workers (from developing countries) and rate of immigration of fam-ilies (from developing), respectively. a denotes significance at 10% or less, significance being given by bootstrapping.
is positive and strong. Calculating the response to 1% increase on the GDP per capita indicates a 0.1993% (0.2699%) increase in the immigration rate at end of one year (at the peak). This result is consistent with the study of long-term causality between immigration and macroeconomic conditions by Morley [2006] using annual data between 1930 and 2002 for Australia, Canada, and the United States. Labor immigration also reacts negatively and significantly to the unemployment rate. The elasticity of the immigra-tion rate to the unemployment rate equals -0.0825 (-0.1338) at the end of one year (at the peak). The effect of unemployment on immigration confirms the results of Damette and Fromentin [2013], and studies of long-run causal-ity by Withers and Pope [1985] and Pope and Withers [1993] for Australia and by Islam [2007] for Canada. Recently, these results were reinforced with a study by Beine et al. [2013] based on the estimation of a gravity model. These latter authors showed that relative business cycles and employment rates have an effect on bilateral immigration flows.
The study of the impact of macroeconomic conditions on family immigra-tion also brings an interesting perspective. By definiimmigra-tion, the policy of issuing residence permits is, for this reason, less dependent on economic conditions. An important part of this immigration concerns the spouses of French na-tionals, who can benefit from non-discretionary residence permits. Similarly, the issue of permits to foreign spouses is governed by a number of regula-tory mechanisms, such as the “family reunification procedure” which evolves slower than the macro-economic condition. However, we find that family im-migration reacts persistently and strongly to the GDP per capita. The elas-ticity of the family immigration rate to the GDP per capita equals 0.1945. This confirms the numerous studies showing that immigration choices depend on the economic conditions of the host country.
5.2
Effect of Immigration Policy on GDP per Capita
The impulse responses built from the estimated models show that GDP per capita responds positively to the immigration rate. This reaction is robust to the decomposition of immigration by age, sex, reason for issuing residence permits, and the immigrant’s birth country. These results are different from those obtained from panel data estimations, which conclude a lack of the im-migration effect on GDP per capita. Ortega and Peri [2009] had estimated a gravity model using data on 14 OECD countries, including France, over the period 1980-2005. They found that immigration increased GDP one for one, and that it therefore had no effect on GDP per capita. In addition, some authors have estimated, using panel data, a Solow model with human capital to assess the respective magnitudes of the increase in human capital
and the capital dilution. Dolado et al. [1994] found that the dilution effect was generally higher, while Boubtane et al. [2014] found that for a panel of 22 OECD countries (including France) over the period 1986-2006, the hu-man capital effect prevailed. This result and our findings show therefore that immigration is more favorable to economic activity in France than in the average of the OECD countries. More recently, Kiguchi and Mountford [2013] used a VAR model to quantify the macroeconomic effects of immigra-tion in the United States. The series of immigraimmigra-tion flows was constructed from unanticipated shocks to the labor force. In addition, the shocks were identified by imposing sign restrictions. The increase in the labor force had a temporary negative effect on GDP per capita with no negative effect on wages. The authors interpreted these results using a model where the labor supply of immigrants is complementary to the labor supply of skilled natives and substitute to capital.
Quantitatively, the effect on GDP per capita is high. Calculation of the impulse response to a shock of 1% on the immigration rate is associated with a 0.3978% (0.3997%) increase in GDP per capita at one year (at the peak). This impact reinforces previous studies that show, using alternative methodologies, that the potential gain from an increase in the mobility of workers is higher than that of increased capital mobility or increased trade (see Clemens [2001], and references cited therein). The long-term effect of immigration on productivity was estimated by Aleksynska and Tritah [2010] using data from OECD countries and more recently by Ortega and Peri [2014] considering data on 194 countries. They found an elasticity of 0.1 and 6, respectively.
Our results also reinforce the recent studies by Alesina et al. [2013] and Ager and Br¨uckner [2013], which showed that the diversity of immi-grant birthplaces had a positive effect on growth in rich countries. It is not possible to know, with the information from the INED database, the level of education of immigrants into France, but our results provide further evidence of the complementarity of labor supply of immigrants with the native born population.
When we do consider the immigration of young adults or the immigration from developing countries (which represent the largest part of immigration to France), our results suggest that the response of GDP per capita to shock is of a similar magnitude. To explain the positive effect of younger immigrants, particularly from developing countries, several hypotheses are possible. From a microeconomic point of view, better integration in the labor market due in part to a higher human capital is possible. From a macroeconomic per-spective, the immigration of young workers can mitigate the effects of an aging workforce. According to the United Nations [2001], the net
immigra-tion that would be required to maintain the number of persons of working age in France is approximately equal to 150,000 persons per year.
The impulse responses also indicate that both the immigration of men and women have positive effects on GDP per capita, the impact being slightly higher for male immigration. Conversely, we find that family immigration has a positive effect on GDP per capita, while labor immigration has, in most cases, no significant effect on GDP per capita. The positive effect of the family immigration was studied, in particular, by Kremer and Watt [2006], Furtado and Hock [2010] and Cort´es and J. Tessada [2011] for the United States, Farr´e et al. [2001] for Spain, Romiti [2011] for Great Britain, and Barone and Nocetti [2011] for Italy. The idea is that family immigration that is generally poorly educated immigration fits well in the market for home services, which allows the educated native born women to increase their participation in the labor market. There is, to date, no studies for France, but if this mechanism is effective, it is likely to be due to the lack of labor supply in the area of home services. Because of legislation regarding the minimum wage, it is indeed unlikely that immigration leads to downward pressure on wages in this sector. It is important to have in mind that a residence permit allowed for family reasons gives access, in France, to the labor market with no restrictions, whereas permits allowed for work purposes are often delivered provided that the employment is taken in specific sectors, such as the construction industry.
Another channel that might explain the positive effect of family immigra-tion has been explored by Hunt [2012]. She evaluates the impact of immigrant children on the high school completion of natives children in the United States and finds that an increase in the share of immigrants in the population aged 11-64 increases the probability that natives complete 12 years of schooling. The mechanism is that immigration increases wage inequality in the lower part of the native distribution, particularly the wage gap between high school dropouts and high school graduates, which in turns increases the return to completing high school. This impact has not been tested for France.
Finally, the relative advantage of family immigration can be apprehended by its impact on the demand. Immigrants that stay in family are more likely to consume a large part of their income in the host country whereas labor immigrants devote a substantial part to remittances.
5.3
Effect of Immigration Policy on Unemployment
The estimated models in the previous section cannot conclude that, in most cases, immigration has a significant effect on unemployment in France. A significantly positive (negative) effect was found only in the case of labor
(family) immigration. The effect of labor and family immigration are not significant when the period of changes in France’s immigration policies are excluded. The recent shift in France’s immigration policy to increase skilled immigration seems to have brought immigrants who might replace resident workers. In other words, residence permits for labor reasons seem to be issued to skilled immigrants.
Our results are in line with previous studies, although sometimes con-tradictory, which conclude either very moderate effects or a lack of effect of immigration on unemployment11. Among these studies, Hunt [1992] studied
the effect of repatriates from Algeria in 1962 as a natural experiment and showed that the arrival of 900,000 people increased resident unemployment by 0.3 percentage points. In contrast, Gross [2002], who estimated a VAR on French data between 1975 and 1994 by imposing structural relationships on the variables, did not find any significant short-term effects of immigration on unemployment. Studies of a range of countries, including France, also lead to conflicting results. Angrist and Kugler [2003] studied 18 European countries between 1983 and 1999 and concluded that European foreigners re-duced employment of the native born population, but non-Europeans had no significant effect. Jean and Jim´enez [2011] studied these countries between 1984 and 2003 and found a positive but temporary effect of foreigners on the unemployment of the native born. In contrast, Ortega and Peri [2009] showed that immigration increased employment without any effect on native-born populations, and Damette and Fromentin [2013] found that immigration reduced short-term unemployment.
The long-term relationship between immigration and unemployment was studied in France and in British Columbia by Gross [2002] and Gross [2004], respectively. In both cases, a negative and significant relationship was es-tablished. Finally, work on the causal relationship between immigration and unemployment concluded either no causal relationship between immigration and unemployment (Withers and Pope [1985], and Pope and Withers [1993], for Australia, Shan et al. [1999], for Australia and New Zealand, and Is-lam [2007], for Canada) or a negative causal relationship (K´onya [2000], for Australia).
Of course, our macroeconomic approach is not restricted to the unem-ployment rate of natives (Borjas, 2003), but in the case of France, Ortega and Verdugo [2014] showed that the natives were unaffected by immigration and avoided competition with immigrants by changing profession.
The decomposition of immigrants by the administrative reason for issuing
11See, in particular, Card [2005] for the United States, Dustmann et al. [2005] for the
the residence permit has been shown to be useful to assess the labor mar-ket performance of immigrants. Concerning European countries, Constant [2005], Constant and Zimmermann [2005b] have studied those performances in Denmark and Germany, Rodriguez-Planas and Vegas [2011] in Spain and Akg¨u¸c [2013] in France. The latter shows that women who come for family reasons have lower labor force participation and employment rates than those who arrive as workers or students.
6
Conclusion
Contrary to an idea that is sometimes shared and despite the ambiguity of the effects highlighted by theoretical models, most empirical studies do not suggest a negative impact of immigration on the host country (Friedberg and Hunt [1995a,b], Chojnicki [2004]). The case study of France between 1994 and 2008 goes further. Although the majority of recipients of residence permits of more than a year immigrated for family reasons, immigrants con-tributed significantly to the growth of GDP per capita, and in some cases, reduced the unemployment rate. This reinforces the idea that some com-plementarity exists between the supply of labor of immigrants and that of native born populations, and that diverse places of birth is a positive factor for the economic performance of a country. In addition, the entry of immi-grants reacts significantly to the macroeconomic performance: all immiimmi-grants react positively to GDP per capita and immigrants in search of work react negatively to the unemployment rate. Additional microeconomic investiga-tions are needed to distinguish among the possible causes, and most notably between the territory’s attractiveness and the immigration policy choices. However, examining the reasons for issuing residence permits confirms that the choice of destination country made by the immigrants is based on its economic conditions.
Appendix
Figure A1: Impulse responses in Model 6 considering data before migration policy change (1994-2003) 10 20 30 0 0.1 0.2 0.3 0.4 MWDEV to GDP 10 20 30 −0.4 −0.3 −0.2 −0.1 0 MWDEV to U 10 20 30 0 0.2 0.4 0.6 0.8 MFDEV to GDP 10 20 30 −0.4 −0.3 −0.2 −0.1 0 MFDEV to U 10 20 30 −0.2 0 0.2 0.4 0.6 GDP to MWDEV 10 20 30 −0.2 0 0.2 0.4 0.6 GDP to MFDEV 10 20 30 −0.2 0 0.2 0.4 0.6 U to MWDEV 10 20 30 −0.2 0 0.2 0.4 0.6 U to MFDEV
Notes: The variables in Model 4 are, in logarithm, real GDP per capita (GDP ), unemployment rate (U ), immigration rate of workers (M W ) and immigration rate of families (M F DEV ).. The identifi-cation is based on Choleski decomposition with the following order-ing (M W, M F, GDP, U ). Shocks are scaled so they represent one unit change in corresponding variable. The 90% confidence intervals are computed via with 5000 bootstrap replications.
References
P. Ager and M Br¨uckner (2013), Cultural Diversity and Economic Growth: Evidence from the US during the Age of Mass Migration, European Eco-nomic Review 64, 76-97.
M. Akg¨u¸c (2013), Do Visas Matter? Labor Market Outcomes of Immigrants in France by Visa Classes at Entry, Mimeo.
M. Aleksynska and A. Tritah (2010), Immigration et Productivit´e dans les Pays de l’OCDE, Revue Economique 61, 521-531.
A. Alesina, J. Harnoss and H. Rapoport (2013), Birthplace Diversity and Economic Prosperity. NBER Working Papers 18699.
J. Angrist and A. Kugler (2003), Protective or Counter-productive? Labor Market Institutions and the Effect of Immigration on EU Native. Economic Journal 113, F302-F331.
G. Barone and S. Mocetti (2011), With a Little Help from Abroad: The Effect of Low-skilled Immigration on the Female Labour Supply. Labour Economics 18, 664-675.
M. Beine, P. Bourgeon and J.-C. Bricongne (2013), Business Cycles and International Migration among OECD Countries, CESifo Working Paper no. 4379.
S. Bertoli, H. Br¨ucker and J. Fern´andez-Huertas Moraga (2013), The Euro-pean Crisis and Migration to Germany: Expectations and the Diversion of Migration Flows. IZA Discussion Paper No. 7170.
O.J. Blanchard and D. Quah (1989), The Dynamic Effects of Aggregate De-mand and Supply Disturbances. American Economic Review, 79(4), 655-673.
G. J. Borjas (2003), The Labor Demand Curve is Downward Sloping: Re-examining the Impact of Migration on the Labor Market. The Quartely Journal of Economics 118, 1335-1374.
E. Boubtane, D. Coulibaly and C. Rault (2013), Immigration, Growth and Unemployment: Panel VAR Evidence from OECD Countries. Labour: Re-view of Labour Economics and Industrial Relations, 27(4), 399-420, 2013. E. Boubtane, J.C. Dumont and C. Rault (2014), Immigration and Economic
Growth in the OECD Countries 1986-2006, IZA Discussion Papers 8681. F. Canova and G. De Nicol´o (2002), Monetary Disturbances Matter for
Busi-ness Fluctuations in the G-7. Journal of Monetary Economics, 49(6), 1131-1159.
115, F300-F323.
X. Chojnicki (2004), The Economic Impact of Immigration for the Host Countries, Brussels Economic Review 47, 9-28.
M. A. Clemens (2011), Economics and Emigration: Trillion-Dollar Bills on the Sidewalk? Journal of Economic Perspectives 22, 83-106.
A. F. Constant (2005), Immigrant Adjustment in France and Impacts on the Natives. In K.F. Zimmermann (ed.), European Migration: What Do We Know, Oxford: OUP.
A. F. Constant and K.F. Zimmermann (2005a), Immigrant Performance and Selective Immigration Policy: A European Perspective, National Institute Economic Review 194, 94-105.
A. F. Constant and K.F. Zimmermann (2005b), Legal Status at Entry, Eco-nomic Performance, and Self-employment Proclivity: A Bi-national Study of Immigrants, IZA Discussion Paper No. 1910.
P. Cort´es and J. Tessada (2011), Low-Skilled Immigration and the Labor Supply of Highly Skilled Women. American Economic Journal: Applied Economics 3, 88-123.
O. Damette and V. Fromentin (2013), Migration and Labour Markets in OECD Countries: A Panel Cointegration Approach. Applied Economics 45, 2295-2304.
F. T. Denton (1971), Adjustment of Monthly or Quarterly Series to Annual Totals: An Approach Based on Quadratic Minimization. Journal of the American Statistical Association 66, 99-102.
J. Dolado, A. Goria and A. Ichino (1994), Immigration, Human Capital and Growth in the Host Country. Evidence from Pooled Country Data. Journal of Population Economics 7, 193-215.
C. Dustmann, F. Fabbri and I. Preston (2005), The Impact of Immigration on the British Labour Market, Economic Journal 115, F324-F341.
L. Farr´e, L. Gonz´alez and F. Ortega (2011), Immigration, Family Responsi-bilities and the Labor Supply of Skilled Native Women. The B.E. Journal of Economic Analysis & Policy 11, 1-48.
J. Faust (1998), The Robustness of Identified VAR Conclusions about Money. Carnegie-Rochester Conference Series on Public Policy, 49, 207-44. R. M. Friedberg and J. Hunt (1995), The Impact of Immigrants on Host
Country Wages, Employment and Growth. Journal of Economic Perspec-tives 9, 23-44.
R. M. Friedberg and J. Hunt (1995), Immigrants and the Receiving Economies. In C. Hirschman, P. Kasinitz and J. DeWind (eds.),
Hand-book of International Migration: The American Experience, New York: Russell Sage Foundation.
R. Fry and A. Pagan (20111), Sign Restrictions in Structural Vector Autore-gressions: A Critical Review. Journal of Economic Literature, 49, 938-960. D. Furtado and H. Hock (2010), Low Skilled Immigration and Work-Fertility Tradeoffs among High Skilled US Natives. American Economic Review 100, 224-28.
D. Gross (2002), Three Million Foreigners, Three Million Unemployed? Im-migration Flows and the Labour Market in France. Applied Economics 34, 1969-1983.
D. Gross (2004), Impact of Immigrant Workers on a Regional Labour Market. Applied Economics Letters 11, 405-408.
G. H. Hanson and A. Spilimbergo (1999), Illegal Immigration, Border En-forcement, and Relative Wages: Evidence from Apprehensions at the U.S.-Mexico Border, American Economic Review 89, 1337-1357.
J. Hunt (1992), The Impact of the 1962 Repatriates from Algeria on the French Labor Market. Industrial and Labor Relations Review 45, 556-572 J. Hunt (2012), The Impact of Immigration on the Educational Attainment
of Natives. NBER Working Paper No. 18047.
A. Islam (2007), Immigration Unemployment Relationship: The Evidence from Canada. Australian Economic Paper 46, 52-66.
S. Jean and M. Jim´enez (2011), The Unemployment Impact of Immigration in OECD Countries. European Journal of Political Economy 27, 241-256. S. P. Kerr and W. R. Kerr (2011), Economic Impacts of Immigration: A
Survey. Finnish Economic Papers 24, 1-32.
T. Kiguchi and A. Mountford (2013), The Macroeconomics of Immigration. MPRA Paper No. 45517.
L. K´onya (2000), Bivariate Causality between Immigration and Long-term Unemployment in Australia, 1981-1998. Working Paper, Victoria Univer-sity, School of Applied Economics, No. 18/00.
M. Kremer and S. Watt (2006), The Globalization of Household Production. Mimeo.
H. L¨utkepohl 2005. New Introduction to Multiple Time Series Analysis. Springer
J. G MacKinnon (1996), Numerical Distribution Functions for Unit Root and Cointegration tests. Journal of Applied Econometrics 11, 601618. J. G. MacKinnon, A. A. Haug and L. Michelis (1999), Distribution Functions
of Likelihood Ratio Tests for Cointegration. Journal of Applied Economet-rics 14, 563-577.
B. Morley (2006), Causality between Economic Growth and Immigration: An ARDL Bounds Testing Approach. Economics Letters 90, 72-76. P. M. Orrenius and M. Zavodny (2003), Do Amnesty Programs Reduce
Un-documented Immigration? Evidence from IRCA, Demography 40, 437-450. F. Ortega and G. Peri (2009), The causes and effects of international migra-tions: Evidence from OECD countries 1980-2005. NBER Working Paper 14833.
J. Ortega and G. Peri (2014),Openness and income: The roles of trade and migration, Journal of International Economics 92, 231-251.
J. Ortega and G. Verdugo (2014), The impact of immigration on the French labor market: Why so different?, Labour Economics, 29, 14-27.
D. Pope and G. Withers (1993), Do Migrants Rob Jobs? Lessons of Aus-tralian History, 1861-1991. Journal of Economic History 53, 719-742. N. Rodriguez-Planas and R. Vegas (2011), Moroccans’ Assimilation in Spain:
Family-Based versus Labor-Based Migration. Middle East Development Journal 3, 119-139.
A. Romiti (2011), Low Skilled Immigrants, Household Services, Labour Sup-ply and Fertility Decisions of British Women. ??
J. Rubio-Ramirez, D. Waggoner and T. Zha (2010), Structural Vector Au-togressions: Theory of Identification and Algorithms for Inference. Review of Economic Studies, 77(2).
M. A. Schain (2008), The Politics of Immigration in France, Britain, and the United States: A Comparative Study. New York: Palgrave Macmillan. J. Shan, A. Morris and F. Sun (1999), Immigration and Unemployment:
New Evidence from Australia and New Zealand. International Review of Applied Economics 13, 253-260.
C. A. Sims, J. H. Stock and M. W. Watson (1990), Inference in Linear Time Series Models with Some Unit Roots. Econometrica 58, 113-144
X. Thierry (2001), Les entr´ees d’´etrangers en France de 1994 `a 1999. Popu-lation 56, 421-448.
H. Uhlig (2005), What Are the Effects of Mon etary Policy on Output? Results from an Agnostic Identification Procedure. Journal of Monetary Economics, 52(2), 381-419.
United Nations (2001), Replacement Migration: Is It a Solution to Declining and Ageing Populations. Population Division.
G. Withers and D. Pope (1985), Immigration and Unemployment. Economic Record 61, 554-563