MIT LIBRARIES
Digitized
by
the
Internet
Archive
in
2011
with
funding
from
Boston
Library
Consortium
Member
Libraries
hb3i
[DEWey
.M415
—
"~—
-Massachusetts
Institute
of
Technology
Department
of
Economics
Working
Paper
Series
AN
ASSESSMENT
OF
THE
PROPOSALS
OF
THE
PRESIDENT'S
COMMISSION
TO
STRENGTHEN
SOCIAL
SECURITY
Peter
Diamond
Peter
Orszag
Working
Paper
02-28
July
2002
Room
E52-251
50
Memorial
Drive
Cambridge,
MA
02
142
This
paper can
be
downloaded
without
charge from
the
Social
Science
Research Network Paper
Collection
at
Massachusetts
Institute
of
Technology
Department
of
Economics
Working
Paper
Series
AN
ASSESSMENT OF
THE PROPOSALS
OF
THE
PRESIDENT'S
COMMISSION
TO
STRENGTHEN
SOCIAL
SECURITY
Peter
piamond
Peter
Orszag
Working
Paper
02-28
July
2002
Room
E52-251
50
Memorial
Drive
Cambridge,
MA
02142
This
paper
can be
downloaded
without
charge from
the
Social
Science
Research Network
Paper
Collection
at
http://papers.ssm.com/abstract=322040
AUG
2
An
Assessment
of the
Proposals
of
the President's
Commission
to
Strengthen
Social
Security
July
2002
PeterA.
Diamond
InstituteProfessor
and
ProfessorofEconomics
MIT
Department
ofEconomics
E52-344
50 Memorial
DriveCambridge
MA
02142-1347
pdiamond@mit.edu
Peter R.
Orszag
Joseph A.
Pechman
Senior FellowEconomic
StudiesThe
Brookings Institution1775 Mass.
Ave
NW
Washington,
DC
20036
porszag@brookings.edu
An
Assessment
oftheProposals ofthe President's
Commission
toStrengthen
Social SecurityPeterA.
Diamond
and
Peter R.Orszag
July
2002
Abstract
The
President'sCommission
to Strengthen Social Securityproposed
three reform plans.Two,
analyzed here, restore actuarial balancein the absence ofindividual accounts.One
achieves this balance solely through benefit reductions.
The
other usesnew
dedicated revenue to cover one-third ofthe actuarial deficit, reducing benefits to close the rest.Both
plans cut disability andyoung
survivor benefits in step with retirement benefits,while bolstering benefits for long-career
low
earnersand
surviving spouses withlow
benefits.
The
plansboth include voluntary individual accounts that replace partofthe scaled-back Social Security system. Payroll taxes are diverted to the accountsand
one of the plansalsorequires a (subsidized) add-oncontribution forthosechoosingaccounts.
Under
both models,any
payroll tax deposited in anindividual account is also recorded in a "liabilityaccount" for the worker.
The
liability account tracks the diverted payroll revenue (withinterest)
and
is paid offby
reducing traditional benefits.The
individual accounts aresubsidized through a sub-market interest rate on the liability accounts. This subsidy
worsens
the financial position of the Trust Fund.The
accounts also create a cash-flow problem. Consequently,by
themselves, the individual accountsmake
Social Security's solvencyproblems
worse
both inthe shortrunand
overthe longrun.To
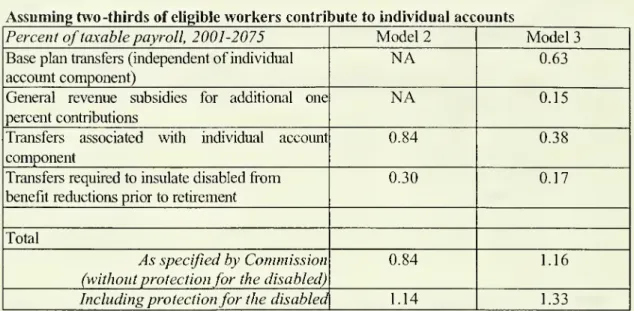
offset the adverse impact ofthe accounts, theplans call for large transfers ofgeneralrevenues (despite substantial projected budget deficits). If all (two-thirds of) eligible
workers opted forthe accounts, the
new
revenues required over the next 75 yearswould
amount
tobetween
1.2and
1.5 (0.8and
1.1) percent of payroll.Holding
the disabled harmlessfrom
the benefit reductionswould
raise the required transfers tobetween
1.5and 1.7 (1.1 and 1.3) percent ofpayroll
(compared
to a projected actuarial deficit of 1.9relative to paying scheduled benefits, the plans
would
produce significant reductions inexpected
combined
benefits.At
the end of 75 years, however, assets in the accountswould
amount
tobetween
53and 66
(35and
44)percentofGDP,
and
the value to Social Security of the accumulated liabilities that reduce later benefitswould
amount
tomore
An
Assessment
ofthe Proposals ofthePresident's
Commission
toStrengthen
Social SecurityPeterA.
Diamond
and
Peter R.Orszag
1July,
2002
Social Security isrunning short-term surplusesbut faces a long-term actuarialimbalance.
According
to theintermediate costprojections containedin the2002 Annual
Report ofthe Social Security Trustees, the projected imbalance over the next 75 yearsamounts
to 1.87 percent of taxable payroll.2 In other words, an increase in the payroll tax rate of 1.87 percentage points (.935 each foremployer
and employee)
starting in2003
would
beneeded
to balance projected revenuesand
outlays over the 75-year horizon traditionally used toexamine
the financialpositionofSocial Security.
Moreover,
the Trustees' Reportprojected that theTrustFund
would
be
exhausted (reach zero) in 2041, atwhich
pointincoming
revenuewould
be sufficient tofinance only about 75percent
of
scheduledbenefits.3Social Security's long-term actuarial imbalance,
combined
with a desireby
some
tointroduce individual accounts into the program, has sparked interest in reform over the past several years.4 Indeed, Social Security figured prominently in the
2000
presidential campaign. Followingthe election, PresidentBush
appointed acommission
—
thePresident'sCommission
toStrengthen Social Security
—
withtwo
chargesand
several constraints.One
was
to find away
to1
We
thank Greg Anrig, Barry Bosworth, Robert Cumby, William Gale, Stephen Goss,Robert Greenstein, KiloloKijakazi, Alicia Munnell, Richard Leone, Jeffrey Liebman, Michael Orszag, Jim Poterba, Wendell Primus, and
Bernard
Wasow
forhelpfulcommentsand/or discussions. Theviews expressedhere are thoseoftheauthorsaloneand donot necessarily represent those ofthestaff,trustees,orofficersoftheinstitutionswithwhichthe authors are
affiliated. Fora lesstechnicalversionof ouranalysis,seePeterDiamondandPeterOrszag,"ReducingBenefitsand
SubsidizingIndividualAccounts:
An
Analysis ofthePlans Proposed by thePresident'sCommission to StrengthenSocial Security,"TheCentury FoundationandtheCenteron BudgetandPolicyPriorities,June 18,2002.
See2002AnnualReport oftheBoardofTi-usteesoftheFederalOld-Age andSurvivorsInsuranceandDisability
Insurance TrustFunds. The actuarial imbalance figure reflects theintermediate cost projections and includes the
cost ofensuring that theTrust Fund at the end ofthe evaluation period is equal to oneyear's expenditures. The
imbalanceamountsto0.7percentof
GDP
overthenext75years.Theevaluationbythe OfficeoftheChief ActuaryatSocialSecurityoftheCommission'sproposalswerebased on
the intermediate cost assumptions used in the 2001 report ratherthan the 2002 report. The 2001 assumptions
produceda75-yearactuarial imbalance of1.86percentofpayrolland aprojected dateofTrust Fundexhaustion of 2038.
restore "financial soundness" to the system.
The
secondwas
to design a system ofvoluntary individual accounts.(Box
1 provides the precisewording
of the charge to theCommission.)
After deliberating for approximately eight months, theCommission
issued a final report inDecember
2001
thatcontainedthree differentproposals.5One
ofthe threeCommission
proposals(Model
1)would
notrestorelong-term balancetoSocial Security
and
is therefore not considered inmuch
detail here.The
othertwo
models
substantially reduce traditional Social Security benefits in order to
improve
the system'slong-term balance. Indeed, these
two models
achieve actuarial balance in the absence of theirindividual accountproposals.
The
models
also create individualaccounts thatreplacepart ofthescaled-back Social Security system.
By
themselves,the accountsworsen
Social Security'slong-term actuarial balance because of subsidies provided to workers opting for the accounts.
The
accounts also create a cash-flow
problem
sincerevenues are divertedaway
from
Social Security decadesbefore benefits arereducedas a resultoftheaccounts.To
deal with the deterioration in Social Security's finances generatedby
the individual accounts,Models
2 and 3 call for significant infusions ofgeneral revenue into Social Security.Given
the dramatic deterioration in the nation's fiscal outlook, however, simplyassuming
theavailability of large transfers, without specifying other changes in the Federal budget to
accommodate
suchtransfers,would
appeartobe problematic.The
purpose of this paper is to describe and assess the proposals included in theCommission's
final report. Before turning to the analysis, one issue is worth highlighting: the baseline againstwhich
theproposedbenefitsare compared. Indescribing bothbenefit levelsand
fiscal implications,
we
initiallycompare
the proposals to "scheduled benefits,"which
are thosegiven
by
the current benefit formula withoutmaking any
adjustment for the current level ofactuarialimbalance. Thisbaselinehas
some
advantages. First,the current benefitformula has aninherent
economic
logic: it maintains replacement ratesfrom
one generation to the next forForahistoryofthereform debateduringthe 1990s, seeDouglasW. Elmendorf,JeffreyB. Liebman,andDavidW.
Wilcox, "Fiscal Policy and Social Security Policy During the 1990s," inJeffrey A. Frankel and Peter R. Orszag,
workers with the
same
earningsrelative to the averagewage
(oncethenormal
retirementage hasstabilized). Second, since it is
embodied
in legislation, the current benefit formula isunambiguous and
does not require assumptions abouthow
benefits might be adjusted in thefuture.
The
major
limitation of using scheduled benefits as the baseline,however,
is that SocialSecurity
would
not be able topay
these scheduled benefits without additional revenue. Inparticular, paying scheduledbenefits
would
require additional financing equal to 1.87 percent oftaxable payroll over the next 75 years. Despite this long-term financing gap,
we
use scheduled benefits as the baseline in our initial analysis.We
note that this treatmentconforms
to the approach to evaluating Social Security reforms adoptedby
theGreenspan
Commission
in 1983and
theAdvisory
Council in 1994-1996, bothofwhich used
the scheduledbenefit formula as the baseline despite projected long-term deficits in Social Security. Importantly,by
using a single baseline throughout the initial analysis,we
describe not only benefit levels but also fiscalimplications relative to the
same
standard.7 Thisremoves
the temptation to focus attentionon
differentbaselines for differentimplicationsofa proposal.8
5
A
revisedfinalreportwas issuedinMarch 2002. All page numbersand referencesin this documentrefer to the
March2002versionoftheReport.
6
The Commission used three baselines, scheduled benefits, payable benefits, and real benefits paid to current
retirees. "Payablebenefits" are defined as the benefits thatcouldbe financed by projected revenues undercurrent
law, assumingnochangeinrevenuesor benefitsuntil theTrustFundis exhausted, followedbya cutin benefitsso
that annual benefits equal annual revenues.
Two
problemsarise with regard to this alternative baseline. First, thepattern ofbenefits is complex, making it harder to follow the implications ofthe proposals. Second, thepayable
benefitbaselinemaybe evenlessplausiblepoliticallythan thescheduledbenefit baseline. AsChairman Greenspan
has emphasized, the pattern ofno action followedby such sharp benefit cuts embodied in the "payablebenefits"
baseline simply will nothappen. (Alan Greenspan, "Saving for Retirement," Remarks before the 2002 National
SummitonRetirementSavings, theDepartmentof Labor, Washington, D.C.,February28,2002.) The Commission
arguesagainst useofthe scheduled benefitbaselinebecause "confusion occasionally arises when comparisons are
made between two different plans that employ different levels of tax revenue." (President's Commission to
Strengthen Social Security, Strengthening SocialSecurityand CreatingPersonal Wealth forAllAmericans, page
35.)
We
recognizethatsuch confusion canarise.We
note,however,thattheCommission'splans involve substantialamounts ofgeneral revenue transfers. The "payable benefits" baseline, on the other hand, involves no general
revenuetransfersbydefinition, sinceSocial Security benefitsare always maintained atthe level ofSocial Security
revenue. The Commission's comparison ofthe benefits under its plans to the "payable benefits" baseline thus
violates its own warning against comparing plans with different levels ofassumed tax revenue. Indeed, ifone
wantedtocompare plansto a baselinewith thesamelevel ofassumed general revenue, Models 2 and3 would be
moreappropriately compared tothescheduledbenefitbaseline than thepayablebenefit baseline, because the level
ofgeneral revenuetransfers underModels 2 and 3overthenext 75 years aremuch closerto the level oftransfers
requiredtofinancescheduledbenefitsthantozero.
In particular,usingscheduledbenefitsasthebaselineforcomparingrevenueinfusions, butpayablebenefitsas the
baseline for benefit comparisons, could easily create confusion. For example, Model 2's combined benefits are
lowerthan scheduledbenefits,but Model 2's actuarial deficit (absentgeneral revenuetransfers) is also lowerthan
with scheduledbenefits. At thesame time, Model 2's combined benefits are less than payable benefits until the
TrustFundisexhausted andthen eventually larger thanpayablebenefits. Sincepayablebenefits,bydefinition,need
Use
of scheduledbenefitsas the initial baseline in thisanalysis, however, is notmeant
toimply inany
way
thatreforms tothe currentsystem areunnecessary. Indeed,we
favor restoringactuarial balance with legislation in the near future that slowly phases in a combination of
changes tothe Social Security system, including adjustments toboth revenues
and
benefits. It isalso importantto
emphasize
thatwe
examine
the effectsofalternative baselines in a latersection ofthe paper,where
we
provide informationon two
alternative baselines that achieve 75-year solvency with thesame
level ofgeneralrevenuetransfers asModel
2.To
examine
the effects of theCommission's
proposals, Section I begins with the proposed changes in the determination and financing of traditional Social Security benefits.Examining
these changes totraditional benefits is importantas a buildingblock in understandingthe overall effects ofthe proposals,
and
is crucially important in understanding the effects forworkers
who
choose not to contribute to the individual accounts. Section II thenexamines
thestructure of the individual accounts proposed
by
theCommission.
Section III presents thecombined
effects of the individual accountsand
the changes to the traditionalcomponent
of Social Security in terms of assets, cash flows, actuarial imbalance, andmonthly
benefits forworkerswith differentearnings levels.9 Section
IV
offerssome
conclusions.I.
Changes
inScheduled
BenefitsThe
Commission
referredtoitsthreeproposalsas "reform models."The
first contains an individual account plan withoutany
changes to the traditional system,and
therefore is not described in this section (since there is nothing to explain about its impacton
scheduledbenefits)andlessdemandongeneralrevenues(thanscheduledbenefits),while anopponent canassert thatModel2
offers lower benefits (than scheduled benefits) and makes a greater demand on general revenues (than payable
benefits). Both statements areliterally accurateand both havethe potential tomislead. Using asinglebaseline is
moretransparentand lesslikely tocause confusion.
To seethe roleofmultiple baselinesintheCommission Report,consider the discussionofModel 2onpages 121
to 129.
When
discussingbenefits,scheduled benefitsarebyand large ignored, appearing only in a footnotein thetable on page 122.
When
discussing financing, only scheduled benefits are discussed. Furthermore, the term"currentlaw"isusedtorefer topayablebenefitsin thetableonbenefitsonpage 122 andtoscheduledbenefitsinthe
figuresonfinancingon pages 125 and 126.
We
donot exploretheimportantissueoftheimpactoftheplansonnational saving. Forapreliminary analysisofthat topic, see Barry Bosworth and Gary Burtless, "Economic and Distributional Effects of the Proposals of
benefits).
The
secondand
third proposals contain changes to the traditional Social Security systemthatwould
restore actuarialbalance in theabsenceofthe individual accountcomponent.
A.
Model
2Proposals for Traditional Benefitsand
theirFinancing
The
future benefit reductions inModel
2 are sufficient to restore actuarial balance toSocial Security with
no
new
sources ofrevenue, while also financingtwo modest
expansions inbenefits for
needy
groups.The
plan accomplishes this objectiveby
changingfrom
the currentwage-indexed
system fordetermining initial benefits atretirement to one that uses a price indexas partofthe determinationofinitialbenefits.
Under
current law, initial retirement benefits are basedon
a worker's average indexedmonthly
earnings(AIME).
AIME,
in turn,is determinedby
takingearnings inpreviousyearsand
scaling
them
up by
subsequent national averagewage
growth.10The
"bend
points" of the formula relating full benefits (the so-calledPrimary
InsuranceAmount)
to earnings are also indexedtoaverage earnings.''Under
this approach, the benefitsystemis designed tomaintainaconstant replacement rate across generations
-
that is, the full retirement benefit as a share of pre-retirement earnings is constant over time for successive cohorts ofworkers
with thesame
earnings relative toaverage earnings.
A
constantreplacement rate across generationsmay
seem
like an abstract concept, but itserves the crucial purpose of allowing beneficiaries to share in the general increase in the
standard-of-livingthat society as a
whole
experiencesfrom one
generation to the next.A
focuson
replacement rates also recognizes the psychologicalphenomenon
by which
familiesbecome
accustomed
to a given level of consumption; substantial declines inincome
during retirement can pose difficultadjustment problems.Moreprecisely, thewage indexing occurs throughtheyearinwhichaworkerturns60. Theinitial benefitlevelis
thusindexed towage growth.After initially claimingbenefits, benefitincreases areindexed topricegrowth. Price
indexing ofbenefitsbeginsaftertheyearinwhicha workerturns62. Thus there isagap withnoindexing,which
The Commission's
proposalwould
alter the current system so that in determining theinitial benefit level, benefits
would keep
pace with price growth, notwage
growth.More
precisely, theproposal
would
multiply the 90 percent, 32 percentand
15 percent factors usedtocompute
the Primary InsuranceAmount
by
the ratio of cumulative price growth to cumulativewage
growthbetween 2008 and
the year inwhich
aworker
becomes
entitled to claim benefits.This approach leads to real benefit levels that are constant over time, rather than increasing in line with real wages. Since real
wage
growth is positive on average, the changewould
reduceinitial benefitlevels
and
the size ofthe reductionwould
increase overtime.The
latest Trustee'sReportprojects long-run growth ofprices of3.0percent peryear and long-run growth oftaxable
wages
of4.1 percent per year.Over
10 years, cumulative pricegrowth
is then90
percent ofwage
growth; over20
years, 81 percent; over40
years,65 percent.1The
implications of the proposedchange
on
benefit levels are dramatic.One
of the President's charges to theCommission was
to preserve the level ofbenefits for retirees and forthose nearing retirement.
The Commission
interpretedthat chargeas applyingtoworkers age 55 and over on January 1, 2002.Under
Model
2, the reductions in benefitswould
thereforebe
phased in startingwith workers
who
were
54 at the beginning of 2002. For each additional yearthat a
worker
isyounger
than 55, thebenefit formula is projected to be reducedby
an additional one percent (approximately-
one
percentis theassumed
ultimaterealwage
growth forthe2001
" In 2002, thePrimary Insurance Amount is equalto 90 percent ofthefirst $592 of
AIME;
32 percentofAIME
over$592and through$3,567; and 15percentof
AIME
over$3,567.The "bendpoints"atwhich the90,32,and 15percentfactorsapplyareindexedtowagegrowth.
12
Theprincipleofprice indexingwassupportedbyapanel on whichDiamondservedin 1974-5(Panel onSocial
SecurityFinancingconsultingtoU.S. Senate Finance Committee). Atthe time,thatprincipleseemedappropriate
since the magnitude ofthe actuarial imbalancewas so severe that itwas difficult to see how Congress would
legislate sufficient benefit reductionsand/orrevenue increases to restore solvency to the system whileretaining
wage indexation. The severity ofthe projected imbalance at that time was underscored by the fact that the
subsequent 1977 legislation was followed very shortly after by the 1983 legislation. According to the 1975
Trustees' Report, the actuarial deficit was 5.32 percent of payroll and the Trust Fund was projected to be
exhausted in fiveyears.
By
1976, the actuarial deficit was up to 7.96 percent, with aslightly later projectedexhaustion. By contrast, the actuarial imbalance is
now
1.87 percentofpayroll and theprojected dateoftrustfund exhaustion is nearly four decades away. Since the financial situationnow is far less severe, a dramatic
alteration in the system is neither needed nor desired. Furthermore, the type ofprice indexingadopted by the
Commission in Model 2 is more severe than the approach proposed by the 1974-5 panel on which Diamond
served. The1974-5panelproposed indexing bothAverageIndexedMonthlyEarningsandthebendpointstoprice
inflation rather than wage growth; that approachwould still allow realbenefit increasesovertime.
By
contrast, theCommission proposal maintainsaconstant realbenefit level. Forfurtherdetailon thealternativeapproaches,see Stephen C. Goss, "Long-Range
OASDI
Financial Effects of a Proposal to CPI-Index Benefits AcrossTrustees' intermediate cost projections, with slightly different
growth
rates in the first ten yearsofthe projection).13
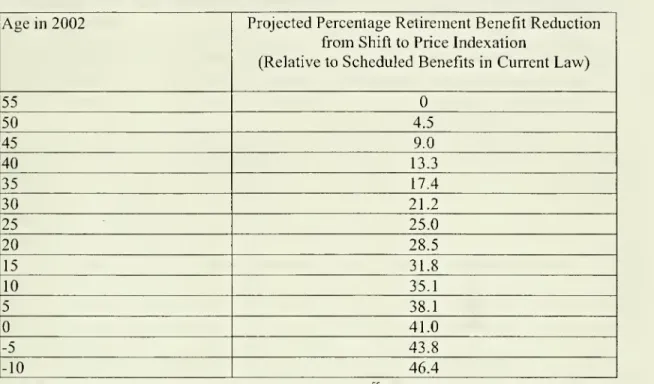
With
these reductionscompounding,
the patternshown
in Table 1 emerges.Thus
a current 35-year oldwould
have
benefits reducedby
17.4 percent under the proposalcompared
to scheduledbenefits under current legislation.The
future benefit level foranewborn
in
2002
would
be reducedby
41.0percentrelative tothe scheduledbenefitlevel.14
The
replacement ratesfrom
Social Securitywould
be reduced'by
corresponding percentages.Under
current law, for example, Social Security is scheduled to replace slightlymore
than36
percent of former earnings forsingle workers with average earnings retiringatage65 in
2025
or thereafter (or equivalently two-earner couples with thesame
earnings each).15Under
Model
2, the replacement ratewould
fall to30
percent for a current 35-year-oldand
to22 percent foranewborn
in2002.The
roleof
the Social Security systemin allowing the elderlytomaintain theirstandard ofliving afterretirement
would
thusdeclinesharplyovertime.The
proposedchange
in the indexation system ismore
than sufficient,by
itself, toeliminate the 75-year actuarial imbalance in Social Security.
We
discuss actuarialbalanceissuesin
more
detail below.Disability
and
Young
SurvivorBenefitsThe
same
benefit formula that is used for retirement benefits is also used for disabilitybenefits.
Thus
the switch to price indexationmeans
that aworker
becoming
entitled todisabilitybenefits in
2020
would
have
disability benefits reducedby
10.7 percent; aworker becoming
entitled in
2040 would have
disability benefitsreducedby
26.4 percent;and
aworker becoming
13
TheTrustees' Report makesyear-by-yearassumptions for 10 yearsand then usesan ultimate assumption of1.0
percent peryearrealwagegrowth fortheremainingyearsto the projection horizon. Inthe2002 Trustees' Report,
theultimaterateof growth ofrealwagesistakentobe 1.1 percent.
Within the traditional 75-year horizon, the largest reduction in retirement benefits would occur for a worker
reaching age 62 in 75 years.
Of
course, such aworker is not yet alive. For such a future worker, the reductionwouldbe almost 50percent. Thereductionsrelative toscheduledbenefitswouldbesomewhatlargerunderthe2002
Trusteesassumptions, becausetheassumedrealwagegrowthrate ishigher thanunderthe2001 assumptions. Under
the2002assumptions, forexample,shifting topriceindexingwouldreducebenefitsfora newbornin 2002 by44.1
percent(comparedto41.0percentunderthe2001 assumptions).
The replacement rates at age 65 are higher but declining during the period that the normal retirement age is
entitled in
2075
would have
disability benefits reducedby
47.5 percent (see Table 2). Yet,many
disabled workers
would have
little opportunity to accumulate substantial balances in theirindividual accounts to offset these benefit reductions
- and
in any case, theywould
notbe
allowedaccesstotheirindividualaccount balancespriortoretirement age.
Since,
on
average, disabled beneficiaries are financially poorlyoff, the proposed changes represent a large reduction in benefits for aneedy
group.16 Furthermore, minorities,on
average, have higher rates of disability than the rest of the populationand
therefore disproportionately benefitfrom
the disability benefits that Social Security provides. For example, Social Security datashow
that 1.1 percentof black workersaged
50-59became
disabled in 1997, relative to 0.6 percent of all workers.17 Blacks account for 13 percent ofworking-age
Americans, but 17 percent of disabledworker
beneficiaries.The
reductions in disability benefitswould
thusio
disproportionately
harm
minorities.The Commission was
aware
of these issuesand
stated explicitly thatsome
other groupneeded
toexamine
disability benefitsand
that "the calculations carried out for thecommission
and
included in this reportassume
that defined benefits willbe
changed
in similarways
for thetwo programs
[OASI
and
DI]. Thisshould
not be taken asa Commission recommendation
for policy implementation.^9 Nonetheless, theCommission
dedicatedno
revenue to financing aFordataonthecircumstancesofthe disabled,see, forexample,VirginiaReno, JerryMashaw,andBillGradison,
eds., Disability: Challenges for Social Insurance, Health Care Financing, and Labor Market Policy (National
AcademyofSocial Insurance: 1997).
Office ofPolicy, Office of Research, Evaluation, and Statistics, Social Security Administration, "Earnings of
Black and Nonblack Workers:
Who
Died orBecameDisabled in 1996 and 1997?" Note No. 2000-01, November2000.
18
A
final pointaboutdisabilitybenefits isworthnoting. Thereduction in disabilitybenefitsrelative to scheduledbenefits from the shift to price indexation would depend on the worker's year of disability, not the year of
entitlementtoretirementbenefits. Thusa20-year-oldworkerin2002
who
claimeddisabilitybenefitsatage40(in2022)wouldexperienceareductionindisabilitybenefitsof12 percentrelative toscheduledbenefit levels-andthat
real benefit levelwould continueafterthe worker reached retirement age. If thatworker continued workinguntil
retirement,however,thereductioninbenefitswould amountto30percent. Entitlementtodisabilitybenefitswould
effectively lock inasmaller benefit reduction(relative toscheduledbenefits)than entitlementtoretirementbenefits.
It isworthnoting,however, thatthereallevelofbenefits(asopposedtothereductionrelative toscheduledbenefits)
wouldbethesameforthedisabled beneficiaryandtheretiredbeneficiary.
The Commission Report states: "DI beneficiaries may not have their full adult lives in which to accumulate a
retirement account, so this is a rationale for maintaining their traditional benefits. However, ifbenefits were
changed for
OASI
but not DI, thismightleadto anincreaseinDI applicants. The Commission urges theCongressto consider the full range ofoptions available for addressing these concerns. In the absence offully developed
proposals, thecalculations carried out forthe commission and included in this report assumethat definedbenefits
will bechangedin similarways forthetwoprograms. Thisshouldnot betaken asa Commission recommendation
more
modest
reduction in disability benefits. Instead, it included dramatic benefit cuts for thedisabled as part of the solution to restoring actuarial balance.
The
reductions in disabilitybenefits included in
Model
2improve
solvencyby
roughly 0.3 percent ofpayroll over the next75 years.20
Without
these large savings,Model
2would
notachieve long-termbalance.Similarly, Social Security also provides benefits to the
young
children ofworkerswho
die (as well as the children of workers
who
become
disabled).The
reduction in the scheduledbenefit formula, described above, has the
same
proportional impacton
benefits foryoung
children as it does
on
disabled workers. Thus, the benefit for surviving childrenwhose
parent died in2020
would
be reducedby
10.7 percent;and
the benefit for a surviving child in2075
would
be reducedby
47.5 percent relative to scheduled benefit levels. African-American childrenwould
be disproportionately affectedby
these benefit reductions; they currentlyconstitute 15 percent of
Americans
under age 18 butmore
than22
percent of the childrenreceiving Social Security survivorbenefits.
As
with disability benefits, the presence of an individual accountwould
notdo
much
tomitigate the benefit reductions for
young
survivors. First,many
workerswould
nothave
time toaccumulate
much
in an individual accountbefore anearly death. Second, ifthe worker's spouseis alive, the account (and the benefit offset
from
the account)would
be available to the spouseonlyafterthe spouseretires,
and
sonotbe available (atleast immediately)forthechildren.forpolicy implementation" StrengtheningSocial SecurityandCreatingPersonal Wealth forAllAmericans,page
149(italicsinoriginal).
"°The
shift to price indexing under Model 2 reduces total benefits (retirement, survivor, and disability) by 2.07
percent ofpayroll overthe next75 years, which is 13.4 percent of scheduledbenefits over thatperiod (underthe
2001 Trustees' intermediate assumptions). Disability benefits aloneamount to 2.23percent ofpayroll. Assuming
that price indexing affects disability benefits proportionately to retirement and otherbenefits, the impact ofthe
disabilityreductionswouldbe 13.4percentof2.23 percent, or0.3percentofpayroll. This estimatedoesnot include theeffects on young survivors, nordoes it include the benefit reductions forthedisabled after theirconversion to
retirement benefitsatthenormal retirement age. FortheDI componentitself,theproportionalityassumptionmay
underestimate the impact on DI because thebenefit reduction depends on the yearofeligibility for benefits, and
meanduration since benefiteligibilityis lowerfor disabilitybeneficiariesthan for retiredworkerbeneficiaries (both
because ofrelativelyhighmortalityrates forDIbeneficiariesand because oftheconversion ofdisabilitybenefits to
retirement benefitsatthenormalretirementage).
On
theotherhand,theDIcostrateincreasesmoreslowlythantheOASI
costrateduring the75-yearprojection period: Underthe2001 assumptions,theDI costrate wasexpectedtorise from 1.45 percent ofpayroll in 2001 to 2.57 percent ofpayroll in 2075, whereas the
OASI
cost rate wasexpectedto rise from9.04percent ofpayroll in2001 to 16.82percentofpayrollin2075. The75-yearcostrate for
DI is thussomewhat more front-loaded thanthe 75-yearcostrateforOASI, which wouldcausetheproportionality
assumption to overestimate the impact on DI (since the benefit reductions are larger for later years of initial
Long-Career
Low
EarnersFor
many
families, living standards in retirement are considerablybelow
those enjoyedbefore retirement. Social Security-is supposed to mitigate the drop in living standards for
families
who
have
not saved sufficientlyon
theirown.
Concern
about the potential declines inliving standards
upon
retirement is a reason for focusingon
replacement rates at all earningslevels.
But
the issue is ofparticularconcern with regardtolow
earners, since a decline in theirincome
could threaten the ability to secure basic necessities. This concern motivates proposalstoraise Social Security benefits for
low
earners.A
complication intryingto targetbenefit increaseson
thosewho
areneedy
is that retiredworker
benefits are basedon
a worker's earnings record; the system for determining benefitsdoes not fully reflect family circumstances.
The
Supplemental SecurityIncome
(SSI)program
does take intoconsideration family circumstances
and
puts a floorunder
the living standards of those age 65and
older, but themaximum
benefit level under SSI isbelow
the official povertyline.21
More
pressingin the context ofalong-termprogram
such as Social Security, theofficialpovertyline increasesonly with inflation, resulting in apoverty linethat falls further
and
furtherbehind averageearnings over time(given positivereal
wage
growth).The Commission
has recognized these issues and proposed to usesome
ofthe revenue savedby
the benefit reductions described above to raise benefits for workers withlow
earningswho
have had
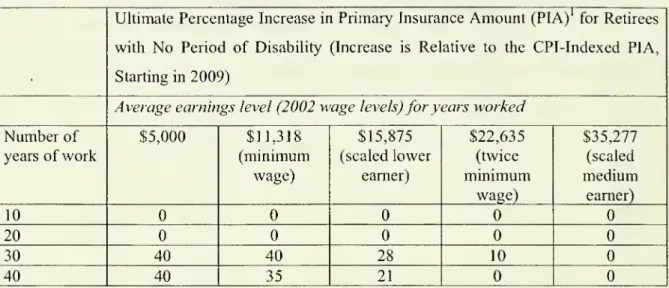
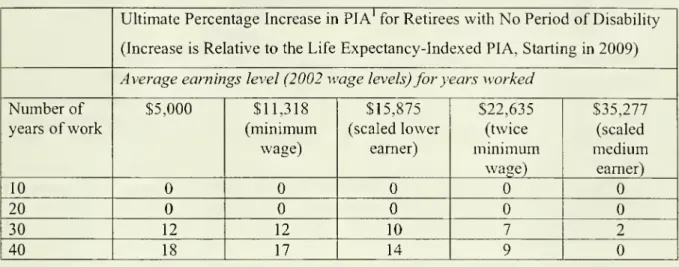
earnings in at least 20 years.The
details ofthe proposal areshown
in Table 3.The maximal
percentage increase of40
percent is not sufficient to offset the reduction intraditional benefits
from
price indexing for workersyounger
than 20.22 Unfortunately, the21
The
maximum
federal SSIbenefit, $545permonth foranindividualand $817 foracouplein2002. Theofficialpoverty thresholdforanelderlycouple in2001 was$10,705,or$892permonth. The figurefor2002islikely tobe
approximately$920 permonth.
Many
analysts, furthermore, believe theofficial povertythreshold is too low. Forfurtherdiscussionoftheproblems withthe officialpovertythreshold,seeConstanceF.Citroand RobertT. Michael,
ed.,MeasuringPoverty:A
New
Approach (NationalAcademyPress: 1995). SomestatessupplementthefederalSSIpayment,buttheamountsvarybystate.
Workers
who
are youngerthan 20experiencemorethan a 28.6percent declineintheirPIA,which is thecriticalthreshold for determining whether benefits are higher orlower than under the current benefit formula. (Solving
Commission
did notprovide a detailed analysisof
the impact ofthis proposalon
the distributionof
income
levels.But
regardless of the precise effects, the existence of the proposal underscorestheCommission's
validconcern aboutthe plightoflowerearners in retirement.Widows
andWidowers
Just as Social Security isdesignedto mitigate a declinein living standards
when
aworker
is disabled or retires, so too it is designed to mitigate a drop in living standards of family
members
when
aworker
orretiree dies. Social Security provides benefits tothe elderly spouses of deceased workers. It also provides benefits to theyoung
children ofworkerswho
die, as discussed above.Although
theCommission
did not address issues raisedby
the deaths of workers withyoung
children, it didmake
a proposal for thewidows
and
widowers
ofretiredworkers.
Under
current law, the survivor receives a benefit equal tobetween 50
percentand
67 percent ofthecombined
benefits ofthe couple before the death.The Commission
proposes instead that in the event of the death of aworker
after retirement, the benefit ofthe surviving spousewould
be at least as large as 75 percent ofthecombined
benefits ofhusband and
wife before the death.25However,
this provisionwould
be limited to benefit increases that did notraisethe benefit level
above
the averagePIA
ofretiredworkers. InDecember
2000, theaveragePIA
of retired workerswas
$851,which
would
correspond to an annual benefit of$10,214
if1.4x=1.0givesx=.714,which implies a28.6 percent declineinPIA. Forlong-careerlow-incomeworkers younger
than 20,thespecificbenefitexpansionisthereforemorethanoffsetbythe general reductioninbenefitsunderModel
2.)
Theimpact ofthe proposal, whileprogressive, would appeartobe relativelymodest. Overthe 75-yearhorizon,
for example, its cost amounts to roughly 6.5 percent of the cost savings from the shift to price indexation for
determininginitialbenefits. Furthermore,theproposalisdefined intermsofapercentage ofthePrimary Insurance
Amount (PIA), which is the benefit level received by a worker claiming benefits at theNormal Retirement Age (NRA). Thus the annual costofthe proposal gets steadily smaller relative to the annual cost savings fromprice
indexing(since priceindexing reducesthePIAby increasingamounts,which alsoreducesthecostoftheexpanded
benefit).
The survivor's benefit is reduced ifthe survivor claims it before the normal retirement age, and can also be
reduced iftheprimaryworker had claimed benefits before the normal retirement age (or increased iftheprimary
workerhad claimed benefits after the normal retirement age). For further discussion, see David Weaver, "The
Widow(er)'s LimitProvisionofSocial Security,"SocialSecurityBulletin,Vol. 64,No. 1,2001/2002, pages 1-15.
benefits
were
claimed at thenormal
retirement age.26Even
with this increase in survivorbenefits relative to
worker and
spouse benefits, the steady declinefrom
price indexation inworker
and spousal traditional benefitswould
eventually be larger than the increasefrom
thisadjustment.
Thus
widow
andwidower
benefitswould
eventuallybe lowerthan those scheduledincurrentlaw.
Analysts ofSocial Security have longbeen concerned about the drop in living standards ofthe surviving spouse
upon
the death ofa retired worker. Indeed, survivingwidows
typicallysuffer a 30 percentdrop in living standards(income relative to a
measure
ofneeds).27Moreover,
although the poverty rates for elderly married couples are approximately 5 percent, the poverty
rates forelderly
widows
aremore
than three times as large.Basing
the benefits ofa survivoron
the benefits thathad been
receivedby
the couple is a sensible approach to theproblem
of29
trying tomaintainliving standards.
ActuarialBalance
The
reduction in retirement, survivor, and disability benefitsfrom
the change to price indexing,combined
with themodest
increases inbenefits for long-careerlow
earnersand
some
widows
and widowers
withlow
benefits, produces the impacton
actuarial balanceshown
inTable 4.
The
shift to price indexing reduces benefitsby
somuch
that it is possible to devote a26
The PIA figure is taken from Table 5.CI of the draft Annual Statistical Supplement 2001, available at
http://www.ssa.gov/statistics/Supplement/2001/index.htmI.
11
Karen Holden and Cathleen Zick, "Insuring against the Consequences ofWidowhood in a Reformed Social
Security System," in R. Douglas Arnold, Michael J. Graetz, and AliciaH. Munnell, FramingtheSocial Security
Debate: Values,Politics,andEconomics(NationalAcademyofSocial Insurance: 1998),pages 157-181.
28
Melissa M. Favreault,Frank J. Sammartino, and C. Eugene Steuerle, "Social Security Benefitsfor Spouses and
Survivors," in Melissa M. Favreault, Frank J. Sammartino, and C. Eugene Steuerle, eds., Social Security andthe
Family(UrbanInstitutePress:2002),Table6.1,page 183. 29
AlthoughtheBush Commission'sproposalisa step intherightdirection, restrictingittolow-benefit survivorsis
unduly restrictive. Indeed, the cost ofthis proposal is only fourpercent ofthecost savings from thereduction in
benefitsfrompriceindexing. Previousproposals,forexampleby Burkhauser and Smeeding,wouldnothavelimited
the survivor benefit expansion to those with low benefits. In particular, Burkhauser and Smeeding proposed an
increase in survivor benefits for all elderly survivors, and suggested financing this increase by reducing spousal
benefits,thereby tendingto transferbenefitsfromthetimewhenbothhusbandand wifewerealive tothetimewhen
just one was. (See Richard Burkhauser and Timothy Smeeding, "Social Security Reform:
A
Budget-NeutralApproach to Older Women's Disproportionate Risk ofPoverty," Center for Policy Research, Maxwell School,
SyracuseUniversity, 1994.) TheGramlichplanfromthe 1994-1996 Advisory Council proposedasimilarapproach.
"Option II: Publicly-Held Individual Accounts," Report ofthe 1994-1996Advisory Council on Social Security,
VolumeI: Findings andRecommendations,pages28-29.
tenth ofthecost savings to increased benefits for
some
groups withlow
benefitsand
still restoreactuarialbalance.
Moreover,
since benefitlevelsaresomuch
lowerthan scheduledbenefits after75 years
and
since furtherbenefit reductionswould
follow in lateryears,this systemwould
beinpermanent
balance:The
passage of time itself, withunchanged economic and demographic
assumptions,
would
notproducelargerdeficits.In
summary,
Model
2 partially substitutes price indexing forwage
indexing indetermining initial benefits. It represents a shift in the focus of Social Security
away
from
itsrole inpreservinglivingstandards of workers
and
theirfamilies attimes ofretirement, disability,or death
and
to a lesser role of providing benefits that would,on
average, lag behind earnings. Thismodel
shows
clearly the implications of trying to close the long-term Social Securityactuarial deficit solely
by
benefit reductions.Although
it incorporates onlyone
particularpatternof
how
benefits could be reduced for workers born in different years, it illustrates the broader implications ofclosing the actuarial deficit purelyby
benefit reductions.Not
surprisingly, such an approach involves dramatic reductions relative to scheduled benefits.No
fundingwas
provided to lessen these dramatic reductions for beneficiaries with little or
no
ability todraw
upon
an individualaccount, suchas thedisabledand
young
survivors.B.
Model
3Proposals forTraditional Benefitsand
theirFinancing
Model
2is anexample
ofhow much
benefitsmust
be reduced torestore actuarial balanceifthere are
no
additional revenuesdevotedto Social Security.Model
3 insteadassumes
thatone-third ofthe actuarial deficit will
be
coveredby
new
dedicated revenues. It then eliminates therest of the actuarial imbalance
by
reducingmonthly
benefits in line withimprovements
inmortality (i.e., it reduces
monthly
benefits tofully offsetthe costof
providing benefits for longer expectedlives inretirement) along with additional reductionsforearlyretireesand
high earners.Life expectancy is expected to continue toincrease in the next 75 years.
Such
increaseshave
longbeen
part ofthe projections ofthe Office oftheChief
Actuary at Social Security.30The Social Security projectionshave been criticized bysome asunderestimating the futuredecline in mortality
rates. Forexample, the 1999 Technical PanelonAssumptionsandMethods ofthe Social SecurityAdvisoryBoard
Thatraises thequestion of
whether
the structureofSocial Security shouldreflectthis expectation of longer life expectancies.To some
degree, Social Security already reflects increasing lifeexpectancies.
The
discussion surrounding the 1983 reforms related the legislated increases inthe
normal
retirement age(NRA)
to projected increases in life expectancy. Nonetheless, itremains a legitimate question to ask
whether
Social Security shouldbe
modified further inresponse totheexpectedincreasesin lifeexpectancy.
First,
we
can askhow
an individual might sensibly adapt ifhe or she learned early in acareer that life expectancy
was
longer than had been previously thought.Such
an individualwould
recognize that theprevious plan of(1)consumption
and
savingwhile working, (2) an ageofretirement,
and
(3) aconsumption
plan after retirementwas
no
longer feasible.31Given
theincrease in life expectancy, it
would
no
longerbepossible toconsume
asmuch
each yearduringa career, retire at the
same
age, andconsume
asmuch
each year during retirement.A
sensibleapproach
would
have
the individualadjust all three marginsthat are available. Inotherwords,asensible individual
would
savesomewhat more
whileworking (consume
somewhat
less),work
somewhat
longer, andconsume
somewhat
lessper yearinretirement.Social Security allows individuals to enjoy larger
monthly
benefitsby
delaying the startof benefits
-
so the deferral option is already incorporated in Social Security. Indeed, for atypical 62-year-old
worker
(which is themost
common
age forclaimingbenefits), the increaseinbenefits
from
a delayed startroughly offsets the loss inbenefits.32 ForSocial Security to includethe other
two
responses toa longerexpected lifewould
call for increased payroll taxesand
lowerbenefits. Indeed,
one
could design apackage
of slowly increasing taxesand
a slowlydecreasingbenefits formula that couldbalance these
two
responses.The Commission
did not approach theissue in this
way,
however.underestimatefuturelifeexpectancies. 1999TechnicalPanelonAssumptionsandMethods(Washington:November
1999).
Anotherpossiblemarginistoreduceplannedbequests.
Forfurtherdiscussion ofthe actuarial adjustments in Social Securityand theireffects on claiming behavior, see
CourtneyCoile, PeterDiamond,JonathanGruber,and AlainJousten,"DelaysinClaimingSocial Security Benefits,"
NBER
WorkingPaperW73
18, August 1999.After recognizing the trend increase in life expectancy,
Model
3 proposes to reduce scheduledbenefits to fully offsetthe impact ofthe currently expected increasein lifeexpectancyon
Social Security outlays.The
particular proposal is to reduce benefits in line with actuarialcalculations for each
new
group of potential retirees.Given
current actuarial projections, thiscalls for a reduction in scheduled benefits of I/2 of 1 percent for each later year ofbirth.
The
implications of such reductions are
shown
inTable 5.For
example, a current 35-year oldwould
have
a 9.5 percent cut relative to scheduled benefitsunder
this proposal.A
currentnewborn
would
experiencea24.1 percent reduction.Note
that theCommission's
approachwould
be
implemented
even in yearswhen
thenormal
retirement age is being increased under current law, supposedly also in response toincreased life expectancy
-
a double reduction for thesame
cause.Presumably
both of these reductions should nothappen
at thesame
time.Whatever
the motivation orjustification, the benefit reductionsfrom
this provision are projected tohappen
at roughly one-halfthe rate of benefitreductionsinModel
2.33
Actuarial Reductionand
Delayed
RetirementCreditThe
benefitsfor a retiringworker depend on
theage atwhich
aworker'sbenefitsstart. Ifa
worker
claims benefits at theNRA,
which
is slowly increasingfrom
age 65 to age 67under
current law, benefits are equal to the PIA. Ifa
worker
claims benefits at an earlier age, the benefits arereducedby
a factor thatis called the actuarial reduction.When
theNRA
was
65, aworker
claiming benefits at age 62would have
received 80 percent of the PIA.Under
current law, claiming benefits at age 62 results in 77.5 percent ofthePIA
since theNRA
isnow
above
age 65; as the
NRA
increases further under current law, that percentage will decline to70
percent (for workers turning age 62 in
2022
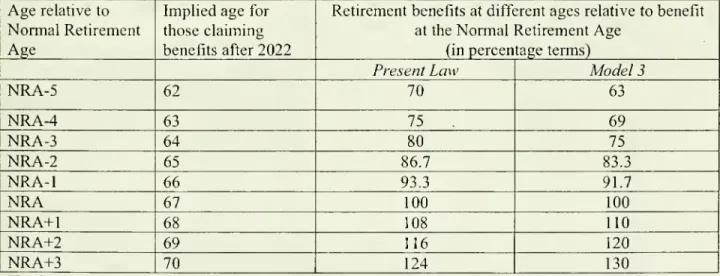
or later).Model
3 includes a further reduction of benefitsforworkerswho
starttheirbenefits beforetheNRA,
asshown
inTable 6.The procedure forupdating thebenefit adjustments for mortality shifts is somewhatunclear. In particular, the
Report states that the "adjustment wouldbe based on actual changes in period tables 10 years prior." Itremains
unclear whether the adjustment would be automatic, left to the discretion ofthe actuaries, or require legislative
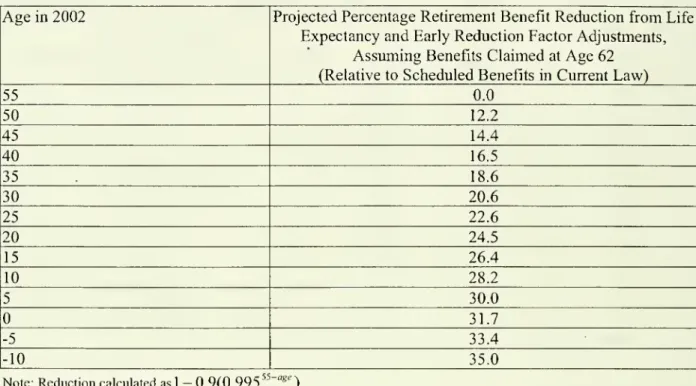
Since
most
workers retire before thenormal
retirement age, theywould
experience largerbenefit reductions than
shown
in Table 5. In 1999, for example, 69 percent ofmen
and 73 percent ofwomen
claimedbenefitsbefore age65. Table 7shows
thereductions forretirementat age 62,
combining
the adjustments for life expectancy with thechange
in the actuarialreduction. .
(Model
3 alsoincorporatesotherchangesdescribedbelow.)While
acurrent 35-yearold
would
havea 9.5percent reductionfrom
scheduled benefits ifclaiming benefits attheNRA,
thereductionwould
be 18.6 percent ifbenefitswere
claimed at age 62.A
newborn
todaywould
experience a 24.1 percent reduction in benefits if claiming benefits at the
NRA,
and
a 31.7 percent reduction ifclaiming benefits at age 62.Reducing
benefits for 62-year oldsby
more
than forworkersretiringatlaterages isan incentiveto continueworking.35
Once
aworker
reaches theNRA,
benefits can be claimedwhether
theworker
retires ornot. Ifa
worker
delaysthe startofbenefits,benefits are largeronce
theydo
startbecause oftheDelayed
Retirement Credit(DRC).
Under
Model
3, theDelayed
Retirement Credit is increasedrelative to current law. In the absence of
major
behavioral changes, however, the increase islikely to affectvery
few
workers-
only thosewho
have
not claimedbenefits already. In 1999,only 7 percent of
new
retirement benefitswere
claimedby workers
age 66 orolder.37Moreover,
since benefits can
be
claimed ordelayedwhether
working
or retired, the increase in benefits fordelays
beyond
theNRA
does not noticeablyaffectthe incentive tocontinueworking.Lower
Benefits forHigh
EarnersModel
3 includes a reduction in the benefit formula for high earners, with the marginal benefit rate goingfrom
15 percent to 10 percent for the highest tier of covered earnings.38 (Inother words, an increase of $1 in averaged indexed
monthly
earnings in the highest earnings34
Committee on
Ways
and Means, 2000 Green Book, Table 1-13, page 53 (Government Printing Office:Washington,2000).
Of
course, such an incentivecould alsohavebeen achieved by increasing benefits forthose retiring laterratherthandecreasing benefitsforthoseretiringsooner.
Before the
NRA,
anearnings testlimits theability of workers to claim benefitswhile continuing towork. SeeJonathan Gruber andPeterOrszag, "WhatTo
Do
Aboutthe Social Security EarningsTest," Issue in BriefNumber1,CenterforRetirementResearch,BostonCollege, July 1999.
Committee on
Ways
and Means, 2000 Green Book, Table 1-14, page 53 (Government Printing Office:Washington,2000).
38
range
would
raise themonthly
benefit levelby
10 cents, rather than 15 cents as under current law.) This reduction is a progressive contribution to actuarial solvency: It reduces benefitsby
more
for higher earners than forlower earners,and
is expected toeliminate slightly less than 10 percentofthecurrent 75-yearactuarial imbalance intheprogram.Disabled
Workers and
SurvivingChildrenAs
withModel
2, the benefit reductions areassumed
to apply to the children of deceased workersand
to the disabledand
their dependents for actuarial scoring.Thus
a 20-year oldworker
todaybecoming
disabled atage40
(in 2022)would
experience a 7 percent reduction inbenefits,
and
aworker becoming
disabled in2075
would
experience a29
percent reduction inbenefits (Table 8).
The same
effectswould
apply to the childrenof
deceasedand
disabled workers.As
withModel
2, theCommission
failed to provide funding for mitigating theseeffects.
Long-Career
Low
Earnersand
Widows/Widowers
As
underModel
2,Model
3 contains proposals to increase benefits forlow
earnersand
survivingspouses with
low
benefits.39With
thebenefitreductions inModel
3 being smallerthan benefit reductions inModel
2, the increase in benefits forlow
earners is smaller in percentage terms (since the expansion is intended to provide at least the poverty level of income,and
since base benefits are higherunder
Model
3).The
details of this proposal are in Table 9.The
maximal
percentage increase of 18 percentis not sufficient to offset the reductions in traditionalbenefits for workers
who
are22
oryounger
who
claim benefits atthenormal
retirement age or workersyounger
than43who
claimbenefitsat age 62.The
proposalforsurviving spouses isthesame
as inModel
2.Even
with this increase in survivor benefits relative toworker and
spousebenefits, the steady decline in traditional benefits for workers
and
spouseswould
eventuallybe
larger than the increase
from
this adjustment.Thus
widow
and
widower
benefitswould
eventually be lower than those scheduled in current law.
The
cost of thetwo
proposals isroughly the
same
forModel
3 as forModel
2.Actuarial Balance
The
reduction in retirement, disability,and
survivor benefitsfrom
indexing the benefit formula forlife expectancy,combined
with thechanges inthe actuarialreduction factor, delayed retirement credit, benefits for high earners and the increases in benefits for long-careerlow
earners and
widows
andwidowers
withlow
benefits, generates the 1.31 percent of payrollimprovement
in actuarial balanceshown
in Table 10.However,
these changes,by
themselves,arenot sufficienttorestore actuarialbalance:
The
actuarial imbalance remainingamounts
to 0.55percentofpayroll.
To
eliminate the remaining imbalance,Model
3 proposes an increase in revenues dedicated to Social Security, sufficient to cover roughly one-third ofthe actuarial deficit.The
Commission
does notrecommend
any
particular source for these revenues.However,
it doesscore the dedicated revenues as ifthey
came
from
an increase in themaximum
earnings subjectto payroll taxation
and
a transfer ofsome
ofthe revenuefrom
theincome
taxation ofbenefitsfrom
Medicare
to Social Security.40The
Commission
does not indicatehow
to avoiddeterioration in Medicare's financial position in response to the loss
of
revenues under thisapproach.41
As
withModel
2, since benefit levels are somuch
lower than scheduled benefits in 75 yearsand
since furtherbenefit reductionswould
follow in later years, this systemwould
notgo
Thescoringofthe transfersassumedthatthepercentageof coveredearnings subjecttotaxincreasedto86percent
between2005 and 2009, andwas thenmaintainedatthat level thereafter. Therevenues transferredfromMedicare
to Social Security werephased in between2010 and 2019. Undercurrent law, Social Security beneficiaries with
modified adjusted gross income above $25,000 if single or $32,000 ifmarriedhave partoftheir Social Security
benefits includedinincomefortax purposes. Forincome abovetheselevels, 50percentofSocial Security benefits
areincludedin incomefortaxpurposes. The incometaxderivedfromincluding these benefitsintaxableincome is
creditedtothe Social Security TrustFund. Forthehighest-incomebeneficiaries(thosewith incomesabove$34,000
ifsingle or $44,000 ifmarried), up to 85 percent ofSocial Security benefits can be included in income for tax
purposes.
Any
income taxderived fromincludingmorethan 50percentofbenefitsin taxableincomeiscreditedtotheMedicareTrustFund.
In what may be the only dissenting word in the Report, "Some members ofthe Commission believed that a
substantialportion ofthis 0.63%shouldcome froman increase inthe payroll tax base....However, this suggestion
wasdeemedinconsistentwiththeprinciplesintheexecutive order establishing theCommission."(footnote 41,page
131).
out of balancejust
from
the passageof
time (assumingunchanged economic and demographic
assumptions).
II. Introduction of Individual
Accounts
Following the charge to the
Commission,
the Report presents a design for individual accountsthat isusedin allthree reform models.We
beginby
consideringthe generalstructure ofthe proposed accounts.
Then
we
considerthe effectson
actuarial balance, TrustFund
balances, Treasuryborrowing
from
the public,and worker
assetsand
benefits.In broadterms,
workers
underall three planswould
be giventhe option ofhavingpartoftheir payroll taxes deposited into individual accounts.
The
individual account systemwould
involve
two
components: the individual account assets,which
would
containa worker's deposits and the accumulated earningson
them,and
a"liabilityaccount." Ifaworker
chose to participate inthe individual account system, the portion ofhis orher payroll taxes diverted intothe accountwould
accumulate during the worker's career,and
be available to theworker
upon
retirement. Since therevenue diverted to this accountwould
reduce the financing available to the traditionalSocial Security system, a liability account
would
alsobe
created. This liability account accumulates theamounts
diverted plus interestand
so determines the debtowed
back
to Social Security because ofthe diverted funds.Upon
retirement, the debtwould
be repaidby
reducingtraditional Social Securitybenefits.
A.
Account
Specification-
AssetAccumulation
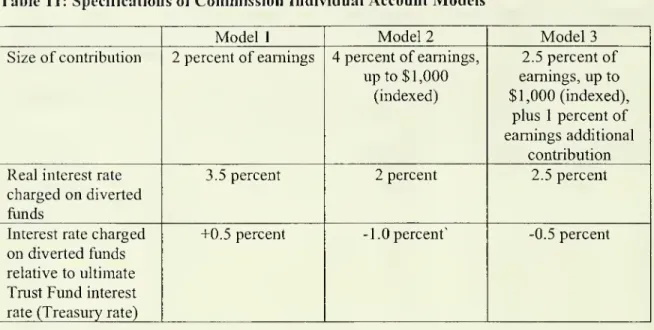
In all three models, workers are given the option of having part oftheir payroll taxes deposited into theirindividual accounts.
These
diverted fundsareused
topurchase assets from alimited
menu
ofalternatives, withone
menu
organizedby
thegovernment
forthose with small accounts (Tier I) and additional choicesfrom
private providers for those with larger accounts (Tier II).The
Tier I structure ismodeled on
the Thrift Savings Plan that handles defined contribution accounts for federal civil servants.Under
this tier,workers
could chooseamong
nine differentmutual funds.42 Forthosewith balances
above
$5,000 (adjustableinthe future, but without specifiedrules), therewould
be a furtheroption ofmoving
the entire balance outofTierI and investing with a private fund manager.
These
fundmanagers
could offerthesame
optionsas in Tier I
and
could offer additional options, although the latterwould
be restricted to bewidely diversified funds.
In assessing the implications ofthebalances in these accounts, the
Commission
assumes
that Treasury
bonds
would
have
a 3 percent gross annual real yield, corporatebonds
a 3.5percent gross annual real yield,
and
stocks a 6.5 percent gross annual real yield. All threenumbers
are reasonableand
consistent with the 3 percent real interest rate assumption usedby
the actuaries in assessing the evolution oftheTrust Fund.43 In converting grossyields to yields
net of transaction costs, the
Commission
assumes
an annual charge of 30 basis points (0.3percent) of assets under
management.
Such
an administrative cost cumulativelyconsumes
roughly six percent of the account balance at the
end
of a 40-year career relative tono
administrative charges. Several issues arise in considering this estimate for the administrative charges.4
First, in the early years, setting
up
the initial set of accountswould
involve additionalone-timecosts, and the
assumed
30 basispoint chargescouldnotcrediblycoverthese costs.The
Commission
ignores this short-runproblem, focusingon
a long runwhen
theaccountswould
belarger.
42
An
individual couldput all ofthe accountinto one ofthe three balanced funds (which combine equities withfixed-income assets, and vary in thepercentage in stocks). Or an individual could divide theaccount among six
mutual funds (large stocks, small stocks, foreign stocks, corporate bonds, Treasury bonds, and inflation-indexed
Treasury bonds). Information about the Tier I accounts would be available online and by automated phone, but
written statements wouldbe sentonlyonce peryear. Changesto the allocationofeitherexistingbalances ornew
deposits wouldalso be allowedonceper year. Collectionof revenuesand allocationto individual accountswould
bedoneinconformity withcurrent payroll taxcollection,implyingthat therewouldbesignificant lagsbetweenthe
transmission oftaxes by the worker's employer and when the funds were invested as the worker designates. In
addition, individualspayingtaxesatdifferenttimesoftheyearwouldallbetreated asiftheypaidtaxesatthesame
time.
Theassumption onstocks does not address the likelihoodthat stock returnswill be much lowerin theshort
run thaninthelongrun.
On
stockreturns, see PeterA.Diamond,"WhatStockMarketReturnstoExpectfortheFuture?" Social SecurityBulletin,2000and SocialSecurityAdvisory Board, EstimatingtheReal RateofReturn
onStocksOvertheLong Term,Washington,DC,August2001
.
For more discussion of administrative costs, see Peter A. Diamond, "Administrative Costs and Equilibrium
Charges with Individual Accounts, " in John Shoven (ed.), AdministrativeCosts andSocial Security Privatization