Publisher’s version / Version de l'éditeur:
Toxicon, 51, 6, pp. 1081-1089, 2008-06
READ THESE TERMS AND CONDITIONS CAREFULLY BEFORE USING THIS WEBSITE.
https://nrc-publications.canada.ca/eng/copyright
Vous avez des questions? Nous pouvons vous aider. Pour communiquer directement avec un auteur, consultez la première page de la revue dans laquelle son article a été publié afin de trouver ses coordonnées. Si vous n’arrivez pas à les repérer, communiquez avec nous à PublicationsArchive-ArchivesPublications@nrc-cnrc.gc.ca.
Questions? Contact the NRC Publications Archive team at
PublicationsArchive-ArchivesPublications@nrc-cnrc.gc.ca. If you wish to email the authors directly, please see the first page of the publication for their contact information.
NRC Publications Archive
Archives des publications du CNRC
This publication could be one of several versions: author’s original, accepted manuscript or the publisher’s version. / La version de cette publication peut être l’une des suivantes : la version prépublication de l’auteur, la version acceptée du manuscrit ou la version de l’éditeur.
For the publisher’s version, please access the DOI link below./ Pour consulter la version de l’éditeur, utilisez le lien DOI ci-dessous.
https://doi.org/10.1016/j.toxicon.2008.01.009
Access and use of this website and the material on it are subject to the Terms and Conditions set forth at
Effects of cooking and heat treatment on concentration and tissue distribution of azaspiracids, okadaic acid and dinophysistoxin-2 in mussels (Mytilus edulis)
McCarron, Pearse; Kilcoyne, Jane; Hess, Philipp
https://publications-cnrc.canada.ca/fra/droits
L’accès à ce site Web et l’utilisation de son contenu sont assujettis aux conditions présentées dans le site
LISEZ CES CONDITIONS ATTENTIVEMENT AVANT D’UTILISER CE SITE WEB.
NRC Publications Record / Notice d'Archives des publications de CNRC:
https://nrc-publications.canada.ca/eng/view/object/?id=7d137211-69bf-4607-85ea-0a4f495a5662 https://publications-cnrc.canada.ca/fra/voir/objet/?id=7d137211-69bf-4607-85ea-0a4f495a5662
Effects of cooking and heat treatment on concentration and tissue distribution of azaspiracids, okadaic acid and dinophysistoxin-2 in mussels (Mytilus edulis) 1 2 3 4 5 6 7 8
Pearse McCarron1,2, Jane Kilcoyne1, Philipp Hess1
1
Marine Institute, Marine Environment and Food Safety Services, Rinville, Oranmore, Co. Galway, Ireland
2
University College Dublin, Conway Institute, Belfield, Dublin 4, Ireland 9 10 11 12 13 14 15 16 17 18 19 20 21 22 23 24 25 26 27 28 29 30 31 32 33 34
* corresponding author e-mail: pearse.mccarron@marine.ie
Abstract
Using high performance liquid chromatography with mass spectrometry the influence of conventional steaming and other heat treatments on the level of azaspiracids, okadaic acid and dinophysistoxin-2 in mussels (Mytilus edulis) was investigated. A prior study looking at the influence of steaming on the concentration and distribution of azaspiracids showed significant increases in concentration as a result. Described is a follow-up study using two separate mussel samples, where the contribution of water loss during steaming to increases of toxin levels was examined.
In addition to water loss it was demonstrated that heating of fresh azaspiracid contaminated mussels resulted in significant increases in the quantity of the desmethyl analogue (azaspiracid-3) measured. A systematic heat treatment experiment confirmed these findings and showed that azaspiracid-3 was the most thermally instable of the three regulated azaspiracid analogues.
In parallel, the same studies were carried out for okadaic acid and dinophysistoxin-2 also naturally present in the samples used. Concentration increases correlated with water loss during steaming. More so than for azaspiracids, increased distribution of okadaic acid and dinophysistoxin-2 from the digestive glands to the remainder tissues was observed as a result of the processes examined. This suggests that analysis of whole flesh tissues, as opposed to dissected digestive glands, is more appropriate for regulatory purposes, particularly if cooked samples are being analysed. The findings of the studies reported here have importance in terms of the methodology applied in regulatory phycotoxin monitoring programmes. Therefore, options for sample pre-treatment are discussed.
Keywords 1 2 3 4 5 6 7 8 9 10 11 12 13 14 15 16 17 18 19 20 21 22 23 24 25 26 27 28 29 30 31 32 33 34
Shellfish toxins; Processing; Pretreatment; Azaspiracid poisoning; Diarrhetic shellfish poisoning; Food safety.
Introduction
The accumulation in bivalve shellfish of toxins originating from marine phytoplankton has serious implications for human health. Numerous classes of toxins have been identified, which, after consumption of contaminated tissues induce a variety of symptoms in humans including nausea, abdominal cramps, diarrhoea, memory loss, and in some extreme cases paralysis and even death.
The toxins responsible for diarrhetic shellfish poisoning (DSP) have had a severe impact on the shellfish industry internationally. The first occurrence of DSP was reported in Japan during the 1970s (Yasumoto et al., 1978). DSP is a severe gastrointestinal illness that typically follows ingestion of shellfish contaminated with toxigenic dinoflagellates such as certain Dinophysis and Prorocentrum species (Quilliam, 1995). The main toxins responsible are okadaic acid (OA), which was first isolated from sponges (Tachibana et al., 1981), dinophysistoxin-1 (DTX1) isolated from mussels in Japan (Murata et al., 1982) and dinophysistoxin-2 (DTX2) initially isolated from Irish mussels (Hu et al., 1992). Additionally, a range of acyl and diol ester derivates of these three compounds have been identified (Marr et al., 1992). The European Union (EU) regulates the maximum allowable level of DSP toxins in shellfish at 160 µg/kg OA-equivalents (Regulation (EC) No. 853/2004). In Ireland the OA and DTX2 isomers are regularly detected well in excess of the regulatory levels in mussels (Hess et al., 2003), while only trace amounts of DTX1 have been reported (Carmody et al., 1995). Since summer 2006 the Marine Institute has been applying a relative toxicity factor of 0.6 for DTX2 based on the findings of Aune et
al. (2007) when calculating OA-equivalents.
Azaspiracids (AZAs) are a more recently discovered class of compounds that induce similar symptoms to DSP toxins (McMahon and Silke, 1996). While AZAs were initially reported in Ireland, they have since been detected in various European locations (Hess et al., 2005.), and more recently in Canada (MA Quilliam, personal communication) and Morocco (Taleb et al., 2006). AZA1 was discovered after the first poisoning events (Satake et al., 1998) and since the discovery of methyl (AZA2) and desmethyl (AZA3) analogues (Ofuji et al., 1999), 8 additional hydroxy AZA
analogues have also been reported (Ofuji et al., 2001, Brombacher et al., 2002, James
et al., 2003). Further AZA analogues have been identified and structural elucidation is
underway (Rehmann et al., 2007). Within the EU the maximum allowable level of AZAs in shellfish, similarly to the DSP toxins, is 160 µg/kg AZA-equivalents. This regulation only includes AZA1, -2 and -3, as only these analogues have been found present at concentrations sufficient to pose a risk to human health, and also due to the limited toxicological information available for the other AZAs. Toxic equivalence factors of 0.55 and 0.7 have been reported for AZA2 and -3 respectively in comparison with AZA1 (Ofuji et al., 1999).
1 2 3 4 5 6 7 8 9 10 11 12 13 14 15 16 17 18 19 20 21 22 23 24 25 26 27 28 29 30 31 32 33
While the official reference method for DSP toxins in the EU is the mouse bioassay, its replacement with chemical testing methods will be facilitated by the recent organisation of at least two LC-MS method validation studies for lipophilic toxins in the EU (BIOTOX 2007; CRL 2007), which are on-going. Aspects of the methodology currently used vary between the monitoring programmes of different countries. One important aspect is sample pre-treatment. Most programmes analyse raw mussels, e.g. Ireland and Norway, however, some countries cook the mussels before analysis, e.g. Denmark (Jorgensen et al., 2004) and Germany (LFGB 2006), by light steaming to open the shell and stabilise the matrix. Cooking, boiling or steaming are also common steps in commercial processing, as well as in the culinary preparation of molluscs and crustaceans.
Recent studies have examined the influence of cooking on various toxins in mussels. Reductions in the extractable levels of YTX from Greenshell™ mussels (Perna canaliculus) have been reported after steaming (Holland et al., 2004). Conventional steaming of mussels (Mytilus edulis) contaminated with domoic acid had a minimal effect on the result of whole mussel tissue analysis (McCarron and Hess, 2006). Work by Vieites et al. (1999) showed that a canning process resulted in a significant and reproducible reduction of PSP toxicity in naturally contaminated mussel (Mytilus galloprovincialis). Considerable increases in AZA toxin concentrations upon steaming fresh mussels were reported (Hess et al., 2005). This change was attributed to water loss during steaming, with the AZAs concentrating by a factor of ca. 2 in the cooked tissue as a result. No information regarding the effects of cooking on OA/DTX toxins in mussels was available for the expert consultation by FAO/IOC/WHO during 2004 (Anon 2005) and as far as the authors are aware there is
1 2 3 4 5 6 7 8 9 10 11 12 13 14 15 16 17 18 19 20 21 22 23 24 25 26 27 28 29 30 31 32 33
no further information for OA/DTX toxins available in the literature on this topic. However, considering the lipophilic nature of these toxins it is reasonable to assume that they would exhibit similar behaviour to AZAs.
In late July 2005, levels of AZAs and OA/DTX2 significantly above the regulatory limit were detected in mussels (Mytilus edulis) from the northwest of Ireland. Samples were collected to re-examine the influence of cooking on AZAs, as well as to obtain some information for OA and DTX2. The contribution of water loss during the cooking process to changes in the toxin concentrations was studied in closer detail, and the possibility of other factors contributing to changes in toxin concentrations was also examined.
Methods and Materials Standards and chemicals
The AZA calibrants used were dilutions of an AZA1 lot isolated during 2001 from mussel samples originating in Ireland (Killary Harbour 1996, Bantry 2000) under supervision of Dr. Satake in Japan, note: at the time of this work no certified AZA calibration standards were available. The AZA1 standard used was prepared in the laboratory of scientists highly experienced in the isolation of these compounds (Satake et al., 1998), and as such was of the highest quality and purity available internationally. OA standards were prepared from certified calibration solutions (NRC CRM-OA) produced by the NRC in Canada. For the standard addition experiment a solution purified as part of the ASTOX project (Hess et al., 2007) containing AZA1 and -3 was used. Methanol and acetonitrile were obtained as Pestiscan grade solvents from Labscan. A reverse osmosis purification system (Barnstead Int., IA, USA) supplied water for the mobile phase. Formic acid and ammonium formate were obtained from Sigma-Aldrich (St Louis, MO, USA).
Samples
Two mussel samples (Mytilus edulis), naturally contaminated with AZAs and OA/DTX2, were retrieved from Bruckless, Donegal Bay, on the northwest coast of Ireland. The first sample was obtained during the first week of August and the second sample one week later. Both samples were received in the laboratory within 24 h of being removed from the water.
1 2 3 4 5 6 7 8 9 10 11 12 13 14 15 16 17 18 19 20 21 22 23 24 25 26 27 28 29 30 31 32 33
For additional heat treatment studies a separate uncooked mussel sample obtained during 2001 from Bantry Bay, on the southwest coast of Ireland, was used. This sample had been stored at -20 °C since harvest.
A fresh mussel sample from Clew bay received in June 2007 for routine monitoring had AZA concentrations <LOD and was used for a standard addition experiment.
Sample processing and pre-treatment
Approximately 10 kg of live mussels were received for each Bruckless sample. Initial processing involved removing byssus threads and rinsing with water. The mussels were opened by cutting the adductor mussel with a scalpel. This was done to facilitate removal of the mantle fluid. The flow diagram in Figure 1 shows the random subdivision and subsequent processing of the cleaned mussels that remained for each sample, using the first sample as an example. One lot was left untreated (a, b, c). A second lot was cooked (d, e, f) by steaming over boiling water for 10 min (without being submerged). A final lot was autoclaved (g, h, i) at 121 °C for 15 min using a bench top autoclave (ST-19 Express Autoclaves, Dixons, UK). During the process the mussels were supported to prevent immersion in the leached juices. The digestive glands (DG) were carefully dissected from the fresh, steamed and autoclaved tissues using a scalpel.
Homogenisation of the whole flesh and remainder tissues from each lot was performed using a Waring blender (Hartford, CT, USA). The DG tissues were homogenised using an Ultraturrax (IKA Werke, Janke & Kunkel, Staufen, Germany). For both processed samples triplicate portions of the homogenised whole flesh, DG and remainder tissues of the fresh, steam cooked and autoclaved lots were taken for extraction and analysis.
The tissue fluids from the steaming step on the second sample were prepared for analysis by liquid/liquid partitioning. A 100 ml sample of the fluid was shaken with 100 ml ethyl acetate. The ethyl acetate was separated and the fluid fraction was washed with a further 100 ml of ethyl acetate. The ethyl acetate fractions were combined in a round bottom flask and evaporated to dryness. The residue was then taken up in 2 ml of MeOH for analysis.
Moisture content determination 1 2 3 4 5 6 7 8 9 10 11 12 13 14 15 16 17 18 19 20 21 22 23 24 25 26 27 28 29 30 31 32 33 34
An oven drying method (ISO 17025 accredited) was used to determine moisture contents. Aliquots (2 g) of the shellfish tissues were weighed into pre-weighed aluminum drying dishes and placed in the oven at 104°C for 18 hrs. The samples were then placed in a desiccator until the weight losses were recorded. Triplicate samples were taken for moisture content analysis of the whole flesh tissues (fresh, steamed, autoclaved) for both samples.
Heat treatment of fresh mussel homogenate
The mussel sample from Bantry Bay was removed from long-term storage (-20 °C) and defrosted. The whole flesh contaminated with AZAs and OA/DTX2 was dissected and homogenised. Aliquots (2 g, n=36) of the homogenate were transferred to 5 ml glass reaction tubes (Wheaton, Millville, NJ, USA). The tubes were sealed tightly with wadded screw caps. Three aliquots were heated for 10 min in an oil bath at temperatures ranging from 50 to 150 °C inclusive (10 °C increments).
Regulatory monitoring samples
A total of 20 mussel (Mytilus edulis), oyster (Crassostrea gigas), clam (Tapes
philippinarium, Siliqua solida) and cockle (Cerastoderma edule) samples received as
part of the Irish DSP/AZP regulatory monitoring program during 2006 (Jul – Nov) were selected for heat treatment and re-analysis. All samples selected had levels of AZA-equivalents ranging from just above the limit of detection (LOD) of the method used, to well in excess of the regulatory level. However, none of the samples had the individual AZA3 analogue present in quantifiable amounts. Two aliquots (2 g) of each sample were weighed into 50 ml centrifuge tubes. One of each of the duplicate aliquots was then placed in a water bath (Grant, Cambridge, UK) at 90 °C for 10 min.
Extraction
A double extraction procedure for lipophilic toxins was used as described previously (McCarron et al., 2007). To summarise, samples (2 g) were extracted twice in centrifuge tubes with 9 mL volumes of 100% MeOH. The supernatants from the two extractions were combined in a 25 mL volumetric and made up to volume with the extraction solvent. This procedure resulted in a sample to solvent ratio (SSR) of 1:12.5. Aliquots of the combined phases made up to volume were filtered through
1 2 3 4 5 6 7 8 9 10 11 12 13 14 15 16 17 18 19 20 21 22 23 24 25
0.2 µm filters (Schleicher & Schuell, Whatman, UK) into HPLC vials for analysis. This extraction procedure was applied to all the samples from the cooking and heat treatment exercises previously described.
Standard addition experiment
The mussel sample (whole flesh) from Clew bay was allowed to defrost. A portion of the blended tissue (ca. 15 g) was heated in a closed centrifuge tube for 15 min using a water bath (Grant, Cambridge, UK) to mimic the effect of a cooking step (without the loss of water). Extracts of the raw and heated mussel sample were prepared using the extraction procedure above.
The stock AZA solution had concentrations of 14.31 and 7.34 µg/mL for AZA1 and -3 respectively. For a working solution a 5-fold dilution of the stock was prepared (500 µL of 1.47 µg/mL AZA3). From this working solution serial 2-fold dilutions were prepared using a Hamilton Microlab™ diluter (AGB scientific, Dublin, Ireland) by mixing 250 µL with 250 µL of MeOH to make each subsequent level. A series of seven dilutions to be used as spikes for the standard addition experiment were prepared, ranging from 16 to 1468 ng/mL in concentration. HPLC vials were labelled and filled with 0.5 mL volumes of the cooked and raw extracts, and 100% MeOH which was used as a control (n=7 for each). To have AZA3 concentrations of 50.3, 25.1, 12.6, 6.3, 3.1, 1.6, 0.8 ng/mL in the different solutions, 17 µL aliquots of each respective dilution was aspirated into the individual vials using the Hamilton Microlab™. The vials were capped and mixed, prior to placing an aliquot of each in an insert vial for analysis.
LC-MS analysis
Tissue distribution studies (Bruckless samples) and standard addition
26 27 28 29 30 31 32 33
A 2795 Waters HPLC coupled to a quadrupole time-of-flight hybrid (Micromass Q-ToF Ultima), equipped with a z-spray ESI source was used. The Q-ToF was used in TOF-MS-MS mode. A binary mobile phase was used, with A (100% aqueous) and B (95% aqueous acetonitrile) each containing 2mM ammonium formate and 50mM formic acid. For the AZAs a C18 ACE (30 mm x 2.1 mm) column
was used with an isocratic run of 60% B for 7 min and the MS was operated in positive ionisation mode. Retention times for AZA3, -1 and -2 were ca. 2.8, 4 and
1 2 3 4 5
5.1 min respectively. For the OA and DTX2 the same column was used with an isocratic run of 55% B for 6.5 min and the MS was operated in negative ionisation mode. Retention times for OA and DTX2 using this system were ca. 2.4 and 2.9 min respectively.
Heat treatment and regulatory samples
6 7 8 9 10 11 12 13 14 15 16 17 18 19
For these samples a 2695 Waters HPLC coupled to a triple stage quadrupole (Quattro Ultima, Micromass) also equipped with a z-spray ESI source was used. A multi-toxin method was adapted from Quilliam et al. (2001) and was previously summarised by Hess et al. (2003). For this method the same binary mobile phase described above was used. A binary gradient was run on a BDS-hypersil C8 column
(50 x 2 mm, 3 µm) with a guard (10 x 2 mm, 3 µm). Starting with 30% B at time zero, B was raised to 90% at 8 min. Then, the 90% B was held for 0.5 min, decreased to 30% B over 0.5 min and was held again for 3 min until the next run. The MS used allowed tandem mass spectrometric analysis. With this method OA and DTX2 eluted first (ca. 6.5 - 8 min), followed by AZA3, -1 and -2 (ca. 10-12 min)
Results and Discussions
Influence of steaming and autoclaving
Azaspiracids 20 21 22 23 24 25 26 27 28 29 30 31 32 33 34
The steaming and autoclaving processes carried out on both samples resulted in very similar whole flesh increases of AZA-equivalents (Table 1), even though the concentrations of both samples were considerably different. The increase after steaming was ca. 40% for both samples with an increase of ca. 85% in total concentrations after autoclaving. Moisture content analysis of the whole flesh tissues (Table 2) demonstrated very similar water loss in the steamed and autoclaved lots of the two samples, showing that they were processed in a reproducible manner. This explains the excellent correlation in the changes to AZA-equivalent levels. The increases measured in the remainder tissues (Table 1), also correlated quite closely between the two samples. This study confirms overall the findings of the previous study (Hess et al., 2005) regards an observed increase in AZA concentrations after cooking. In those experiments the increase was approximately twice the increase measured after steaming the samples collected for this study. However, the previous steaming step was performed in a different laboratory, and cooking procedures are
1 2 3 4 5 6 7 8 9 10 11 12 13 14 15 16 17 18 19 20 21 22 23 24 25 26 27 28 29 30 31 32 33 34
difficult to standardise (quantities, duration, etc.). Differences in the mussel samples used may also have contributed to the variation, but as no moisture concentrations were recorded in the previous study it is difficult to identify the exact reason.
There was a slight increase after steaming, but overall the ratio of AZA-equivalents in the DG tissues compared to whole flesh remained fairly constant between the fresh, steam cooked and autoclaved tissues, suggesting minimal re-distribution during treatments (Table 1). The ratios measured were comparable to the average of 5 reported by Hess et al. (2005), again showing that AZAs are concentrated in the DG tissues of mussels, even after cooking. A previous study by Furey et al., (2003) also noted this as a general trend in the AZA distribution in mussel tissues using a range of samples. However in earlier reports (James et al., 2001; 2002) it was reported that AZAs distributed throughout mussels, with the majority of the toxin being in the remainder tissues. It was suggested that while the toxins initially accumulate in the DG, they can penetrate the remainder tissue over time. However, anatomical distribution studies of AZA contaminated mussels from an individual harvest location over an extended period did not produce any evidence to support this (Hess et al., 2005).
Changes to the individual AZA analogue concentrations are displayed in Figure 2. While the levels of AZA1 and -2 increased progressively going from the fresh, to the steamed, to the autoclaved tissues, it is clear that the AZA3 amounts measured in both samples after the heat treatments was significantly more than what would be expected due to water loss. Table 3 shows the concentrations of the different AZA analogues for both samples. In addition to the measured values after the steaming and autoclaving steps, theoretical values are also expressed. Using the concentrations of the fresh samples, theoretical values were calculated as the concentration increase that would be expected as a result of the recorded water losses, with the assumption that no toxins were leached with the fluids. It is important to note that the lots used for the different treatments (fresh, steamed, autoclaved) were randomly selected, and that there may have been concentration differences between them. Therefore, the theoretical values expressed should only be considered as indicative values. The results for both samples were very similar with the measured AZA3 concentrations in the steamed lots being ca. 8 - 9 times greater than what would have been expected. Therefore, increased levels of AZA3, in addition to water loss, contributed to the overall AZA-equivalent increases observed after cooking fresh
1 2 3 4 5 6 7 8 9 10 11 12 13 14 15 16 17 18 19
mussels. In the autoclaved lots the levels of AZA3 were less than those measured after steaming, but nonetheless they were still ca. 5 - 6 times more than theoretically expected for both samples. The concentrations of AZA1 and -2 in both samples were below the theoretical values in the steamed lots, although the differences were not statistically significant in all cases. For the autoclaved lots AZA1 and -2 concentrations were above the theoretical concentrations, but again all differences were not statistically significant.
A prior study reported that toxin profiles were significantly different between mussel DG and remainder tissues, with AZA1 usually the predominant toxin in DG tissues, while AZA2 and –3 were dominant in the latter (Furey et al., 2007). This pattern was not observed in this work.
To determine if AZAs are leached during conventional cooking procedures the cooking fluid of the second sample was analysed following a cleanup step. The clean-up resulted in an approximate 50-fold concentration of the sample. AZA1 and -2 were detected, although at low levels when compared to the mussel samples. Related back to the whole tissue an approximate AZA1 concentration of 0.01 mg/kg was detected (ca. 1% of the raw whole flesh concentration). Interestingly no AZA3 was detected in the cooking fluid.
Okadaic acid & dinophysistoxin-2
20 21 22 23 24 25 26 27 28 29 30 31 32 33 34
Increased levels of OA and DTX2 were recorded after steaming and autoclaving (Table 4). However, in contrast to the AZAs, the increases in OA-equivalents differed considerably between the two samples. This was unexpected considering the excellent correlation for AZAs in the same samples. Increases in OA-equivalents were ca. 30 - 70% after steaming for the 1st and 2nd samples respectively. The difference in the increases for the autoclaved lots of the two samples was not as great (ca. 70 – 85%). As this was a study carried out using fresh mussel samples it was not possible to ensure that the concentration levels were homogeneously distributed between randomly selected lots. While it appears that the lots were appropriately divided for AZAs, this does not necessarily mean that it should be the case for other toxin classes also naturally present in the same tissues. Despite the differences observed between the two samples there was an overall increase as a result of the cooking process, showing that OA and DTX2 also concentrate in mussel tissues during cooking.
1 2 3 4 5 6 7 8 9 10 11 12 13 14 15 16 17 18 19 20 21 22 23 24 25 26 27 28 29 30 31 32 33
Figure 3 displays the OA and DTX2 concentrations in the different tissues of the fresh, steamed, and autoclaved lots of both samples. OA levels were significantly higher than DTX2. One of the most striking aspects of this data is that the amounts of OA and DTX2 did not increase significantly in the DG tissues after either treatment. For the second sample the levels actually decreased. This is reflected in the ratios of OA-equivalents in DG tissues over whole flesh, which dropped significantly after steaming and autoclaving compared to the fresh tissues (Table 4). While the toxins were still predominantly concentrated in DG tissues after each treatment (average ratio of 4 for both samples), considerable dispersion into the remainder tissues took place. This is shown in Figure 3 where it can be seen that the concentrations in the remainder tissues increased much more rapidly than in the whole flesh. It is also evident from the data given in Table 4 where after cooking the percentage of total toxin in the remainder tissues of both samples significantly increased (ca. 15-26%). Currently DG tissues are dissected for use in the DSP mouse bioassay, which is the reference method in the EU. These present findings potentially have significance with respect to these practices.
The DTX2 concentrations correlated well with the theoretical values for both samples, while OA levels were found to be greater than expected in all samples with the exception of one (first sample, steamed) (Table 3). However, none of the differences were of the order observed for AZA3, and it appears reasonable to assume that, during cooking of mussels containing DSP toxins, their concentrations are only influenced by water losses.
Analysis of the cooking fluids revealed significant quantities of OA and DTX2. Related back to the whole tissue an approximate OA concentration of 0.02 mg/kg was detected (<3% of the cooked whole flesh concentration). Perhaps of most interest is that DTX1 was also detected in the cooking fluids. This analogue was not detected in any of the tissues during the study (<LOD), and it would not be expected as it is rarely found in samples analysed as part of the Irish monitoring program. Because the fluids had been cleaned-up, and were as a result significantly concentrated, detection of DTX1 was facilitated. A concentration of ca. 30 ng/ml was measured in the cleaned extract of the cooking fluids from the second sample. In relation to the initial mussel tissues it was calculated that it would have been present at 0.0005 mg/kg, which is well below the LOD of the method used. However, this
1 2 3 4 5
may suggest that DTX1 may be present at very low base levels in Irish mussels contaminated with OA group toxins.
Heat treatment in closed containers
Azaspiracids 6 7 8 9 10 11 12 13 14 15 16 17 18 19 20 21 22 23 24 25 26 27 28 29 30 31 32 33
To get more information on the observed changes to AZA3, the influence of heating without water loss, on the levels of AZAs in fresh mussels was investigated. Figure 4 displays AZA1 and -3 concentrations measured in uncooked mussel tissues heated in sealed containers at temperatures ranging from 50 - 150 °C. In the control samples the AZA3 concentration was 0.01 mg/kg, and this increased to 0.07 mg/kg when heated at 90 °C. At temperatures >90 °C AZA3 began to degrade with none of the analogue being detected in aliquots that had been heated at 150 °C. AZA1 and -2 were stable up to 110 °C, with gradual degradation occurring at the higher temperatures. The experiment clearly demonstrated that levels of AZA3 measured in fresh mussels increase after the tissues have been heated, independent of water loss. It is also shown that AZA3 is the least stable of the regulated AZA analogues. This is in agreement with other studies (Quilliam et al., 2006), which reported complete degradation of AZA3 and only partial reductions in AZA1 and -2 during thermal sterilisation of reference materials at temperatures in excess of 115 °C. This also explains why the levels of AZA3 measured in the autoclaved mussels from the tissue distribution study were lower than those in the steam cooked tissues (Figure 2).
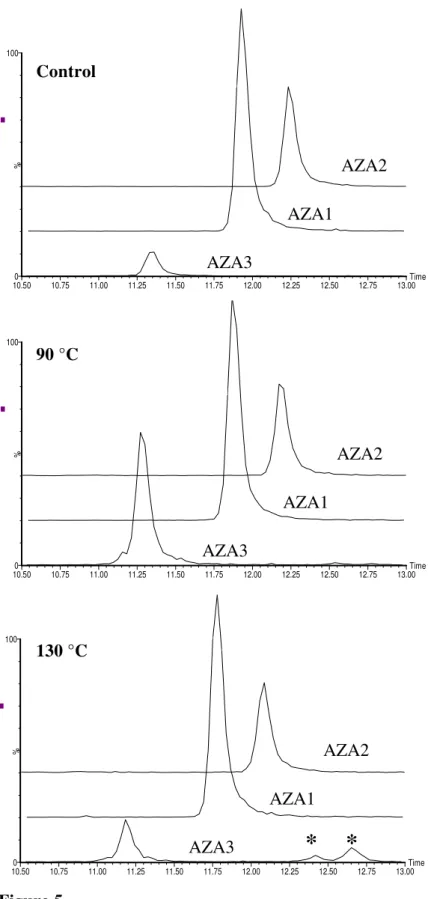
In this work, only the influence of temperature was examined, and not exposure duration. A feasibility study on the preparation of reference materials for AZAs revealed increased concentrations of AZA3 in uncooked mussel homogenates stored at temperatures above freezing (4, 20 and 40 °C) (McCarron et al., 2007). While much lower temperatures were examined in that work, different time points were also assessed. It was shown that measured AZA3 concentrations were both time and temperature dependent with increases, followed by degradation, occurring more rapidly at the higher temperatures. In the previous work by Quilliam et al. (2006) it was noted that upon degradation of AZA3, a later eluting isomer was formed. By extending the acquisition trace a number of AZA3 isomers that formed during the heat treatment process were observed. Figure 5 shows the AZA chromatograms of a
1 2 3
control sample and samples heated at 90 and 130 °C where the increase and subsequent degradation of AZA3 is evident.
Okadaic acid & dinophysistoxin-2
4 5 6 7 8 9 10 11 12 13 14 15 16 17 18 19 20 21 22 23 24 25 26 27 28 29 30 31 32 33 34
Like AZA1 and -2, OA was stable at temperatures up to 120 °C, with slight degradation taking place at higher temperatures (Figure 6). The average concentration of OA in the samples was 0.13 mg/kg, and this decreased to 0.08 mg/kg at the highest temperature of 150 °C. In the sample used for this study there was more DTX2 than OA present with an average concentration of 0.32 mg/kg. DTX2 appeared to degrade earlier and more gradually than OA with the difference becoming significant at 100 °C (p = 0.011). For OA a decrease did not become significant until 130 °C (p = 0.022). Overall there was a greater reduction in DTX2 with a concentration of 0.13 mg/kg remaining after heating at 150 °C. Reduced heat stability for DTX2 compared to OA has previously been observed in studies examining the feasibility of using heat treatment as a stabilisation procedure for DSP toxin reference materials (McCarron, 2005). Although OA and DTX2 degrade at elevated temperatures, the reductions are consistent between samples of the same treatment group. Therefore, the procedure is suitable to be applied in the preparation of reference materials for OA and DTX2, as is applied by the National Research Council of Canada (NRC-CNRC, 2005).
Heat treatment of routine samples
The AZA3 concentrations and AZA-equivalent levels, measured during routine regulatory monitoring of 20 different shellfish samples are given in Table 5. Also shown are the concentrations when the samples were re-analysed with and without heating. While there are some differences when comparing results of the re-analysed unheated samples with those of the initial routine analyses, these are minor and can be attributed to between run variability. It was decided to heat tissue aliquots at 90 °C for 10 min as this treatment resulted in the maximum AZA3 levels during the systematic heat treatment trial (Figure 4). For every mussel sample tested the level of AZA3 increased upon heating, regardless of the overall level of contamination. Even in the samples with the lowest AZA-equivalent values (0.02 and 0.08 mg/kg), the level of AZA3 went from below the LOD to just below the limit of quantification (LOQ). In some of the mussel samples the heating step pushed the AZA-equivalent
1 2 3 4 5 6 7 8 9 10 11 12 13 14 15 16 17 18 19 20 21 22 23 24 25 26 27 28 29 30 31 32 33 34
levels above the regulatory limit for AZAs (0.16 mg/kg). The largest increase in AZA3 concentration was from LOQ before heating to 0.11 mg/kg after heating. The results with numerous samples, taken at different times, from different locations, and with varying concentrations of AZAs highlight the authenticity of this AZA3 phenomenon in mussels.
A number of other shellfish species were also tested, however, there were only increased AZA3 levels upon heating in 2 of the 6 oyster samples examined. While AZA-equivalents were quite low in all the non-mussel samples, increases were observed in the mussel samples at similar low concentrations. Therefore, these findings are consistent with a separate study (Furey et al. 2003) in which no AZA3 was detected in shellfish species other than mussels and oysters. However, as the number of samples tested in this work was limited it is possible that AZA3 could be detected in these species when higher total AZA concentrations are present.
Standard addition experiment
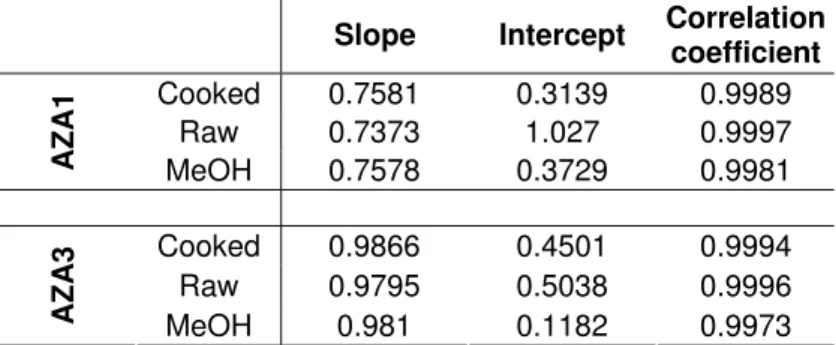
In the various studies carried out as part of this work increased concentrations of AZA3 not explainable by water loss during cooking were observed. A possible explanation for the unusual occurrence observed for AZA3 is the elimination of matrix effects. Matrix effects are a common problem in the LC-MS analysis of biota, and various studies have been carried out examining their influence on shellfish toxin analysis (Ito and Tsukada 2002, Stobo et al. 2005). In this work AZA-equivalent concentrations in the steamed lots of both samples were ca. 20% greater than what could be explained by water loss, which could theoretically be accounted for by the removal of a matrix effect through cooking the tissues. However, matrix effects observed for AZA1 in raw and cooked shellfish tissues have been shown to be very similar in a recent study (Fux et al., 2007). Nevertheless, in order to find out if AZA3 is influenced by matrix effects to a different extent than AZA1, and to rule out the possibility that matrix effects were responsible for the measured increases in AZA3 concentrations, a standard addition experiment was performed (Figure 7). The experiment showed that there was no ion suppression or enhancement during analysis of AZA3 in cooked or raw matrices using this particular method (isocratic elution system with the C18 ACE column on Q-ToF).
For AZA3 and -1 the slopes of the samples prepared in the raw and cooked mussel extracts were no different to that of the samples prepared using 100% MeOH
1 2 3 4 5 6 7 8 9 10 11 12 13 14 15 16 17 18 19 20 21 22 23 24 25 26 27 28 29 30 31 32 33 34
(Table 6). The fact that there was no significant matrix suppression does show that the increases in AZA3 concentrations were not due to a matrix effect. AZA1 and AZA3 displayed similar behaviour in the standard addition experiment.
As the standard addition experiment clearly showed that there was no matrix effects in the analysis, it can be concluded that the increases in AZA3 concentrations observed in the previous studies were due to some other phenomenon. Hence, a more plausible explanation is that AZA3 is released from some component within the mussel tissue matrix as a result of heating. However, this raises the question as to why similar increases were not observed for AZA1 and -2 after the steaming step. For these isomers the concentrations measured were actually close to the theoretically expected values in both samples (Table 3). It may be the case that due to some structural property of AZA3 significant quantities of it are bound to the matrix, and subsequently freed upon heating. Results from routine monitoring of fresh mussel samples in Ireland has shown that AZA3 is the isomer that is generally present in the lowest concentrations, which may be related to a very specific binding.
An additional possibility is that the increased AZA3 concentrations being measured after heat treatment are due to toxin conversion, as it is known that numerous AZA analogues are present in contaminated tissues (Rehmann et al., 2007). Investigation of these possibilities requires a considerable amount of research, which is on-going at the Marine Institute.
Options for official food control
This study confirms the results of the previous work, showing that AZAs concentrate in mussel tissues during cooking (Hess et al., 2005). While in the main part this was shown to be as a result of water loss, it has been demonstrated that raised concentrations of AZA3 also contributed to overall AZA increases. In the initial FSAI risk assessment for AZAs (Anderson et al., 2001) it was reported that AZAs are significantly degraded upon cooking. The results herein and those of the prior study are sufficient to establish that this is not the case. Hess et al., (2005) postulated that the difference in the findings of the independent studies may possibly have been due to differences in samples, one study examined fresh mussels, while the earlier work, where degradation was observed, used samples which had been stored frozen for a period of time. However, in these studies where mussel tissues were heated in closed
1 2 3 4 5 6 7 8 9 10 11 12 13 14 15 16 17 18 19 20 21 22 23 24 25 26 27 28 29 30 31 32 33 34
containers without water loss no degradation of AZAs was observed, even though the sample used had been stored frozen after harvest for more than five years. Therefore, it can be concluded that AZAs are not degraded during conventional cooking, whether or not the sample being treated is fresh or has been stored frozen.
OA and DTX2 levels were shown to rise in approximate proportion to water losses during cooking. In contrast to the AZAs, OA and DTX2 appear to be re-distributed from the digestive glands to the remainder tissues during cooking. Even in raw mussels while the OA group toxins were shown to accumulate mainly in the DG tissues, up to 9% of the total toxin was found in the remainder tissues in the samples used for this study. Although classically the DG of mussels has been used for the isolation of toxins (e.g. DTX1, Murata et al., 1982), prior to this work there has been very little information available detailing the anatomical distribution of these toxins in mussel tissues, particularly after cooking. Use of DG is the most appropriate for such isolations as this is where most toxin accumulates and it removes the fatty remainder tissues. However, from a food safety perspective analysis of whole flesh may be more appropriate for regulatory monitoring practices, particularly if samples have been cooked as this process has been shown to increase the distribution of the OA group toxins to these tissues.
With the exception of AZA3, all toxins displayed good thermal stability, although at higher temperatures (>130 °C) each toxin investigated was degraded to some extent. In spite of this, heat treatment would not be feasible as a decontamination procedure for these toxins, as the temperatures required would produce an unpalatable product.
The influence of cooking on toxins other than those studied here, as described in the literature, was discussed in the introduction. In addition to direct changes to toxin concentrations, it has been shown that toxin profiles can be altered in mussel tissues as a result of enzymatic activity e.g. the transformation of PTX2 to PTX2-seco acid as a result of enzyme activity (Suzuki et al., 2001, Miles et al., 2004). For these reasons, it is important that all the information available is used to improve methodology applied in regulatory monitoring designed to ensure consumer safety. The following are a number of options available to official control laboratories with regard to sample pre-treatment for the analysis of shellfish toxins in mussels:
Raw analysis
1 2 3
The simplest approach is to analyse shellfish samples raw, without any pretreatment.
Heat treatment
4 5 6 7
A minimum sample pretreatment would involve heat treatment of tissues in closed containers (i.e. without water loss).
Cooking 8 9 10 11 12 13 14 15 16 17 18 19 20 21 22 23 24 25 26 27 28 29 30 31 32 33 34
A more complete option would be to include a standardised cooking step as a sample pretreatment. In this format water would be allowed to leave the matrix.
Currently there is no international agreement on the need for, or use of, a pre-treatment step in regulatory analysis of shellfish samples. From an analytical perspective the use of a cooking or heating step as a pre-treatment prior to analysis has a number of advantages. Pretreatment by heating without water loss would serve to stabilise the tissues enzymatically, and stabilise toxin concentrations. This study outlines the importance of such a treatment for the analysis of AZAs specifically. This treatment would also aid method validation in that it could focus on those matrices that are globally distributed, and because cooking is a typical material pre-treatment in the preparation of mussel tissue reference materials for phycotoxins, certified reference materials would also be more reflective of day-to-day samples. Analysis of a cooked sample, in addition to the above points, also reflects most closely what is eaten. Equally, cooking of samples could help to avoid conflicts between shellfish producers and processors, as well as between importers and exporters.
However, if such a step were implemented the impact on the regulatory decision making process would have to be carefully considered as cooking (allowing water loss) will result in an increase in the concentration of lipophilic toxins and thus lead to prolonged closure of shellfish production areas. Such issues need to be taken into account in the risk assessment process for marine biotoxins, so that appropriate risk management actions can be developed and implemented.
1 2 3 4 5 6 7 8 9 10 11 12 13 14 15 16 17 18 19 20 21 22 23 24 25 26 Acknowledgements
The authors wish to acknowledge the help of the Biotoxin Chemistry team at the Marine Institute, and Dr. Terry McMahon for valuable comments on the paper. The Irish government funds the routine shellfish toxin monitoring programme, and the Marine Institute and National Development Plan (NDP) provided funds for the ASTOX project (ST/02/02, 2003-2006). The authors would like to thank Linda Tyrrell of the Marine Institutes Chemistry Sector for her assistance with some of the analyses.
References 1 2 3 4 5 6 7 8 9
Anderson, W.A., Whelan, P., Ryan, M., McMahon T., James, K.J., 2001. Risk assessment of azaspiracids (AZAs) in shellfish. Food Safety Authority of Ireland. (http://www.fsai.ie/publications/index.asp)
Anonymous (2005) Report of the Joint FAO/IOC/WHO ad hoc Expert Consultation on Biotoxins in Molluscan Bivalves (Oslo, Norway, 26–30 September 2004), 31pp. Rome, Italy: Food and Agriculture Organization. Website http://www.fao.org/es/esn/food/risk_biotoxin_en.stm (Accessed 08.01.2007) 10 11 12 13 14 15 16 17 18 19
Aune, T., Larsen, S., Aasen, J., Rehmann, N., Satake, M., Hess, P., 2007. Relative toxicity of dinophysistoxin-2 (DTX2) compared with okadaic acid, based on acute intraperitoneal toxicity in mice. Toxicon 49, 1-7.
Brombacher S., Edmonds S., Volmer D., 2002. Studies on azaspiracid biotoxins. II. Mass spectral behaviour and structural elucidation of azaspiracid analogs. Rapid
Comm. Mass Spectrom. 16, 2306-2316.
20 21 22 23 24 25 26 BIOTOX, 2007. http://www.biotox.org.
Carmody, E. P., James, K. J., Kelly, S. S., and Thomas, K., 1995. Complex diarrhetic shellfish toxin profiles in Irish mussels. In Harmful Marine Algal Blooms; Lassus, P., Arzul, G., Erard, E., Gentien, P., and Marcaillou, C., Eds.; Lavoisier Science Publishers: Paris. 273-278. 27 28 29 30 31 32 33 34 35 36 37 38 39 40 41 42 43 44 45 46 47 48 49 50 CRL, 2007. http://www.aesa.msc.es/crlmb/web/CRLMB.jsp.
Furey, A., Moroney, C., Magdalena, A. B., Fidalgo Saez, M. J., Lehane, M., James, K., 2003. Geographical, temporal, and species variation of the polyether toxins, Azaspiracids, in shellfish. Environmental Science and Technology. 37(14), 3078-3084.
Fux, E., McMillan, D., Bire, R., Hess, P., 2007. Development of an ultra performance liquid chromatography – mass spectrometry method for the detection of lipophilic marine toxins. J. of Chromatgr. A, 1157, 273-280.
Hess, P., McMahon, T., Slattery, D., Swords, D., Dowling, G., McCarron, M., Clarke, D., Gibbons, W., Silke, J., O’Cinneide, M., 2003. Use of LC-MS testing to identify lipophilic toxins, to establish local trends and interspecies differences and to test the comparability of LC-MS testing with the mouse bioassay: an example from the Irish biotoxin monitoring programme 2001. Proc. 4th Intl. Conf. Molluscan Shellfish
Safety June 4-8, 2002, Xunta De Galicia, IOC of UNESCO, ISBN: 84-453-3638-X.
57-65.
Hess, P., Nguyen, L., Aasen, J., Keogh, M., Kilcoyne, J., McCarron, P., Aune, T., 2005. Tissue distribution, effects of cooking and parameters affecting the extraction of azaspiracids from mussels, Mytilus edulis, prior to analysis by liquid chromatography coupled to mass spectrometry. Toxicon 46, 62-71.
1 2 3 4 5 6 7 8 9 10 11 12 13 14 15 16 17 18 19 20 21 22 23 24 25 26 27 28 29 30 31 32 33 34 35 36 37 38 39 40 41 42 43 44 45 46 47 48 49
Hess, P., McCarron, P., Rehmann, N., Kilcoyne, J., McMahon, T., Ryan, G., Ryan, M.P., Twiner, M.J., Doucette, G.J., Satake, M., Ito, E., Yasumoto, T., 2007. Isolation and purification of AZAs from naturally contaminated material, and evaluation of their toxicological effects (ASTOX). Marine Environment & Health Series No.28. ISSN 1649 0053
Holland, P., T., McNabb, P., S., Selwood, A., I., and Van Ginkel R., 2004. Multiresidue LC-MS analysis of ASP and DSP toxins in shellfish: Validation and Laboratory QA/QC data. Proceedings Xith IUPAC Symposium on Mycotoxins &
Phycotoxins, Bethesda MD, May 2004. Submitted, Feb. 2005.
Hu, T., Doyle, J., Jackson, D., Marr, J.C., Nixon, E., Pleasance, S., Quilliam, M.A., Walter, J.A., and Wright, J.L.C, 1992. A new marine toxin dinophysistoxin-2 (DTX-2), isolated from toxic Irish mussels and biogenetically related to the toxins okadaic acid and dinophysistoxin-1 (DTX-1), the principal agents responsible for diarrhetic shellfish poisoning (DSP), is reported. J. Chem. Soc., Chem. Commun.,
39-41
Ito, S., Tsukada, K., 2002. Matrix effect and correction by standard addition in quantitative liquid chromatographic-mass spectrometric analysis of diarrhetic shellfish poisoning toxins. J. of Chromatgr. A 943, 39-46.
James, K., Furey, A., Satake, M., Yasumoto, T., 2001. Azaspiracids poisoning (AZP) – a new shellfish toxic syndrome in Europe. Harmful Algal Blooms 2000, Hallegraeff, G.M., Blackburn, S.I., Bolch, C.J., Lewis, R.J., (Eds.), IXIth International conference
on harmful algal blooms, Tasmania, Australia. 250-253.
James, K., Lehane, M., Moroney, C., Fernandez-Puente, P., Satake, M., Yasumoto, T., Furey, A., 2002. Azaspiracid shellfish poisoning: unusual toxin dynamics in shellfish and the increased risk of acute human intoxication. Food. Add. Cont., 19, 555-561. James, K.J., Sierra, M.D., Lehane, M., Brana Magdalena, A., Furey, A., 2003. Detection of five new hydroxyl analogues of azaspiracids in shellfish using multiple tandem mass spectrometry. Toxicon 41, 277-283.
Jorgensen, K., and Larsen, L.B., 2004. Distribution of diarrhetic shellfish poisoning toxins in consignments of blue mussels. Food Addit. Contam. 21: 341-47.
LFGB 2006. Paragraph 64, Analytical methods. German food legislation.
Marr, J.C., Hu, T., Pleasance, S, Quilliam, M.A., Wright, J.L.C.,1992. Detection of new 7-O-acyl derivatives of diarrhetic shellfish poisoning toxins by liquid chromatography-mass spectrometry. Toxicon 30, 1621-1630.
McCarron, P., 2005. Quarterly Report: July – September 2005. Marine Institute,
1 2 3 4 5 6 7 8 9 10 11 12 13 14 15 16 17 18 19 20 21 22 23 24 25 26 27 28 29 30 31 32 33 34 35 36 37 38 39 40 41 42 43 44 45 46 47 48 49 50
McCarron, P., Hess, P., 2006. Tissue distribution and effects of heat treatments on the content of domoic acid in blue mussels, Mytilus edulis. Toxicon 47, 473-479.
McCarron, P., Emteborg, H., Hess, P., 2007. Freeze-drying for the stabilisation of shellfish toxins in mussel tissue reference materials. Anal. Bioanal. Chem. (in press) DOI 10.1007/s00216-006-1104-z.
McMahon, T. and Silke J., 1996. Winter toxicity of unknown aetiology in mussels.
Harmful Algae News 14, 2.
Miles, C.O., Wilkins, A.L., Munday, R., Dines, M.H., Hawkes A.D., Briggs, L.R., Sanvik, M., Jensen, D.J., Cooney, J.M., Holland, P.T., Quilliam, M.A., MacKenzie A.L., Beuzenberg, V., Towers, N., 2004. Isolation of pectenotoxins-2 from dinophysis acuta and its conversion to pectenotoxins-2 seco acid and preliminary assessment of their acute toxicities. Toxicon 43, 1-9.
Murata, M., Shimatani, M., Sugitani, H., Oshima, Y., Yasumoto T., 1982. Bull. Jpn.
Soc. Sci. Fish., 48, 549-552.
NRC-CNRC Institute for Marine Biosciences, 2005. NRC CRM-DSP-mus-b.
Certificates of Analysis.
Ofuji, K., Satake, M., McMahon, T., Silke, J., James, K. J., Naoki, H., Oshima, Y., Yasumoto, T., 1999. Two analogs of azaspiracid isolated from mussels, Mytilus edulis, involved in human intoxication in Ireland. Nat. Toxins 7, 99-102.
Ofuji, K., Satake, M., McMahon, T., James, K.J., Naoki, H., Oshima, Y., Yasumoto T., 2001. Structures of azaspiracid analogs, azaspiracid-4 and azaspiracid-5, causative toxins of azaspiracid poisoning in Europe. Biosci. Biotechnol. Biochem. 65, 740-742. Quilliam, M.A, 1995. Analysis of diarrhetic shellfish poisoning toxins in shellfish tissue by liquid chromatography with fluorimetric and mass spectrometric detection.
J. Assoc. Off. Anal. Chem. 78:555-569.
Quilliam, M.A., Hess P., Dell'Aversano, C., 2001. Recent developments in the analysis of phycotoxins by liquid chromatography - mass spectrometry. Chapter 11 in
"Mycotoxins and Phycotoxins in Perspective at the Turn of the Millenium”, Editors:
Willem J. De Koe, Robert A. Samson, Hans P. Van Egmond, John Gilbert and Myrna Sabino. Proceedings of the Xth International IUPAC Symposium on Mycotoxins and Phycotoxins 21-25 May, 2000 Guaruja (Brazil), ISBN:90-9014801-9, p383-391 Quilliam, M.A., Reeves, K., MacKinnon, S., Craft, C., Whyte, H., Walter, J., Stobo, L., Gallacher, S., 2006. Preparation of reference materials for azaspiracids. Molluscan
Shellfish Safety, edited by B. Deegan, C. Butler, C. Cusack, K. Henshilwood, P.
Hess, S. Keaveney, T. McMahon, M. O’Cinneide, D. Lyons & J. Silke. ISBN: 1-902895-33-9, p111-115.
Regulation (EC) No 853/2004 of the European parliament and of the council of 29 April 2004 laying down specific hygiene rules for food of animal origin (Official
1 2 3 4 5 6 7 8 9 10 11 12 13 14 15 16 17 18 19 20 21 22 23 24 25 26 27 28 29 30 31 32 33 34 35 36 37 38 39 40 41 42 43 44 45 46 47 48 49 50
Rehmann, N., Hess, P., Quilliam, M.A., 2007. Discovery of New Analogs of the Marine Biotoxin Azaspiracid (AZA) Including Carboxy- and Dihydroxy-AZAs and Evidence of Azaspiracid-12 in Blue Mussel (Mytilus edulis) Tissue by
Ultra-Performance-Liquid-Chromatography (UPLC) Multi-Dimensional-Mass Spectrometry (MSn). Manuscript submitted to Anal. Chem (Sept 2007).
Satake, M., Ofuji, K., Naoki, H., James, K., Furey, A., McMahon, T., Silke, J., Yasumoto, T., 1998. Azaspiracid, a new marine toxin having unique spiro ring assemblies, isolated from Irish mussels, Mytilus edulis. J. Am. Chem. Soc. 120, 9967-9968
Stobo, L.A., Lacaze, J.P.C.L., Scott, A.C., Gallacher, S., Smith, E.A. and Quilliam, M.A. 2005. Liquid chromgatography with mass spectrometry - detection of lipophilic shellfish toxins. J. of AOAC Int., 88(5), 1371-1382.
Suzuki, T., MacKenzie, L., Stirling, D., Adamson, J., 2001. Pectenotoxin-2 seco acid: a toxin converted from pectenotoxins-2 by the New Zealand Greenshell mussel,
Perna canaliculus. Toxicon 39, 501-514.
Tachibana, K., Scheuer, P.J., 1981. Okadaic acid, a cytotoxic polyether from two marine sponges of the genus Halichondria. J. Am. Chem. Soc. 103, 2469-2471.
Taleb, H., Vale, P., Amanhir, R., Benhadouch, A., Sagou, R., Chafik, A., 2006. First detection of azaspiracids in North West Africa. J. Shell. Res. 25(3), 1067-1071.
Vieites, J.M., Botana, L.M., Vieytes, M.R., Leira, F.J., 1999. Canning process that diminishes paralytic shellfish poison in naturally contaminated mussels (Mytilus
galloprovincialis). J. Food Protect. 62: 515-19.
Yasumoto, T., Murata, M., Lee, J.A., Torigoe, K., 1978. Bull. Jpn. Soc. Sci. Fish., 44, 1249-1255.
1 2 3 4 5 6 7 8 9 10 11 12 13 14 15 16 17 18 Tables
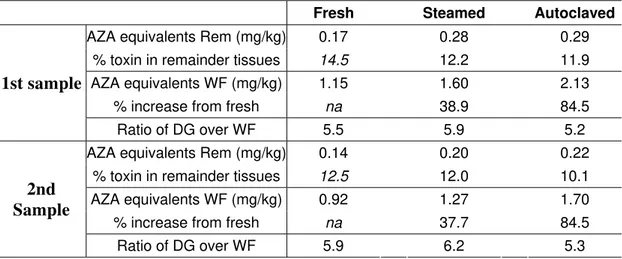
Table 1. AZA equivalents in whole flesh (WF) and remainder tissues (Rem) for the various lots of both samples, as well as % increase based on uncooked concentration. Moisture contents shown are in percent by weight. Ratio of AZA equivalents in digestive glands (DG) over whole flesh (WF).
Fresh Steamed Autoclaved
AZA equivalents Rem (mg/kg) 0.17 0.28 0.29 % toxin in remainder tissues 14.5 12.2 11.9 AZA equivalents WF (mg/kg) 1.15 1.60 2.13
% increase from fresh na 38.9 84.5 1st sample
Ratio of DG over WF 5.5 5.9 5.2 AZA equivalents Rem (mg/kg) 0.14 0.20 0.22
% toxin in remainder tissues 12.5 12.0 10.1 AZA equivalents WF (mg/kg) 0.92 1.27 1.70
% increase from fresh na 37.7 84.5 2nd Sample Ratio of DG over WF 5.9 6.2 5.3 19 20 21 22 23 24 25 26 27 28 29 30 31 32 33 34 35 36 37 38
1 2 3 4 5 6 7 8 9 10 11 12 13 14 15 16 17 18 19 20 21 22 23 24 25 26 27 28 29 30 31 32 33 34 35 36 37 38 39 40 41 42 43 44 45
Table 2. Moisture contents measured in fresh, cooked and autoclaved whole flesh tissues of both samples.
Fresh Steamed Autoclaved
Moisture (% by weight) 79.2 73.7 68.8 %increase in solid na 26.3 49.9 Moisture (% by weight) 79.1 73.6 67.4 %increase in solid na 26.1 56.0 1st sample 2nd sample
1 2 3 4 5 6 7 8 9
able 3. Whole flesh concentrations of AZAs and OA/DTX measured in the various 10 11 12 13 14 15 16 17 18 19 20 21 22 23 24 25 26 27 28 29 30 31 32 33 34 35 Measured (mg/kg) Theory (mg/kg) Measured (mg/kg) Theory (mg/kg) Measured (mg/kg) Theory (mg/kg) AZA1 0.73 na 0.77 0.92 1.24 1.10 AZA2 0.21 na 0.24 0.27 0.37 0.32 AZA3 0.02 na 0.24 0.03 0.15 0.03 OA 0.90 na 1.17 1.14 1.57 1.35 DTX2 0.11 na 0.12 0.14 0.15 0.17 AZA1 0.59 na 0.64 0.74 1.01 0.92 AZA2 0.17 na 0.20 0.21 0.28 0.26 AZA3 0.01 na 0.18 0.02 0.12 0.02 OA 0.43 na 0.75 0.54 0.81 0.67 DTX2 0.08 na 0.12 0.10 0.12 0.13 1st sample 2nd sample
Fresh sample Steamed sample Autoclaved sample
T
treatment lots of both samples. Also shown are the theoretical concentrations of each toxin based on the water loss as a result of the steaming and autoclaving treatments.
1 2 3 4 5 6 7 8 9
OA equivalents in whole flesh (WF) and remainder tissues (Rem) for the 10
arious lots of both samples, as well as % increase based on uncooked concentration. 11 12 13 laved Table 4. v
Moisture contents shown are in percent by weight. Ratio of OA equivalents in digestive glands (DG) over WF.
Fresh Steamed Autoc
OA equivalents Rem (mg/kg) 0.10 0.36 0.41 % toxin in rem inder tissuesa 9.1 20.6 24.3 OA equivalents WF (mg/kg) 1.01 1.29 1.72
% increase from fresh na 27.7 70.3 1st sample
Ratio of DG over WF 6.2 5.4 3.9 OA equivalents Rem (mg/kg) 0.01 0.22 0.14
% toxin in remainder tissues 2.0 26.1 14.8 OA equivalents WF (mg/kg) 0.51 0.87 0.94
% increase from fresh na 70.6 84.3 2nd
Sample
Ratio of DG over WF 8 4 4.1
14 15
Table 5. AZA3 and AZA equivalents results measured in selected samples from the routine monitoring programme. Single aliquots were re-analysed following the standard procedure, and following heat treatment of an aliquot before extraction
Sampling date Location code Species AZA3 (µg/g) AZP equiv.
(µg/g) AZA3 (µg/g) AZAe (µg/g) AZA3 (µg/g) AZAe (µg/g)
% increase in AZA3 peak area
02-Aug-06 GY-GN-IN M. edulis <LOD 0.02 <LOD 0.02 <LOQ 0.03 463
24-Jul-06 KY-KO-CE M. edulis <LOD 0.08 <LOD 0.09 <LOQ 0.11 700
08-Aug-06 DL-BS-MS M. edulis <LOQ 0.11 <LOQ 0.14 0.04 0.19 1107
24-Aug-06 GY-GN-IN M. edulis <LOQ 0.13 <LOQ 0.13 0.02 0.16 781
17-Oct-06 KY-TA-TA M. edulis <LOQ 0.17 <LOQ 0.16 0.05 0.21 433
10-Sep-06 CK-CE-CE M. edulis <LOQ 0.18 <LOQ 0.14 0.03 0.18 460
25-Sep-06 CK-GS-GS M. edulis <LOD 0.2 <LOQ 0.28 0.09 0.38 602
01-Oct-06 CK-BM-NC M. edulis <LOQ 0.19 0.02 0.35 0.10 0.45 254
31-Oct-06 CK-NN-NN M. edulis <LOQ 0.41 <LOQ 0.42 0.11 0.54 505
03-Oct-06 CK-CE-CE M. edulis <LOQ 0.53 0.03 0.48 0.08 0.55 262
06-Sep-06 CK-ON-ON C. gigas <LOD 0.04 <LOD <LOQ <LOD <LOQ na
03-Oct-06 CE-CT-CT C. gigas <LOD 0.07 <LOQ 0.10 0.04 0.14 575
08-Oct-06 KY-BD-BD C. gigas <LOD 0.06 <LOD 0.04 <LOD 0.04 na
17-Oct-06 GY-MW-MB C. gigas <LOQ 0.04 <LOQ 0.04 0.03 0.07 999
19-Oct-06 DL-DH-LC C. gigas <LOD 0.04 <LOD 0.04 <LOD 0.03 na
07-Nov-06 CE-CT-CT C. gigas <LOD 0.09 <LOD 0.07 <LOD 0.07 na
19-Oct-06 GY-CE-IE S. solida <LOD 0.02 <LOD 0.02 <LOD 0.03 na
02-Nov-06 GY-CE-IE S. solida <LOD 0.02 <LOD <LOQ <LOD <LOQ na
14-Aug-06 GY-CN-AR S. solida <LOD 0.01 <LOD <LOQ <LOD <LOQ na
06-Nov-06 SO-DB-DB C. edule <LOD <LOQ <LOD <LOQ <LOD <LOQ na
06-Nov-06 SO-SH-SH T. philippinarium <LOD <LOQ <LOD <LOQ <LOD <LOQ na
* Sample weighed into 50ml centrifuge tube. Capped tube placed in a water bath at 90°C for 10 min Sample
Routine analysis
Straight extraction Heated* before
extraction Straight extraction
Table 6. Summary of standard addition data for AZA1 and -3 using seven calibration concentrations (range of 1.5-97.9 and 0.8-50.3 ng/mL for AZA1 and -3 respectively). Data shown is average of triplicate injections.
Slope Intercept Correlation
coefficient Cooked 0.7581 0.3139 0.9989 Raw 0.7373 1.027 0.9997 AZA 1 MeOH 0.7578 0.3729 0.9981 Cooked 0.9866 0.4501 0.9994 Raw 0.9795 0.5038 0.9996 AZA 3 MeOH 0.981 0.1182 0.9973
List of Figures
Figure 1. Subdivision and processing scheme used for the two fresh mussel samples from Bruckless. Separate lots were treated and portions of whole flesh (WF) were dissected into remainder (Rem) and digestive glands (DG) for fresh (a,b,c), steamed (d,e,f) and autoclaved (g,h,i) lots. Weights shown were recorded during processing of first sample.
Figure 2. AZA1 (top), AZA2 (middle) and AZA3 (bottom) concentrations in fresh, steamed and autoclaved lots of two mussel samples collected from Bruckless (whole flesh (WF), digestive glands (DG), and remainder tissues (Rem)). Error bars shown represent ± 1 SD (n=3). Note: Y-axis breaks have been included.
Figure 3. OA and DTX2 concentrations in fresh, steamed and autoclaved lots of two mussel samples collected from Bruckless (whole flesh (WF), digestive glands (DG), and remainder tissues (Rem)). Error bars shown represent ±1SD (n=3). Note: Y-axis
breaks have been included.
Figure 4. Levels of AZA1, -2 and -3 extracted from aliquots (n=3) of uncooked mussel tissue from Bantry Bay heated at increasing temperatures. Error bars shown represent ±1SD.
Figure 5. Chromatograms of control (top) and samples heated at 90 °C (middle) where maximum AZA3 concentrations were measured, and at 130 °C (bottom) where degradation started taking place. Asterix (*) indicates later eluting AZA3 isomers formed during the heating of fresh mussel tissues contaminated with AZAs. Acquired using 2695 Waters HPLC coupled to Micromass Quattro Ultima triple stage
quadrupole.
Figure 6. Levels of OA and DTX2 extracted from aliquots (n=3) of uncooked mussel tissue heated at increasing temperatures. Error bars shown represent ± 1 SD.
Figure 7. Standard addition of AZA3 in fresh and cooked mussel extracts and in 100% MeOH. Error bars represent ± 1 SD (n=3 injections)
igure 1.
Cleaned 6.0 kg
(mantle fluid removed) Uncooked (1.5 kg) Cooked (2.0 kg) Autoclaved (2.1 kg) WF 446g Rem 221g DG 36g WF 333g Rem169g DG 33g WF 477g Rem177g DG 38g a b c d e f g h i
Cleaned 6.0 kg
(mantle fluid removed) Uncooked (1.5 kg) Cooked (2.0 kg) Autoclaved (2.1 kg) WF 446g Rem 221g DG 36g WF 333g Rem169g DG 33g WF 477g Rem177g DG 38g a b c a b c d e f g h i g h i F
AZA1 conc. m g /k g 0.0 0.5 1.0 4.0 5.0 6.0 WF Rem DG 0.0 0.1 0.2 0.3 0.4 1.0 1.5 2.0 2.5 AZA3 conc. m g /k g 0.0 0.1 0.2 0.3 1.0 1.2 1.4
Fresh Steamed Autoclaved
0.0 0.5 1.0 3.0 4.0 5.0 0.0 0.1 0.2 0.3 1.0 1.2 1.4 1.6 1.8 0.0 0.1 0.2 0.8 1.0 1.2
Fresh Steamed Autoclaved
AZA2 conc. m g /k g WF Rem DG igure 2. 1st F Sample 2nd Sample
O A conc. m g /kg 0.0 0.5 1.0 1.5 5.0 5.5 6.0 6.5 7.0 WF Rem DG 0.00 0.05 0.10 0.15 0.60 0.70 0.80 0.90 1.00 D T X 2 conc . mg /k g 0.0 0.2 0.4 0.6 0.8 2.8 3.0 3.2 3.4 3.6 3.8 4.0 0.00 0.05 0.10 0.15 0.50 0.60 0.70 0.80 0.90
Fresh Steamed Autoclaved Fresh Steamed Autoclaved
WF Rem DG igure 3. 1st F Sample 2nd Sample
0.00 0.02 0.04 0.06 0.08 0.10 0.12 0.14 0.16 0.18 Control 50°C 60°C 70°C 80°C 90°C 100°C 110°C 120°C 130°C 140°C 150°C 10 m in at ... c onc . mg/k g AZA1 AZA2 AZA3 Figure 4.
Figure 5. Time 10.50 10.75 11.00 11.25 11.50 11.75 12.00 12.25 12.50 12.75 13.00 % 0 100 Time 10.50 10.75 11.00 11.25 11.50 11.75 12.00 12.25 12.50 12.75 13.00 % 0 100 Time 10.50 10.75 11.00 11.25 11.50 11.75 12.00 12.25 12.50 12.75 13.00 % 0 100 90 °C 130 °C Control
*
*
AZA3 AZA1 AZA2 AZA3 AZA1 AZA2 AZA3 AZA1 AZA20.00 0.05 0.10 0.15 0.20 0.25 0.30 0.35 0.40 Control 50°C 60°C 70°C 80°C 90°C 100°C 110°C 120°C 130°C 140°C 150°C 10 m in at ... conc. mg/kg OA DTX2 Figure 6.
0 10 20 30 40 50 60 0 10 20 30 40 50 6
AZA3 spike conc. (ng/m L)
ng/mL measured 0 Cooked Raw MeOH Linear (Cooked) Linear (Raw ) Linear (MeOH) Figure 7.