Publisher’s version / Version de l'éditeur:
The Journal of Physical Chemistry B, 114, 17, pp. 5729-5735, 2010-04-13
READ THESE TERMS AND CONDITIONS CAREFULLY BEFORE USING THIS WEBSITE.
https://nrc-publications.canada.ca/eng/copyright
Vous avez des questions? Nous pouvons vous aider. Pour communiquer directement avec un auteur, consultez la première page de la revue dans laquelle son article a été publié afin de trouver ses coordonnées. Si vous n’arrivez pas à les repérer, communiquez avec nous à PublicationsArchive-ArchivesPublications@nrc-cnrc.gc.ca.
Questions? Contact the NRC Publications Archive team at
PublicationsArchive-ArchivesPublications@nrc-cnrc.gc.ca. If you wish to email the authors directly, please see the first page of the publication for their contact information.
NRC Publications Archive
Archives des publications du CNRC
This publication could be one of several versions: author’s original, accepted manuscript or the publisher’s version. / La version de cette publication peut être l’une des suivantes : la version prépublication de l’auteur, la version acceptée du manuscrit ou la version de l’éditeur.
For the publisher’s version, please access the DOI link below./ Pour consulter la version de l’éditeur, utilisez le lien DOI ci-dessous.
https://doi.org/10.1021/jp9106684
Access and use of this website and the material on it are subject to the Terms and Conditions set forth at
Effects of charge density and thermal history on the morphologies of
spontaneously formed unilamellar vesicles
Mahabir, Suanne; Wan, Wankei; Katsaras, John; Nieh, Mu-Ping
https://publications-cnrc.canada.ca/fra/droits
L’accès à ce site Web et l’utilisation de son contenu sont assujettis aux conditions présentées dans le site LISEZ CES CONDITIONS ATTENTIVEMENT AVANT D’UTILISER CE SITE WEB.
NRC Publications Record / Notice d'Archives des publications de CNRC:
https://nrc-publications.canada.ca/eng/view/object/?id=927be595-28f0-480b-94e3-7e977e983190 https://publications-cnrc.canada.ca/fra/voir/objet/?id=927be595-28f0-480b-94e3-7e977e983190A phospholipid mixture consisting of dimyristoyl phosphatidylcholine (DMPC), dihexanoyl phosphatidylcholine (DHPC), and the negatively charged dimyristoyl phosphatidylglycerol (DMPG) lipid is found to spontaneously form uniform-size unilamellar vesicles (ULVs). Small angle neutron scattering (SANS) is used to examine ULV size as a function of net charge, dilution, and thermal history. It shows that ULVs only exist within a narrow window of charge densities, where larger size ULVs can be obtained at a lower charge density through slow temperature annealing. There is also a 6-fold change in the size of low polydispersity ULVs, confirming a previously proposed model for spontaneously forming ULVs [Nieh, M.-P. et al. Langmuir 2005, 21, 6656]. Finally, the stability of these ULVs was confirmed through a series of high temperature dilution experiments, further making the case that these nanoparticles can be used as carriers for drugs and contrast imaging agents.
Introduction
Progress in drug therapy entails much more than the discovery of new pharmaceuticals. For example, the targeted and con-trolled release of a drug is a key aspect of drug therapy technology. One strategy for controlled release involves encap-sulating pharmaceuticals using biocompatible, unilamellar vesicles (ULVs) whose size can be manipulated. Current commercial examples of lipid-based systems include doxorubicin, ampho-tericin B, and the inactivated hepatitis A virus, which are used for treatments of cancers, systemic fungal infections, and hepatitis A, respectively.1-3
Since the initial proposal for the use of lipid based vesicles for the delivery of drugs by Bangham et al. in 1965, a variety of methods have been developed for producing them. Conven-tional methods for the production of small ULVs include sonication and multistage extrusion, while solvent dispersion methods, such as reverse phase evaporation and double emul-sion, are used to produce larger size ULVs.4-8Some drawbacks
associated with these techniques are: (a) the degradation and modification of phospholipids (i.e., oxidation, hydrolysis, de-naturation, etc.); (b) difficulties in producing monodisperse size ULVs; and (c) low throughput. Spontaneous forming ULVs can be obtained through detergent removal techniques (i.e., dilution, dialysis, gel exclusion chromatography, adsorption onto poly-meric materials, temperature changes, or biochemical reactions) using micellar solutions,9however, their biocompatibility may
be compromised by detergent contamination, and controlling their size is not straightforward.
The ULVs in question are composed exclusively of phos-pholipids [i.e., dimyristoyl phosphatidylcholine (DMPC), dimyris-toyl phosphatidylglycerol (DMPG), and dihexanoyl phosphati-dylcholine (DHPC)] in aqueous solution, which undergo a micelle-to-vesicle transition above a critical temperature (Tc).
This system has been reported to produce stable and reasonably monodisperse ULVs with radii ranging from between 10 and 40 nm.10-12 Previously, mechanisms for their spontaneous
formation have been proposed.13-15Experimental data of the
current lipid mixture have indicated that ULVs are thermody-namically stable, despite the fact that their final size depends on the path of formation.16Several kinetic studies have shown
that bilayered micelles (also known as “bicelles”) are a precursor morphology to ULVs.15,16 In some cases, ULVs are formed
immediately upon mixing of the components,15 while in the
current system, ULV formation takes place at a temperature T > Tc, whereupon bicelles begin to coalesce. This system allows
one to control the rate of bicelle coalescence, thus enabling us to better understand how these ULVs are formed. Moreover, unlike most of the other spontaneously formed ULV systems whose size is concentration (Clp) dependent,17,18DMPC/DMPG/
DHPC ULVs at Clpe 0.33 wt % are stable over a period of up
to 4 months at 4 °C and a few weeks at 45 °C.11,12These ULVs
also possess two temperature-dependent release mechanisms, making them suitable candidates for drug delivery purposes.19
It is known that net charge density is a key parameter in determining the morphology of DMPC/DMPG/DHPC mix-tures.11One method of introducing surface charge onto bilayers
is by doping with DMPG. DMPG has the same hydrocarbon chains as those of DMPC, and is known to stabilize bicelles through electrostatic repulsion, which inhibits bicelles from fusing, as well as increasing membrane rigidity.20A previous
report showed a non DMPG doped system ([DMPG]/[DMPC] ) 0) formed MLVs due to insufficient Coulombic repulsion between bilayers, while a highly doped system ([DMPG]/ [DMPC] ) 6.7%) formed bicelles which were unable to fuse and form ULVs at T > Tc.21
The present study focuses on the kinetics of aggregate structures that evolve from the bicelle-to-ULV transition under different temperature protocols as determined by small angle neutron scattering (SANS). The influence of charge density with regards to ULV size and polydispersity are also investigated. Finally, the stability of monodisperse ULVs after high
temper-* Corresponding author. E-mail: mu-ping.nieh@nrc.gc.ca. †Biomedical Engineering Graduate Program.
‡Department of Chemical and Biochemical Engineering. §Steacie Institute for Molecular Science.
10.1021/jp9106684 2010 American Chemical Society Published on Web 04/13/2010
ature (high-T) dilution is examined. This study not only provides further insight into the mechanism of ULV formation, but also illustrates some of the methods that can be used to control their size.
Methodology
Sample Preparation. 1,2-Dimyristoyl-phosphatidylcholine (DMPC), 1,2-dimyristoyl-phosphatidylglycerol (DMPG), and 1,2-dihexanoyl-phosphatidylcholine (DHPC) were purchased from Avanti Polar Lipids (Alabaster, AL) and used without further purification. Three different sample solutions were prepared by codissolving the lipids at a fixed molar ratio of [DMPC]/[DHPC] ) 3.3 and various molar ratios of [DMPG]/ [DMPC] (i.e., 0.3, 0.8, and 1.5%) in deuterium oxide (99.9% D2O, Chalk River Laboratories, Chalk River, Canada). The
initial lipid concentration (Clp) for all samples was 10 wt.%,
and each sample was vortexed and temperature cycled between 4 and 50 °C. After doing this, samples were equilibrated at T ) 4 °C for 24 h. All samples were gradually diluted in a stepwise fashion (i.e., Clp ) 5 and 2 wt %) to a final Clp of
either 0.3 or 0.1 wt % using 4 °C D2O. Some 0.3 wt % samples,
which included all [DMPG]/[DMPC] ratios, were slowly annealed at T ) 20, 25, 30, and 50 °C for approximately 2 h per temperature. A second set of 0.3 and 0.1 wt % samples (diluted from 4 °C 0.3 wt % mixtures) were T-jumped from 4 to 50 °C and then kept at 50 °C for more than 12 h. Finally, some 0.1 wt % samples were prepared by diluting 0.3 wt % ([DMPG]/[DMPC] ) 0.8 and 1.5%) samples at 50 °C. These samples were used to compare to the same wt % samples that were diluted at 4 °C and then T-jumped to 50 °C.
SANS.SANS experiments were conducted at the 30 m NG3-SANS22located at NIST (National Institute of Standards and
Technology) Center for Neutron Research (NCNR, Gaithers-burg, MD). 6 Å wavelength (λ) neutrons with a ∆λ/λ of 11% were used. Sample-to-detector distances (SDDs) of 1, 5, and 13 m were used, with a detector offset of 20 cm in the case of SDD ) 1 m. This resulted in a range of total scattering vector (q) of 0.003 Å-1< q < 0.35 Å-1[q ) 4π/λ sin(θ/2), where θ
is the scattering angle]. Raw data were corrected for sample transmission, ambient background (blocked beam) and empty cell scattering (also corrected for empty cell transmission). The data were then circularly averaged to yield a 1-D scattering intensity profile, which was placed on an absolute scale (cross section per unit volume) using the incident neutron beam flux. Incoherent scattering was obtained from the high q region and subtracted from the data. These procedures were conducted using a data reduction program (in IGOR-Pro) developed by NCNR.
Data Analysis.Most of the SANS data presented here can be fit using either a core shell disk model (in the case of bicelles) or a polydisperse spherical single shell model (in the case of ULVs).
Core Shell Disk Model. This model is used to describe bilayered disks composed of phospholipids in solution, where the hydrophilic heads populate the disk’s surface forming a shell of uniform thickness t. The disk’s core is made up of the phospholipid’s hydrophobic fatty acid chains and has a radius
Rand a thickness L (Figure 1A). The core-shell disk model assumes monodisperse bicelles thus reducing the number of fitting parameters, while at the same time adequately describing the SANS data. In the case of dilute solutions, the form factor
Pdisk(q) is proportional to the scattering function I(q) which can
be written as φlipidPdisk(q), where φlipidrepresents the lipid volume
fraction. The neutron scattering length densities (SLDs) of the solvent, the disk’s core and disk’s shell are represented by Fsolvent,
Fhydrophobic, and Fhydrophilic, respectively, and relate to each other
as follows:23,24
where
where J1(x) is the first-order Bessel function; R is defined as
the angle between the cylinder axis and the scattering vector,
q. Integrating over R averages the form factor over all possible disk orientations. Vhydrophobic()πR2L) and Vhydrophilic[)π(R + t)2(L + 2t)] are the volume of the hydrophobic core and
hydrophilic shell, respectively. In fitting the data, SLDs were constrained to the calculated Fsolvent(6.38 × 10⁻⁶Å-2), while
values for Fshell () 3.3 × 10⁻⁶Å-2due to inclusion of D2O)
and Fcore() -4.3 × 10⁻⁷Å-2) were fixed at values obtained
from literature.25,26
Figure 1. (A) Bilayered micelles (bicelles) described by the simplified core shell disk model possessing a hydrophobic core of radius R and thickness L, and a hydrophilic shell of thickness t. (B) ULVs are described by the polydisperse spherical shell model of inner radius Ri, an outer
radius Ro, and a polydispersity p.
I(q) ) φlipidPdisc(q) )
∫
0π/2f2(q, R) sin RdR Vhydrophilic (1)
f(q, R) ) 2(Fhydrophobic- Fhydrophilic) × Vhydrophobic sin
(
qL 2cos R)
(
qL 2cos R)
× J1(qR sin R)(qR sin R) + 2(Fhydrophilic- Fsolvent)Vhydrophilic
sin
[
q(
L 2 + t)
cos R]
[
q(
L 2+ t)
cos R]
× J1[q(R + t) sin R] [q(R + t) sin R]where Γ(1/p2) is the gamma function used to normalize the
distribution function, 〈Ri〉 is the average inner radius of the
vesicle () Ro- bilayer thickness, tbilayer), and Vvesicleis the total
ULV volume [i.e., (4π/3)(r + t)3] at the inner radius ) r. The
fitting parameters therefore include 〈Ri〉, p, and tbilayer [eq 2].
Both fitting models were developed in IGOR-Pro by NCNR.28 Cryogenic Transmission Electron Microscopy (Cryo-TEM). Cryo-TEM was used to image the ULVs. Sample vitrification was performed using an environmentally controlled FEI Vitrobot Mark IV (FEI Worldwide Corp., Oregon) vitiri-fication system.29The sample (2µL) was placed onto the TEM
grid and the excess solution was removed from the grid by blotting with a filter paper. The sample was then vitrified by plunging the grid into liquid ethane and immediately transferred on to a cold sample stage (T ) -170 °C) suitable for the FEI Tecnai G2 transmission electron microscope (FEI Worldwide corp., Oregon), which operates at an accelerating voltage of 200 kV in the filtered bright field image mode.
Results
Effect of Charge Density.The effect of charge density on ULV formation was examined by studying ULV size at a number of [DMPG]/[DMPC] ratios (i.e., 0.3, 0.8, and 1.5%) and Clp ) 0.3 wt %. Figure 2 shows SANS data of the three
samples at T ) 50 °C that were slowly annealed from 4 °C. A peak (q ∼ 0.1 Å-1) associated with the presence of MLVs is
observed in the sample with the lowest charge density ([DMPG]/ [DMPC] ) 0.3), consistent with a previous report on zwitteri-onic mixtures.11For the two other charge density samples, SANS
data were best-fit with the polydisperse spherical shell model (solid curves). The best-fit values for 〈Ri〉 are 770 ( 70 Å and
134 ( 8 Å in the case of [DMPG]/[DMPC] ) 0.8 and 1.5%, respectively, indicating that increased charge density yields smaller ULVs (by a factor of ∼6). The fact that cryogenic transmission electron microscopy (cryo-TEM; Figure 3) reveals ULVs with a similar average size at a corresponding condition further confirms the validity of the model used to fit the SANS data. To the best of our knowledge this is the most significant
effect on ULV size reported thus far regarding this system. In addition, charge density also seems to affect the size distribution of ULVs. The relative polydispersities of both systems are comparable to each other, while the absolute deviation,σ, in the case of the [DMPG]/[DMPC] ) 0.8% sample is three times larger than that of the [DMPG]/[DMPC] ) 1.5% sample.
To study the transition from bicelles to ULVs, SANS experiments were conducted as a function of temperature (i.e., 20, 25, 30, and 50 °C). For the lowest charge [DMPG]/[DMPC] ) 0.3% system and Clp ) 0.3 wt %, the solution was visibly
opaque indicating the presence of MLVs; also confirmed by the presence of an MLV peak that was present at all temper-atures (data not shown). The situation was different, however, in the case of the [DMPG]/[DMPC] ) 0.8% and Clp) 0.3 wt
% sample, where ULVs formed at low temperature and remained unaltered throughout the range of temperatures studied (data not shown). In the case of the highest charge density sample (i.e., [DMPG]/[DMPC] ) 1.5% and Clp) 0.3 wt %), a
clear transition from bicelles to ULVs is observed between 25 and 30 °C (Figure 4). The best-fit structural parameters obtained from the core shell disk (20 and 25 °C) and polydisperse spherical shell models (30 and 50 °C) are summarized in Table 1. R is found to increase from 266 ( 10 Å to 349 ( 15 Å, as
Tis increased from 20 to 25 °C, in agreement with the notion that, prior to forming ULVs bicelles coalesce as temperature is increased.15Between 25 and 30 °C a phase transition takes place,
as indicated by the oscillation at q ∼ 0.025 Å-1. Despite this,
from the SANS data we cannot rule out the coexistence of bicelles and ULVs. 〈Ri〉 of ULV decreases slightly as
temper-ature is increased from 30 to 50 °C, indicating that the ULV Figure 2. SANS data and best-fits (solid lines) to the data for Clp)
0.3 wt % samples at T ) 50 °C: [DMPG]/[DMPC] ) 0.3 (squares), 0.8 (circles), and 1.5% (triangles). For viewing, scaling factors of 0.2 and 0.02 were used for [DMPG]/[DMPC] ) 0.8 and 1.5% samples, respectively. For [DMPG]/[DMPC] ) 0.8 and 1.5% data, the best-fits to the data were obtained using the polydisperse spherical shell model. A peak at ∼0.1 Å-1, normally associated with MLVs, is observed for
the [DMPG]/[DMPC] ) 0.3% sample.
Figure 3. Cryo-TEM image of [DMPG]/[DMPC] ) 1.5% ULVs in a
Clp) 0.3 wt % solution after slow thermal annealing.
Pvesicle(q) )
∫
0∞ 1 Vvesiclef(r)A0 2 (q, r)dr (2) A0(q, r) ) 4π(Flipid - Fsolvent) q3 {sin[q(r + t)]-q(r + t) cos[q(r + t)] - sin(qr) + qr cos(qr)}
f(r) )
(
p-2/p2)
(
r 〈Ri〉)
(1-p2)/p2 e-r/p2〈Ri〉 〈Ri〉Γ(
1 p2)
structure is unaltered, but that a small amount of lipid (presum-ably DHPC) dissolves in the aqueous phase. The best-fit shell thicknesses all fall within an acceptable range (∼32 Å), but slightly smaller than the literature value of ∼35 Å.30Moreover,
all the best-fit volume fractions are within 25% of the prepared lipid total concentration, indicating the best-fit models are adequate representations of the morphologies present.
Because almost all of the lipids have the same phosphati-dylcholine headgroup, to a first approximation the total surface area of the aggregate morphology is assumed to be proportional to the number of lipids. Therefore, a bicelle’s surface area, Ab,
can be estimated (based on the midpoint of the hydrophilic layer) using the best-fit parameters as follows:
A 60% increase in the average surface area of individual bicelles (from 5.3 × 10⁵Å2to 8.7 × 10⁵Å2) with increasing temperature
(from 20 to 25 °C) confirms the notion that bicelles grow as a result of increased line tension caused by the loss of DHPC molecules that occupy the bicelle’s edge.16In the case of ULVs,
from the Schulz distribution function, f(Ri), the ULV surface
area (both bilayers leaflets) can be determined (Figure 5). The average total ULV surface area, Av, is thus calculated through
the integration of the distribution function (Figure 5). Av at
30 °C is calculated to be 5.8 × 10⁵Å2, which is larger than the Abof bicelles at 20 °C, and is the result of bicelles coalescing.
However, the calculated Avof 30 °C ULVs is ∼35% less than
the Abof bicelles at 25 °C. Although this result can be partially
explained by the loss of DHPC (∼23% of the total lipid) from the bicelles into the aqueous phase, we cannot explain the bulk
of this difference. At this point, we speculate that 25 °C bicelles may contain defects (i.e., perforations), an artifact of bicelle coalescence. However, it should be stressed that bicelle radius is a robust measure as it is model independent (location where the lines that define the two slopes in the data set intersect; e.g. ∼0.0045 Å-1in the case of [DMPG]/[DMPC] ) 1.5%; Figure
4). The model simply is used to determine the morphology and its precise dimensions through the fitting of the data over the entire q range.
Effect of Thermal Path on the Size of ULVs. ULV size distribution was examined as the lipid mixtures underwent two very different thermal path histories, namely, a T-jump and slow annealing. Comparison of the SANS data and their correspond-ing best-fits uscorrespond-ing the polydisperse spherical shell model is presented in Figure 6. Interestingly, the resultant ULV radii in the case of the [DMPG]/[DMPC] ) 0.8% sample are very different, that is, 172 ( 10 and 770 ( 70 Å (Table 2) in the case of T-jump and slow temperature annealing processes, respectively. The size variation of ULVs with higher charge density ([DMPG]/[DMPC] ) 1.5%) follows the same trend but is not affected to the same extent, that is, 〈Ri〉 is 89 ( 2 Å for
T-jump and 134 ( 8 Å for slow temperature annealing (Table 2). Interestingly, the best-fit volume fractions in both T-jump samples seem to be much less than the prepared lipid concentra-tions, implying that there could be other types of large aggregates coexisting with ULVs, and which do not contribute to the scattering intensity over the q range examined. Moreover, the shell thickness of the T-jump [DMPG]/[DMPC] ) 0.8% sample is always best-fit to the lower constraint value of ∼25 Å, which is significantly different from the value found in the literature,30 indicating that the spherical shell model used is
inadequate in describing the entire q range data. However, it should be pointed out that the size of ULVs is mainly determined by the oscillation of the SANS data (q ∼ 0.01 Å-1), thus, the
value for this morphological feature is robust.
Concentration Effect on Size and ULV Stability. ULV stability as a function of total lipid concentration was examined through dilution at high temperature (from Clp) 0.3 to 0.1 wt
Figure 4. SANS data and best-fits (solid lines) to the data for the [DMPG]/[DMPC] ) 1.5% and Clp ) 0.3 wt % sample at various
temperatures: T ) 20 (diamonds), 25 (squares), 30 (triangles), and 50 °C (circles). The bicelle-to-ULV phase transition takes place between 25 and 30 °C. Core-shell disk (bicelle) and polydisperse spherical shell (ULV) models were used to fit the data. The dotted lines indicate the two slopes present in the scattering data (25 °C). Their intersection at
qintersect∼0.0045 Å-1reveals the largest dimension of the aggregates,
that is, the diameter of the bicelles whereπ/qintersect∼2(〈R〉 + t).
TABLE 1: Best-Fit Structural Parameters for the [DMPG]/[DMPC] ) 1.5% and Clp) 0.3 wt % Sample Obtained Using the
Core Shell Cylinder Model to Fit the Low Temperature Data (T ) 20 and 25 °C) and the Polydisperse Spherical Shell Model to Fit the High Temperatures Data (T ) 30 and 50 °C)
bicelle vesicle T(°C) 〈R〉 (Å) t(Å) L(Å) Ab(Å2) 〈Ri〉 (Å) tbilayer(Å) p Av(Å2) 20 266 ( 10.0 10.0 ( 2.0 32.0 ( 4.0 (5.3 ( 0.6) × 105 25 349 ( 15.0 9.5 ( 2.0 30.0 ( 4.0 (8.7 ( 1.0) × 105 30 134 ( 5.0 32.6 ( 3.0 0.21 ( 0.03 (5.8 ( 0.5) × 105 50 134 ( 8.0 31.0 ( 3.0 0.22 ( 0.03 (5.8 ( 0.7) × 105
Figure 5. Schulz distribution function for the average inner radius (solid line) and total surface area (dashed line) of [DMPG]/[DMPC] ) 1.5% (Clp) 0.3%) ULVs at T ) 30 °C.
Ab) 2π(〈R〉 + t/2)2+ 2π(〈R〉 + t/2)(L + t) (3)
%) and is compared to 0.1 wt % samples diluted at low temperature (i.e., 4 °C) and heated to 50 °C. Figure 7 shows SANS data and their corresponding best-fits for Clp) 0.3 and
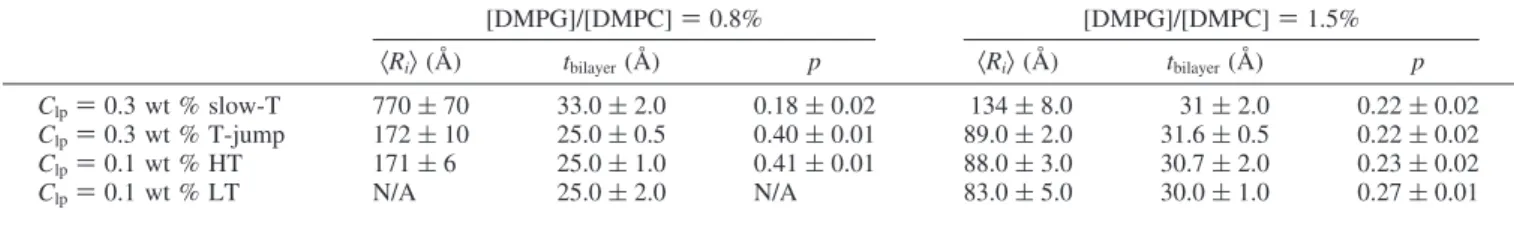
0.1 wt % samples prepared via a high-T and low-T dilution, respectively. The best-fits to the data are in excellent agreement with each other indicating that ULVs retain their morphology after high-T dilution for both charge densities. Moreover, low-T dilution clearly causes more polydisperse samples, whereby in the case of the [DMPG]/[DMPC] ) 0.8% sample, the ULV size could not be determined. The extremely thin shell thickness obtained from the best-fits to the data can be attributed to the same aforementioned reason (i.e., inadequate model). In the case of [DMPG]/[DMPC] ) 1.5%, the size differences between low-T and high-T dilution are insignificant.
Discussion
The three stages of ULV formation reported previously are: (1) the formation of uniform size bicelles; (2) coalescence of bicelles into large uniform size bicelles; and (3) the folding of bicelles into ULVs.15,16,31Stage (1) is essential in the formation
of uniform size ULVs, while stage (2) determines the final size and polydispersity of the ULVs (discussed in detail in this section).
Effect of Charge Density. Earlier studies examining the effect of charge on ULV formation have demonstrated that insufficient or excess charge densities can inhibit their formation and instead, result in the formation of MLVs (insufficient charge) or bicelles (excess charge).21 Here we focused on a
narrower range of charge densities (i.e., [DMPG]/[DMPC] ) 0.3, 0.8, and 1.5%) in order to gain a more detailed understand-ing of the system studied, as summarized in Figure 8.
Low Charge Density.The results of the weakly doped system ([DMPG]/[DMPC] ) 0.3 wt %) are similar to those of a neutral system ([DMPG]/[DMPC] ) 0), where MLVs were observed.21
In the case where there is an insufficient amount of charge to cause bilayers to unbind, MLVs are the stable morphology.32
The present system forms an opaque liquid indicative of MLVs for all temperatures studied, a result confirmed by SANS.
Intermediate Charge Density.At a moderate charge density ([DMPG]/[DMPC] ) 0.8%), ULVs are observed at all temper-atures indicating that ULVs can form even in the absence of liquid crystalline DMPC, which undergoes a melting transition temperature at around 23 °C. This result differs from what was previously reported in samples with higher charge densities16
and can be rationalized as follows: In the case of bicelles being a kinetically trapped morphology (i.e., thermodynamically unstable), collision frequency between bicelles is expected to increase as a function of decreasing charge density (i.e., less Coulombic repulsion). This results in larger size bicelles, which eventually form larger size ULVs. If on the other hand, the bicelles are thermodynamically stable, DMPG may play an important role in retaining the short-chain DHPC within the bicelles and thus, preventing them from growing.
TABLE 2: Structural Parameters Obtained from the Best-Fits to the Data for Clp) 0.3 and 0.1 wt % Samples Diluted at High
Temperature (HT) and Low Temperature (LT), Respectively
[DMPG]/[DMPC] ) 0.8% [DMPG]/[DMPC] ) 1.5% 〈Ri〉 (Å) tbilayer(Å) p 〈Ri〉 (Å) tbilayer(Å) p Clp) 0.3 wt % slow-T 770 ( 70 33.0 ( 2.0 0.18 ( 0.02 134 ( 8.0 31 ( 2.0 0.22 ( 0.02 Clp) 0.3 wt % T-jump 172 ( 10 25.0 ( 0.5 0.40 ( 0.01 89.0 ( 2.0 31.6 ( 0.5 0.22 ( 0.02 Clp) 0.1 wt % HT 171 ( 6 25.0 ( 1.0 0.41 ( 0.01 88.0 ( 3.0 30.7 ( 2.0 0.23 ( 0.02 Clp) 0.1 wt % LT N/A 25.0 ( 2.0 N/A 83.0 ( 5.0 30.0 ( 1.0 0.27 ( 0.01
Figure 7. SANS data of [DMPG]/[DMPC] ) 0.8 (gray) and 1.5% (black) samples at 50 °C and Clp) 0.3 wt % (circles). Clp) 0.1 wt %
samples were obtained by either diluting a 0.3 wt % sample at high temperature (squares) or at low temperature (triangles). The ULV morphology was unaffected by high temperature dilution. The solid lines are the best-fits (polydisperse shell sphere model) to the data.
Figure 8. Schematic of the morphologies present in the various DMPG doped Clp ) 0.3 wt % systems as a function of temperature. The
symbols indicate MLVs (concentric spheres), ULVs (hollow sphere), and bicelles (disks).
Figure 6. SANS data and best-fits (solid lines) to the data comparing T-jump (squares) and slow annealing (circles) studies for Clp) 0.3 wt
% samples at 50 °C, and [DMPG]/[DMPC] ) 0.8 (gray) and 1.5% (black). ULVs are found throughout, while their size is larger in the case of the slow temperature annealing process.
High Charge Density.Increasing charge density ([DMPG]/ [DMPC] ) 1.5%) results in bicelles appearing at low temper-ature and ULVs at high tempertemper-ature. This transition between bicelles and ULVs takes place somewhere between 25 and 30 °C, slightly greater than Tmfor DMPC (23 °C). In fact, Tc
has been reported to increase with increasing Clp and charge
density.11The [DMPG]/[DMPC] ) 1.5% ULVs are smaller than
those of [DMPG]/[DMPC] ) 0.8% either because they experi-ence less collisions (i.e., less opportunities to coalesce into larger bicelles) or they are more stable with higher content of DMPG.
Effect of Thermal Path.One of the most interesting findings of the present study is the dramatic difference in ULV size as a function of different thermal annealing (slow annealing vs T-jump, as shown in Figure 6). The slow temperature annealing process effectively prolongs the coalescing period (stage 2), thus increasing the probability of bicelle collisions, and eventually results in the formation of larger ULVs. The fact that this effect is not as significant in the case of the higher charge density sample (i.e., [DMPG]/[DMPC] ) 1.5%, as shown in Table 2) is most likely the result of strong Coulombic repulsion. Nevertheless, an 80 Å increase in bicellar radius over 5 °C (i.e., from 20 to 25 °C) in approximately 2 h still supports the notion of bicelles growing through collisions with one another, even at higher charge densities. Interestingly, for the intermediate charge [DMPG]/[DMPC] ) 0.8% (0.3 wt %) sample, large ULVs are found at low temperatures, while the same sample experiencing a T-jump yields much smaller ULVs. This observation implies that for this system stage 3 takes place at low temperatures on the order of minutes compared to seconds for the T-jump and hours for SANS data collection.
Effect of Clpand Stability of ULVs.The size invariance of
the current spontaneously formed ULVs as a function of Clp
and thermal annealing protocol is a distinct advantage over other surfactant systems,10,11where ULV size depends on C
lp.19,25In
fact, both of these observations can be explained by the proposed mechanism of ULV formation.15,16The size of low temperature
bicelles has been reported to be weakly dependent on Clp.21,25
If we assume that the collision frequency of aggregates in the case of higher Clp samples is greater than that of lower Clp
samples, it then follows that larger ULVs are expected to form in the case of high Clpsamples. The present SANS data only
show small differences in ULV size between Clp) 0.3 and 0.1
wt % samples, probably due to the already low frequency of bicelle coalescence in Clp) 0.3 wt % samples. However, ULV
size should not change if the system is diluted at or after stage 3, where ULVs are the stable morphology. The invariance of ULV size seen here for high and intermediate charge density samples undergoing high temperature dilution is consistent with the proposed mechanism, implying that ULVs are stable.
Conclusion
Spontaneously formed ULVs with low polydispersities (p < 0.3) are found in samples of [DMPG]/[DMPC] ) 0.8 and 1.5%. An important observation is that the temperature-induced bicelle-to-ULV transition observed in 1.5% samples is one method, whereby low polydispersity ULVs are produced. In the case of [DMPG]/[DMPC] ) 0.8%, the existence of uniform size ULVs at low temperature implies that differences in solubility between DMPC and DHPC in water and, with each other, may not be the only factors needed for the formation of ULVs. From the present study it has become clear that the collision frequency of bicelles as a function of charge density also plays a significant role in ULV formation. A more detailed study of bicelle growth as a function of annealing time will be able to determine the
collision rate. A minimum charge density has been shown to be necessary for the formation of ULVs in the case of [DMPG]/ [DMPC] ) 0.3% samples, which otherwise form MLVs, regardless of temperature. It is also shown that ULV size is strongly correlated with bicelle folding (“stage 3” as mentioned in the discussion), which is controlled either through the amount of charge or the period of time in which bicelles are permitted to coalesce into larger bicelles (stage 2). In fact, through the interplay of charge density and thermal protocol, ULV radius is found to vary by as much as a factor of 6, revealing the possibility for the formation of a range of ULV sizes, depending on their application. Finally, the observation that stable ULVs can be formed when samples are diluted at high temperature further verifies the insensitivity of ULVs to Clp. Further work,
however, is necessary to better understand how to control, in a robust manner, the size of these nanoparticles to extend their possible applications. Nevertheless, the current method for creating self-assembled ULVs may be useful when it comes to producing these structures in industrial relevant quantities, which can then be used to great advantage in pharmaceutical applications.
Acknowledgment.The authors thank Mr. Robert Harris at the University of Guelph and Dr. Steven Kline at NCNR for their technical support of cryo-TEM and SANS, respectively, as well as the referees for their helpful comments. S.M. also thanks the Ontario Graduate Scholarship and the Canadian Institutes of Health Research (CIHR) for a training fellow grant in vascular research. This work utilized facilities supported in part by the National Science Foundation under Agreement No. DMR-9986442.
References and Notes
(1) Safra, T.; Muggia, F.; Jeffers, S.; Tsao-Wei, D. D.; Groshen, S.; Lyass, O.; Henderson, R.; Berry, G.; Gabizon, A. Ann. Oncol. 2000, 11 (8), 1029–1033.
(2) Janknegt, R.; de Marie, S.; Bakker-Woudenberg, I. A.; Crommelin, D. J. Clin. Pharmacokinet. 1992, 23 (4), 279–291.
(3) Ambrosch, F.; Wiedermann, G.; Jonas, S.; Althaus, B.; Finkel, B.; Gl′′uck, R.; Herzog, C. Vaccine 1997, 15 (11), 1209–1213.
(4) Bangham, A. D.; Standish, M. M.; Watkins, J. C. J. Mol. Biol.
1965, 13 (1), 238.
(5) Johnson, S. M.; Bangham, A. D.; Hill, M. W.; Korn, E. D. Biochim.
Biophys. Acta 1971, 233 (3), 820–826.
(6) Olson, F.; Hunt, C. A.; Szoka, F. C.; Vail, W. J.; Papahadjopoulos, D. Biochim. Biophys. Acta 1979, 557 (1), 9–23.
(7) Szoka, F.; Papahadjopoulos, D. Proc. Natl. Acad. Sci. U.S.A. 1978,
75(9), 4194–4198.
(8) Van Der Graaf, S.; Schroen, C.; Boom, R. J. Membr. Sci. 2005,
251, 7–15.
(9) Ollivon, M.; Lesieur, S.; Grabielle-Madelmont, C.; Paternostre, M.
Biochim. Biophys. Acta 2000, 1508, 34–50.
(10) Nieh, M. P.; Harroun, T. A.; Raghunathan, V. A.; Glinka, C. J.; Katsaras, J. Phys. ReV. Lett. 2003, 91 (15), 158105–158109.
(11) Nieh, M. P.; Harroun, T. A.; Raghunathan, V. A.; Glinka, C. J.; Katsaras, J. Biophys. J. 2004, 86 (4), 2615–2629.
(12) Yue, B.; Huang, C. Y.; Nieh, M. P.; Glinka, C. J.; Katsaras, J. J.
Phys. Chem. B 2005, 109 (1), 609–616.
(13) Lasic, D. D. Biochem. J. 1988, 256 (1), 1–11.
(14) Goltsov, A. N.; Barsukov, L. I. J. Biol. Phys. 2000, 26 (1), 27–41. (15) Leng, J.; Egelhaaf, S. U.; Cates, M. E. Biophys. J. 2003, 85 (3), 1624–1646.
(16) Nieh, M. P.; Raghunathan, V. A.; Kline, S. R.; Harroun, T. A.; Huang, C. Y.; Pencer, J.; Katsaras, J. Langmuir 2005, 21 (15), 6656–6661. (17) Oberdisse, J.; Couve, C.; Appell, J.; Berret, J. F.; Ligoure, C.; Porte, G. Langmuir 1996, 12 (5), 1212–1218.
(18) Lesieur, P.; Kiselevc, M. A.; Barsukovd, L. I.; Lombardoa, D.
J. Appl. Crystallogr. 2000, 33 (3), 623–627.
(19) Nieh, M. P.; Katsaras, J.; Qi, X. Biochim. Biophys. Acta 2008, 1778 (6), 1467–1471.
(20) Katsaras, J.; Harroun, T. A.; Pencer, J.; Nieh, M. P.
Naturwissen-schaften 2005, 92 (8), 355–366.

![Figure 3. Cryo-TEM image of [DMPG]/[DMPC] ) 1.5% ULVs in a C lp ) 0.3 wt % solution after slow thermal annealing.](https://thumb-eu.123doks.com/thumbv2/123doknet/14147095.471288/4.883.507.776.65.272/figure-cryo-image-dmpg-dmpc-solution-thermal-annealing.webp)
![TABLE 1: Best-Fit Structural Parameters for the [DMPG]/[DMPC] ) 1.5% and C lp ) 0.3 wt % Sample Obtained Using the Core Shell Cylinder Model to Fit the Low Temperature Data (T ) 20 and 25 °C) and the Polydisperse Spherical Shell Model to Fit the High Tempe](https://thumb-eu.123doks.com/thumbv2/123doknet/14147095.471288/5.883.117.372.65.266/structural-parameters-sample-obtained-cylinder-temperature-polydisperse-spherical.webp)