HAL Id: hal-02502226
https://hal-amu.archives-ouvertes.fr/hal-02502226
Submitted on 9 Mar 2020
HAL is a multi-disciplinary open access
archive for the deposit and dissemination of
sci-entific research documents, whether they are
pub-lished or not. The documents may come from
teaching and research institutions in France or
abroad, or from public or private research centers.
L’archive ouverte pluridisciplinaire HAL, est
destinée au dépôt et à la diffusion de documents
scientifiques de niveau recherche, publiés ou non,
émanant des établissements d’enseignement et de
recherche français ou étrangers, des laboratoires
publics ou privés.
Distributed under a Creative Commons Attribution| 4.0 International License
Screen Distance, Environment Richness and Display
Factors
Cyril Vienne, Stéphane Masfrand, Christophe Bourdin, Jean-Louis Vercher
To cite this version:
Cyril Vienne, Stéphane Masfrand, Christophe Bourdin, Jean-Louis Vercher. Depth Perception in
Virtual Reality Systems: Effect of Screen Distance, Environment Richness and Display Factors. IEEE
Access, IEEE, 2020, 8, pp.29099-29110. �10.1109/ACCESS.2020.2972122�. �hal-02502226�
Depth Perception in Virtual Reality Systems:
Effect of Screen Distance, Environment Richness
and Display Factors
CYRIL VIENNE 1, STÉPHANE MASFRAND2, CHRISTOPHE BOURDIN 1, AND JEAN-LOUIS VERCHER1
1Aix-Marseille University, CNRS, ISM, 13007 Marseille, France 2Groupe PSA, 78943 Vélizy-Villacoublay, France
Corresponding author: Cyril Vienne ([email protected]) This work was supported by the PSA Groupe.
ABSTRACT Viewing a scene on a screen display differs greatly from viewing it in the real world. The visual information is conveyed via a flat screen at a fixed distance, and this screen distance can influence how viewers perceive depth in stereograms in conventional stereoscopic displays. This study investigated whether screen distance influences perceived depth in Virtual Reality (VR) systems providing additional motion parallax information. Participants adjusted the depth of a vertical dihedron displayed as a random-dot stere-ogram. In a first experiment, the stimulus was presented either alone in a gray untextured background or in a cue-rich environment. We found that despite the extra motion parallax information in VR systems compared to conventional stereo-displays, physical screen distance still affected depth perception substantially at longer simulated distances. However, the effect lessened when observers were immersed in a rich and structured environment, possibly allowing them to use other depth cues. A second experiment assessed the influence of potentially potent display-related factors (resolution, display orientation, luminance non-uniformity, and specular reflection), as well as the effect of accommodation-vergence (A-V) conflict size. Depth perception was compared between a Head-Mounted Display (HMD) and an L-shaped system, and between a CAVE and an L-shaped system. These comparisons between CAVE-like VR systems and HMDs revealed that A-V conflict and inclusion of a rich environment were the major factors impacting depth perception. These results have practical and methodological implications for the reliable use of VR systems, especially where accurate depth-matching is involved.
INDEX TERMS Conflict, depth, distance, virtual reality, perception.
I. INTRODUCTION
Virtual Reality (VR) systems are increasingly employed in a range of industrial applications, as well as for research. Indus-try uses VR for visualizing prototypes, for training operators, and even for designing new products. In research, VR sys-tems are widely used as research instruments in experimental psychology and display science due to their versatility. Obvi-ously, therefore, these popular systems need to deliver a high-fidelity experience of the depicted virtual scenes. However, many users continue to complain about perceptual distortions of the spatial properties of the scenes or the objects included.
The associate editor coordinating the review of this manuscript and approving it for publication was Michele Nappi .
Findings from several studies indicate that distance is misper-ceived in VR systems [1]–[3]. Possible causes suggested for these misperceptions include image resolution and clarity [4], limited field-of-view [5], lack of depth cues [6], familiarity [7], use of wrong inter-ocular distance for rendering the scene [8]. Renner et al. [3] classified these factors in four main categories: technological, compositional, human, and measurement factors. Here, we consider that human factors encompass compositional ones, and that measurement factors are not specific to issues of misperceptions in VR. Therefore, the overall goal of the present study was to determine whether it is the human or the technological factors that predominate. Our results suggest that the majority of perceptual distortions in VR systems are best explained by human factors.
A prominent source of distortion in VR systems is the fact that, unlike real viewing, light is emitted on flat surface(s) at fixed distance(s). VR systems thus introduce a distance conflict between where the light is emitted and where it is intended to be simulated. As the human visual system needs to accommodate and converge to obtain a clear and single vision of the world, there is a distance conflict between accommodation and vergence stimuli [9]. The distance con-flict1in such displays often involves a fixed focal distance with varying simulated distance. The effect of screen distance on perceived depth was revealed under conventional stereo-scopic displays with no-head tracking [10]–[12]. Implicit in these studies is the idea that the greater the conflict between accommodation and vergence distances, the greater the per-ceptual bias. The larger the distance conflict size, therefore, the stronger perceptive distortions should be.
VR systems are stereoscopic displays surrounding the viewer in which visual information depends on head motion. Compared to conventional stereoscopic displays, such sys-tems provide the user with an additional ‘signal’ about depth and distance, called motion parallax. Motion parallax is the relative movement of images across the retina resulting from the movement of the observer or the translation of objects across her/his field of view. This provides a signal regarding relative depth [13] as well as information on absolute distance when it is scaled with extra-retinal information [14]. As a result, the perceptual problems occurring in conventional stereoscopic displays could be expected to be alleviated in VR systems. Because of human viewers’ ability to combine several sources of information [15] to perceive spatial dimen-sions, this additional cue should improve perception of depth and distance.
In real world experiments, the richness of spatial cues is controlled mainly by varying the amount of light in the environment. When well-lit and dark environmental condi-tions are compared, thus with the number of cues changed, spatial perception changes accordingly [16], [17]. One study on size perception in the real world [18] showed, by removing monocular cues to depth, that object size was judged as a function of its retinal size and independently of its distance. Another study on distance perception in real environments [17] showed that verbal estimations and blind walking were broadly more accurate in well-lit environments than in dark ones. Manipulating the number of cues in the visual envi-ronment has thus become a way to test the efficacy of cues relative to the task of the observer. Kunnapas [16], by varying the progressive availability of different cues, found that one of the most important cues to distance was retinal image size, and that successively increasing the number of cues increased distance range, accuracy of perception and confidence in the task. In studies on objects displayed in isolation, oculomotor cues played a role but were not efficient enough to provide constancy [19].
1We will refer to this distance conflict as the accommodation-vergence (A-V) conflict.
Perceptual problems have also been reported in VR sys-tems. A finding that has major implications for the use of VR systems is that more complex and structured environ-ments are generally more effective in eliciting correct spa-tial perception than empty ones [20]. A study performed in Head-mounted Displays (HMD) evaluated size percep-tion as a funcpercep-tion of simulated distance [21] but apparently found no indications for size constancy, presumably because a sparse environment was used. Kenyon et al. [22] eval-uated size constancy in a CAVE (Cave Automatic Virtual Environment)-like VR system, seeking to determine whether observers judge size through object distance or retinal image size. They manipulated the informational content of their experimental display by presenting either a cue-rich envi-ronment or a sparse one. Participants had to adjust the size of a virtual bottle with relation to a real one, while the virtual bottle was displayed at different simulated dis-tances. The authors found that when environmental cues were removed, observers tended to estimate size based on retinal image size regardless of distance, suggesting that distance information contained in the cue-rich environment was important for spatial perception. Similar results were obtained in another study [23] presenting the objects to be judged in an environment containing strong linear perspective information.
There are many types of virtual reality display, each with its own configuration (number of screens) and relative com-plexity. In terms of user-display interaction, there are two categories of VR system: those mounted on the head (HMD), composed of a pair of still screens placed in front of the eyes, and those that require the user to enter a place whose walls act as screens. HMD system screens are so close to the eyes that the eyes cannot focus on them, so optics enabling the accommodation distance and the corresponding virtual image to be set farther away have been designed. Moreover, compared to CAVE-like VR systems, HMD system optics affect the accommodation distance, and potentially create optical distortions related to type of lens and lens-screen configuration. Manufacturers usually do not supply details of the optical configuration of their HMD systems. However, these configurations can be expected to affect the visual system differently from those of a CAVE-like system. For example, if the accommodation distance of an HMD system is set at infinity, it will not provide the same A-V conflict size as a CAVE-like system with a two-meter observer-screen distance. For a simulated distance of ten meters, conflict size is larger in the latter and should lead to stronger perceptive distortions.
In the first part of this study, we investigate whether screen distance influences perceived depth in a CAVE-like Virtual Reality system providing additional motion par-allax information and more than a single screen dis-play (i.e. several faces). In the second part of this study, we compare three different VR systems and conclude that distance conflict is a major influencing factor.
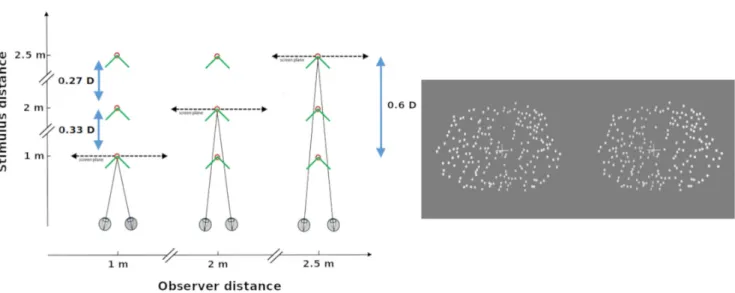
FIGURE 1. Left: Top view of variations applied to participant-screen distance and participant-object distance. Screen distance is depicted by dashed double arrows, object distance by red circles, and the top-view of the dihedral angle by green angles. Situations where there is no A-V conflict are represented with converging angles on the screen plane. Blue arrows represent dioptric separations and magnitude of the accommodation-vergence conflict. Right: Example of the stimulus arranged for cross-fusion: when fused, the random-dot stereogram represents a vertical dihedral angle. The fixation cross and the center of the angle were placed at eye height. Note that the angle cannot be perceived monocularly because texture is weakly informative.
II. EXPERIMENT 1
Since multiple cues can improve size constancy in real and virtual environments, the distance information available should help when scaling the size of a displayed object. From this first experiment, we can report that presenting a rich environment in VR displays improved depth perception while perceptual bias still occurred in a visually poor one.
A. METHOD 1) PARTICIPANTS
A total of 24 participants (16 men and 8 women), aged from 20 to 50 years (mean: 34.2 and SD: 8.9 years), took part in Experiment 1. Eleven were assigned to group 1 (depth estimations in an empty scene) and thirteen to group 2 (depth estimations in a cue-rich environment). All had normal or cor-rected vision and presented a stereoacuity threshold lower than 60 arcmin, as assessed by the Randot Stereo Test. They gave their informed consent before beginning the experiment.
2) VR SYSTEM
An L-shaped Virtual Reality system called the Holospace (Barco) was used at the Groupe PSA Research Center. There were three projection screens: front, ground and lateral (right) covering a total of 4 × 2.5 × 2.5 meters. These three sur-faces were illuminated by 3DLP projectors (Barco NW-12, 1920×1200 pixels). Front projection was used for the ground screen, via a set of mirrors, and back projection for the two other surfaces. Stereo-views were achieved through NVIDIA active 3D Vision glasses working at 120 Hz. Head motion was tracked using an ART system including 6 IR-cameras and the stereograms were adjusted accordingly. A wireless inter-action device (a Flystick) was used to record participants’
responses. The virtual environment was displayed using soft-ware Deltagen (RTT Dassault System) and the experimental scenario was built via a custom C++ program. The inter-axial separation between left-side and right-side simulated cameras was adjusted to each individual’s inter-ocular dis-tance as measured with a Pupil Disdis-tance Meter (NH-L8).
3) DISTANCES CONDITIONS
A set of different participant-screen (i.e. accommodation dis-tance) and simulated (i.e. vergence disdis-tance) distances was displayed to isolate the effect of screen distance on perceived depth. The screen and simulated distances were 1, 1.5 and 2.5 meters, yielding 9 possible configurations (see Fig. 1, left). Each condition was repeated 8 times, for a total of 72 tri-als per subject. The absolute sizes of the distance conflict between accommodation and vergence distances were 0.33, 0.27 and 0.6 diopters. These distances were chosen as a function of the dimensions of the VR system, to ensure that participants could not discriminate pixels, and to reflect system’s normal conditions of use.
4) TASK & STIMULUS
Participants were presented with a vertical dihedral angle depicted via a random-dot stereogram (see Fig. 1, right). At stimulus onset, this angle was either 60 or 120 degrees, and the participant had to adjust it to match a right angle (i.e. 90 degrees). For a given trial, one angle was randomly selected from a set of twelve, each having different random-dot patterns. This angle was always presented at eye level. The dots were white over a gray background. The plane width of the dihedron was 8.5 degrees. Dot density was 1.2 dots.degree−2 and dot angular size was 0.25 degrees.
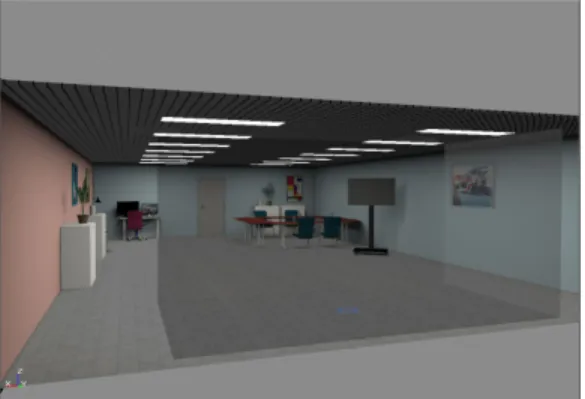
FIGURE 2. The visual scene used in this experiment. The transparent gray planes represent the three surfaces of the Holospace. The blue circle on the ground indicates the participant’s position.
This type of random-dot stereogram only provides binocular disparity information and limited texture cues. In the first condition, the virtual scene was a cue-poor environment, i.e. the stimulus was presented alone over a gray background. In the second condition, the stimulus was presented in a cue-rich environment, a large office with a table, chairs, and several objects (see Fig. 2). To obtain estimates of depth, the participant adjusted the vertical angle to 90 degrees. This task is similar to adjusting the depth-to-width ratio of the stimulus, as it requires the participant to compare the horizontal and depth dimensions in the stimulus. An indirect estimate of the egocentric distance of the stimulus can then be derived, i.e. the scaling (or equivalent) distance [24], [25]. Scaling distance can be computed as the distance at which the set pattern of disparity specifies a right angle.
5) PROCEDURE
All participants started the experiment by completing a writ-ten consent form. They received verbal instructions and were familiarized with the task in a short preliminary training phase. Participants were assigned to each of the distance conditions described above, in a random order. To vary participant-screen distance, the participant had to move to a circular mark displayed on the ground to begin the trial.
From each angle adjustment, we calculated the scaling distance, the distance at which the horizontal disparities in the stimulus specify a right angle. For a target straight ahead of the viewer, scaling distance SD is
SD = IOD(HSR + 1)
2(HSR − 1) tan(−π/4) (1) where IOD is the inter-ocular distance and HSR is the horizontal size ratio, a measure of relative horizontal disparity [26].
6) EXPECTATIONS
Depth constancy should be better when screen and sim-ulated distances match, but performance should signifi-cantly decrease with increasing conflict between these two distances. If screen distance dominates perceived depth,
the slopes should be smaller than one. Based on the liter-ature [12], a greater effect is expected when the simulated distance is farther than the screen distance.
B. RESULTS
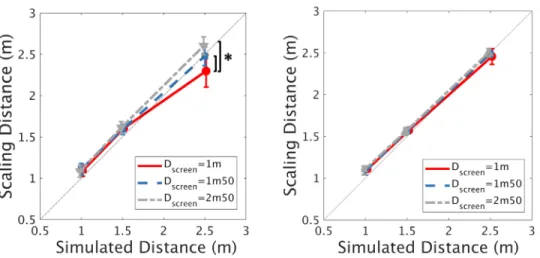
Fig. 3 represents scaling distances results as a function of simulated distances for the two groups of observers (those estimating depth in a cue-poor scene and those doing so in a cue-rich scene). From these results, a three-way ANOVA on scaling distances was performed: 2 (visual scene) × 3 (screen distances) × 3 (simulated distances). There was no main effect of visual scene (F(1, 22) = 0.011, p>0.05) but a significant interaction between the three factors (F(4, 88) = 5.279, p<0.0008, with sphericity corrected using Greenhouse-Geisser (GG) estimate: F(1.55, 34.14) = 5.279, p<0.02). Therefore, we conducted two separate (two-way) analyses at each level of the ‘visual scene’ factor to shed light on this interaction (nota: F ratios were adjusted using the error term (MSerror) computed from the original analysis.
The analysis performed for group 1 (empty scene, Fig. 3 Left) revealed an interaction effect between screen and simulated distances (F(4, 88) = 14.223, p<0.0001, with sphericity corrected using GG estimate: F(1.28, 28.07) = 14.223, p<0.0008). Simulated distance, as well as screen distance, significantly affected scaling distances (F(2, 44) = 488.109, p<0.0001, with sphericity corrected using GG esti-mate: F(1.18, 25.98) = 488.109, p<0.0001, F(2, 44) = 8.655, p<0.0007, with sphericity corrected using GG esti-mate: F(1.13, 24.81) = 8.655, p<0.008). Post-hoc analyses (with Bonferroni correction) revealed the averaged scaling for Dsim=2.5m distance was smaller for Dscreen=1m than
the ones for Dscreen = 1.5m (p<0.02) and Dscreen = 2.5m
(p<0.O001), suggesting a decreased depth constancy for the nearest accommodation distance (see Fig. 3, Left).
The analysis performed for group 2 (cue-rich scene, Fig. 3 Right) revealed no significant interaction effect between screen and simulated distances on scaling dis-tances (F(4, 88) = 2.49, p>0.05). Simulated distance sig-nificantly affected scaling distances (F(2, 44) = 605.486, p<0.0001, with sphericity corrected using GG estimate: F(1.13, 24.88) = 605.486, p<0.0001), but screen distance did not (F(2, 44) = 0.053, p>0.05). These results suggest that there was no effect of the screen distance on depth perception for group 2.
To investigate whether the presence of a cue-rich scene affected response consistency, a three-way ANOVA was per-formed on variable error. The analysis only revealed an effect of simulated distance (F(2, 44) = 139.63, p<0.0001 with corrected GG estimate: F(1.3, 29.7) = 139.63, p<0.0001); variable error increased with simulated distance. No other effects were observed (p<0.05).
C. DISCUSSION
In VR systems, previous studies reported misperception of size [8], [21]–[23], and distance [1], [2], [29]. Size was overestimated when the object was located in front of the
FIGURE 3. Simple interaction effects between simulated distance and screen distance (Dscreen) for depth
estimations made either in an empty scene (Left) or in a cue-rich environment (Right). Lines represent the three screen distances (red: 1 m, blue: 1.5 m, and gray: 2.5 m). Dotted line represents perfect constancy. Vertical error bars show 95% Cousineau-Morey confidence intervals for within-subjects designs [27], [28].
screen and underestimated when located behind it, whereas distance was mostly underestimated [3], [29]. In this exper-iment, a small but significant effect of screen distance was observed on depth estimations for the longest simulated dis-tance (i.e., interaction effect on Fig. 3 Left). This finding confirms those reported in another study using conventional stereoscopic displays [12] where depth is underestimated for objects displayed behind the screen. This finding has major implications for VR systems, showing that adding motion parallax to stereoscopic displays does not provide perfect depth constancy. Importantly, the group that performed the task in a cue-rich environment did not show the same trend (i.e., no interaction effect on Fig. 3 Right). On the contrary, participants revealed close-to-perfect depth constancy. It thus appears that presenting multiple cues through structured vir-tual environments leads to better depth constancy, as reported for size judgments [22]. Improvement in depth perception can be achieved via several different combinations of cues. Some cues are ambiguous when presented in isolation but more effective when combined with others. For example, motion-in-depth is more informative when binocular dis-parity provides the sign of the depth, thereby avoiding the depth reversal observed when motion-in-depth is presented in isolation [30]. Another interesting set of studies reveals that accuracy in the perception of an object’s distance and size can be improved by the mere addition of a more tant object [31]. The authors suggest that the relative dis-parity between two objects limits possible distances for the nearer object (i.e. the limiting-factor hypothesis). The rea-sons for improvement in depth constancy with increasing depth information are not clear. One important factor may be interindividual differences in cue combination. For example, Richards & Miller [32] observed that only about two thirds of 25 participants in their experiments could use convergence as a depth cue, suggesting that some people rely on other cues. Therefore, increasing the number of available distance
cues should maximize the probability of proper assessment of depth and distance, by meeting different individual needs in the cue-combination process. Cue-rich environments should thus enhance the user’s spatial perception in real environ-ments as well as in virtual ones. The improvement reported in the present study could be related to what emerges from Maximum Likelihood Estimate (MLE) standard models of cue-combination [33]. In such models, the perceptive system integrates multiple cues by assigning each cue a weight, these weights being inversely proportional to the variance in measurement for each cue in isolation. Conflicting cues like accommodation and vergence thus have less weight because of their high variance. In cue-poor environments, therefore, overall perceptive uncertainty is high. Conversely, cue-rich environments provide multiple pictorial cues that are unaf-fected by viewing conditions, giving them the potential to reduce this overall perceptual uncertainty. Reduced uncer-tainty is obviously beneficial, particularly in cue conflict con-ditions that tend to lower confidence in perceptual estimation. Not only does the presence of multiple cues lead to more precise spatial perception, therefore, but it also reduces the uncertainty in such perceptual processes [25].
D. THE A-V CONFLICT SIZE HYPOTHESIS
Based on the results from Experiment 1, together with those from previous studies [10], [12], we turned to the accommodation-vergence (A-V) conflict size hypothesis. Where accommodation and vergence distances do not match, depth estimates can be predicted by a simple cue-combination model. In the model, depth estimates depend on the distance information available and on the source of distance informa-tion, both simulated cues (i.e. disparity-vergence distance, and possibly environmental cues) and physical cues (i.e. screen distance). Thus, if the observer estimates depth based on the simulated and screen distances, the size of the conflict between the two distances should predict the bias and its
direction. Conflict size can be computed by subtracting the inverse of the accommodation distance from the inverse of the vergence one: C =| D1
V
− 1
DA
|, where C is the unsigned A-V conflict size, DV stands for vergence distance (i.e. simulated
distance) and DA stands for accommodation distance (i.e.
screen distance, in meter) [12]. A positive conflict arises when the simulated distance is less than the screen distance (i.e., the object appears in front of the screen), and a negative conflict when the simulated distance is greater than the screen distance (i.e., the object is behind the screen). According to this hypothesis, bias in depth perception should be propor-tional to A-V conflict size, but should also exhibit asym-metry between positive and negative conflicts, with greater bias for negative conflict, as observed elsewhere [12]. It is worth noting that not all depth cues are equally effective in mediating a depth percept, and their own potency can vary with observation distance [34]. The efficacy of all sources of information should also vary with viewing distance, both in stereoscopic VR systems and in natural environments. Because accommodation and vergence are effective distance signals at up to a dozen meters, potential influences from the A-V conflict should decrease at greater distances. Binocular disparities should still significantly contribute to perceived depth owing to the visual system’s ability to extract them over longer distances [35].
III. EXPERIMENT 2
In Experiment 1, an effect of screen distance on depth per-ception was revealed under a negative distance conflict (i.e., when simulated distance was greater than screen distance). The effect decreased when depth estimations were performed in a cue-rich structured environment. In Experiment 2, stimuli were displayed at two simulated distances with larger A-V conflicts. We investigated whether a structured visual scene still improves depth perception of a simulated object when there is a positive and greater distance conflict (i.e., when simulated distance is shorter than screen distance). We also evaluated the potential effect of uncontrolled factors that can arise in depth perception in CAVE-like VR systems and Head-Mounted Display (HMD) systems.
CAVE-like VR systems include multiple screens, unlike HMD. Because of their specific screen arrangement, they present uncontrolled display features. One effect of projec-tion display is luminance non-uniformity: the brightness of a single screen declines from the center of the image to the periphery [36], [37]. Significant changes in luminance distri-bution are observed depending on the luminance gradient, and depth perception might be affected accordingly. In the same way, changes in luminance distribution across side screens could increase the perception of borders between projection screens, providing another uncontrolled display factor.
Two comparisons were made to evaluate the potential effect of these uncontrolled display factors. Gaze angles were manipulated with respect to the display surface. First, depth perception was assessed for stimuli displayed on different areas of the screen surface both in a CAVE-like system and an
HMD (Comparison 1). Then, the potential incidence of spec-ular reflection was assessed by comparing depth perception in a CAVE-like VR system and an L-shaped system, the former having a back-projected ground screen and the latter having a directly-projected ground screen (Comparison 2). In each case, screen orientation was varied by keeping conflict size constant, which allowed these two effects to be separated. It was assumed that if no difference was found between the gaze angle conditions, this would suggest that conflict size had more influence on depth perception than a technological factor.
In this second part of the study, we focused on the repre-sentation of stereoscopic depth in different VR systems by assessing the magnitude and confidence of depth perception. First, we examined the magnitude of perceived depth, derived as the ratio between the subjective experience of depth over the intended displayed depth. Because VR systems use dif-ferent accommodation distances (accommodation distance is fixed in HMD VR displays but depends on observer displace-ment in CAVE-like systems), the magnitude of perceived depth can be expected to be consistent with the conflict size hypothesis. Second, we explored sensitivity to depth, i.e. the minimum change in depth that can be perceived. Again, conflict size should be a prominent factor affecting sensitivity to depth, meaning that confidence should decrease with increasing conflict size.
A. MATERIALS AND METHODS 1) PARTICIPANTS
Fourteen observers (11 men and three women) were recruited to take part in Comparison 1 and fourteen in Comparison 2 (12 men and two women). They were 33 years old on average (SD = 10 years; range: 21–51 years). All had normal or cor-rected vision and presented a stereoacuity threshold lower than 60 arcmin, as assessed by the TNO Test. All participants provided informed consent prior to the experiment.
2) VR SYSTEMS
In addition to the L-shaped system used in Experiment 1, Experiment 2 employed two other systems: a CAVE-like system and an HMD. The CAVE included five screen dis-plays (width = 4.5, length = 2.6&height = 2.4m). All surfaces were illuminated by back projection using Christie DLP 4k25 projectors (4K25, 25000 lumens). An ART sys-tem composed of 6 IR cameras allowed head tracking at 150 Hz frequency. Stereo-views were achieved through Vol-foni EDGE VR active glasses working at 120 Hz. The HMD was the HTC VIVE (resolution of 2160 × 1200, 1080 × 1200 per eye, with a refresh rate of 90 Hz and a field of view of about 110 degrees). As it had an optic system (i.e. fresnel lens) and a fixed screen distance, the method employed to find the virtual image distance used to compute the A-V distance conflict is described in the Appendix. Table 1 sums up the main differences between the three VR systems used in this study.
TABLE 1. Main technical differences between the three VR systems used in the study.
Luminance contrast (Weber’s ratios,Lmax−Lmin
Lmin ) of the
dis-play was measured on the front and ground surfaces of both virtual reality systems for the three display orientations using a five-point pattern measurement. The contrast of the displays ranged from 1.8 to 2.1 % in the Holospace, and from 2.4 to 2.6 % in the CAVE.
3) STIMULUS & TASK
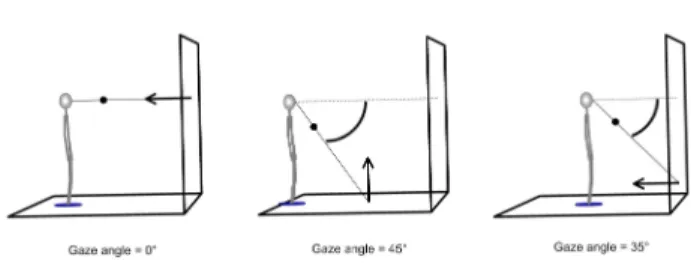
Participants had to judge the angle of the same stimulus as in Experiment 1. The task was to focus on a cross (2.3 degrees) placed in the center of the dihedron and then to judge whether the displayed dihedral angle was smaller or larger than 90 degrees. The dihedral angle presentation lasted only two seconds to prevent participants from relying on motion parallax. The stimulus could be displayed in such a way as to give the screen display three different orientations with respect to the visual axes (see Fig. 4). The angle created between the visual axes and the surface normal of the screen display was either 0, 35 or 45 degrees. As a result, screen distance slightly varied across viewing conditions depend-ing on participant’s eye height. Therefore, we kept the con-flict between accommodation (screen) distance and vergence (simulated) distance constant so that the stereoscopic demand was similar in all three conditions of screen orientation.
4) EXPERIMENTAL CONDITIONS
The experimental design included four independent vari-ables: display orientation (0, +35 or 45 degrees), virtual reality system (L-shaped system vs. HMD, L-shaped sys-tem vs. CAVE), virtual scene (empty environment vs. cue-rich environment) and observer-stimulus distance (0.5 m vs. 10 m). Because of incompatibility between factors ‘cue-rich environment’ and ‘10 m’ distance for orientations ‘35 degrees’ and ‘45 degrees’ (i.e., stimulus occurs below ground), we used a fractional factorial design where the factor ‘cue-rich environment’ was only tested in the L-shaped system and for the short observer-stimulus distance.
5) PROCEDURE
All participants started the experiment by completing a writ-ten consent form. They received verbal instructions and were familiarized with the task by starting with a short
FIGURE 4. This panel represents how the gaze angle was manipulated, by keeping conflict size constant. On the left, the stimulus was displayed at eye level so that the surface normal of the screen coincided with the visual axes, the angle between the two being 0 degree. In the middle, the stimulus was displayed in the middle of the ground surface, gaze angle being 45 degrees. On the right, the stimulus was displayed on the front surface but in the periphery of the screen, gaze angle being 35 degrees.
training phase. The participants were randomly assigned to one of three conditions of surface orientation that were run by block. In the experimental session, the dihedral angle was displayed according to an adaptive staircase procedure (Accelerated Stochastic Approximation, [38]). Observers participated in two threshold estimations (25% and 75%) using two staircases (one ascending and one descending) per threshold estimation for a total of 80 trials. Points of subjec-tive equality (PSE) and the just noticeable differences (JND) were derived from these estimations for each condition.
6) DATA ANALYSIS
To obtain an estimate of depth perception from a single mea-surement block, data from 80 trials were fitted with a cumu-lative Gaussian function with the parameters bias, α, and variance,β. To account for potential guesses and lapses [39], errors independent of stimulus features, we introduced the free parametersγ and λ in the model:
φ(x; α, β, γ, λ) = γ + (1 − γ − λ)F(x; α, β) (2) The parameters of this function were estimated using a maximum log likelihood criterion. PSEs were computed by taking the inverse of the cumulative Gaussian function at 50% ‘‘more than 90 degrees’’. JNDs (index of uncertainty in the task) were computed by taking the difference between the point at the 0.75 probability level and the point at the 0.25 probability level and dividing this value by two. Larger JNDs indicate larger uncertainty in the task.
PSEs and JNDs were then converted into depth ratios, i.e. the ratios of estimated over physical peak-to-trough (maxi-mum depth between the apex and the edge of a given angle) so that perceived depth and sensitivity to depth could be analyzed.
B. RESULTS
In comparison 1, we compared the L-shape and HMD sys-tems by performing three-way ANOVAs on depth ratios and sensitivity: 2 (VR system) × 2 (stimulus distances [scene]) ×3 (display orientations). In comparison 2, we compared the L-shape and CAVE systems by performing three-way
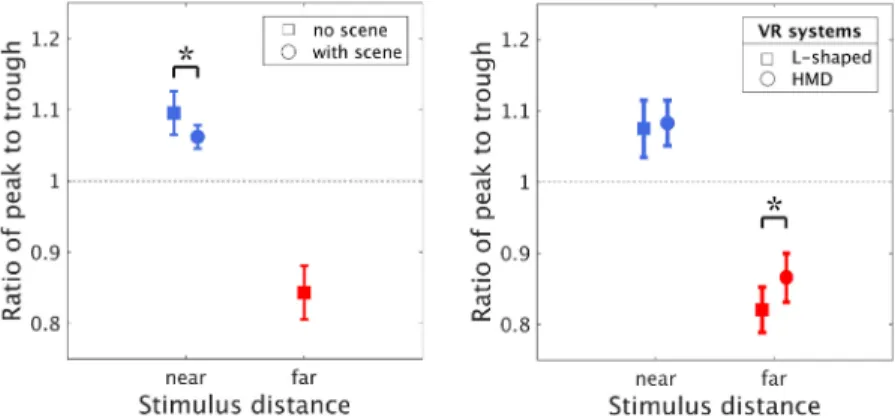
FIGURE 5. Left: examples of psychometric functions fitted to the probability of giving a ‘‘greater than 90◦’’ response for the short- and
long-distance stimuli (blue and red respectively). The dotted lines help locate the points of subjective equality on the abscissa. Middle: effect of stimulus distance on peak-to-trough ratios for the short and long stimulus distances. Right: effect of stimulus distance on the JND of peak-to-trough ratios for the short and long stimulus distances. Error bars denote Cousineau-Morey Confidence Intervals for
within-subject design [27], [28]. Significant differences are indicated by *** for p<0.0001.
FIGURE 6. Left: effect of presenting a cue-rich virtual scene on depth estimations (i.e. peak-to-trough ratios) for short distances (in blue); the scene was not tested with long-distance stimuli (in red). Right: interaction effect on depth ratios between factors stimulus distance (blue for short-distance and red for long-distance stimuli) and VR systems (squares represent estimations performed in L-shaped VR system and circles represent estimations performed with HMD). Dotted line shows perfect depth constancy. Error bars denote Cousineau-Morey Confidence Intervals for within-subject design [27], [28]. Significant differences are indicated by * for p<0.05.
ANOVAs on depth ratios and sensitivity: 2 (VR system) × 2 (stimulus distances) × 3 (display orientations).
1) COMPARISON 1: L-SHAPED VS. HMD VR SYSTEMS
Fig. 5 and 6 summarize the results of Experiment 2 on depth ratios and JNDs of depth ratios. They were analyzed using a repeated measure analysis with distance, orientation, and VR system as factors and the factor scene was nested into distance.
The analysis revealed a significant effect of simulated dis-tance (F(1, 13) = 107.644, p<0.0001). As seen from Fig. 5 (Left & Middle), the depth of the short-distance stimulus was overestimated (mean = 1.08, SD = 0.0093), whereas the depth of the long-distance stimulus was underestimated (mean = 0.843, SD = 0.0071). A slight but significant inter-action was observed between factors VR system and stim-ulus distance (F(1, 13) = 4.873, p<0.05); post-hoc analysis
revealed that there was less underestimation of depth with the HMD than with the L-shaped system for long-distance stim-uli (p<0.02, see Fig. 6, right). An effect of the visual scene was also observed (F(1, 13) = 10.611, p<0.002); depth ratios were slightly less overestimated (by about 4%) when depth was estimated in a cue-rich scene than in an empty one (see Fig. 6, left). Lastly, a small interaction between factors VR system, stimulus distance and display orientation was obtained (F(1, 26) = 5.182, p<0.02). However, post-hoc analysis failed to reveal how depth estimations varied according to display orientation interacting with the two other factors (p<0.05).
This analysis was also performed on the JNDs of depth ratios and only revealed an effect of stimulus distance (F(1, 13) = 76.182, p<0.0001): sensitivity to depth was greatly reduced for the long-distance stimulus compared to the short-distance stimulus (see Fig. 5, right).
2) COMPARISON 2: L-SHAPED VS. CAVE SYSTEMS
The CAVE system and the L-shaped system were compared to assess the relative impacts of screen resolution and of specular reflection on depth perception. The effect of specular reflection could be evaluated because the CAVE system uses a back-projected ground screen whereas the L-shaped system includes a front-projected ground screen. If screen resolution impacts depth perception, then the ratio of peak-to-trough should significantly differ between systems. If light reflection is a potent factor, then an interaction effect should be observed between variables gaze angle and VR system.
A three-way ANOVA was performed on depth ratios and only revealed a significant effect of simulated distance (F(1, 13) = 82.102, p<0.0001). As in Comparison 1, the depth of the near stimulus was overestimated, whereas the one of the far stimulus was underestimated. There were no other effects, and importantly, no VR system effect on perceived depth (p>0.05). Moreover, a three-way ANOVA performed on JNDs of depth ratios only revealed an effect of simulated distance (F(1, 13) = 18.838, p<0.0009). As in Comparison 1, the sensitivity to depth was largely reduced for the far stimulus as compared to the near one. No other effects were observed (p>0.05). Further analysis revealed that depth estimations (ratios) and sensitivity to depth (JNDs) in both the L-shaped and the CAVE systems were strongly correlated (R = 0.89, p<0.0001 and R = 0.58, p<0.0001 respectively).
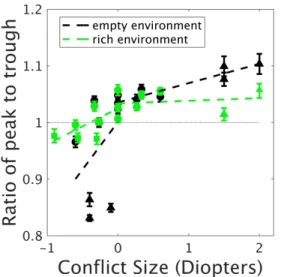
FIGURE 7. Peak-to-trough ratio as a function of A-V conflict size and displayed environment (rich: green, empty: dark) in experiments 1 and 2. Dotted line shows linear regressions. Error bars denote confidence intervals.
3) CROSS-ANALYZED RESULTS: EFFECT OF CONFLICT SIZE AND SIMULATED DISTANCE
In this section, the results obtained in the two reported experi-ments are cross-analyzed. Fig. 7 represents depth estimations performed in Experiments 1 and 2 with a gaze angle of zero for the empty and rich environments as a function of A-V conflict size. Correlations were obtained between conflict size and depth ratio (for the empty environment: R = 0.53,
TABLE 2.Summary of trends observed in experiments 1 and 2. Effect of A-V conflict, type of displays and environment richness on size ratio. Positive conflict means that the simulated distance is in front of the screen distance, and negative conflict means that the simulated distance is behind the screen distance. % means overestimation, & means underestimation, and → means unchanged estimation. - denotes conditions not tested.
p<0.0001, for the rich environment: R = 0.27, p<0.0005) and between simulated distance and depth ratio (for the empty environment: R = 0.53, p<0.0001, for the rich environ-ment: R = 0.37, p<0.0001). We thus performed multiple regressions on depth ratios with variables conflict size and simulated distance for depth estimations performed in the empty and rich environments. For the empty environment, the multiple regression model was significant (F(2, 184) = 95.67, p<0.0001) and the R2 was equal to 0.51.
Predic-tors conflict size and simulated distance were found to sig-nificantly affect depth ratios (p<0.0001, standardized betas were 0.48 and -0.48 respectively). For the rich environment, the model was significant (F(2, 159) = 12.94, p<0.0001) but the R2 decreased to 0.14. Conflict size did not significantly affect depth ratio (p>0.05) whereas simulated distance still did (p<0.0001, standardized beta was -0.32). These results can be summarized as follows: conflict size and simulated distance contributed to the bias in perceived depth (with similar explained variance) when the visual scene was empty, whereas only simulated distance contributed to the bias when the visual scene was rich in depth cues.
The following table sums up trends of differences in depth perception observed between the three VR systems in exper-iments 1 and 2.
C. DISCUSSION
There are a few studies comparing distance perception between different VR displays (e.g. [5], [40]–[43]). Over-all, when screen distance and/or optical system are known, these studies revealed that distance was underestimated when objects were displayed behind the screen [41] and overes-timated when they were displayed in front of it [43]. For example, Grechkin et al. [41] compared distance perception in the range between 6 to 18 m in an HMD (focal distance of 10 m) and a large immersive display (screen distance of about 2.5 m). They observed underestimations of distance in both systems. Lin et al. [43] reported overestimations of
distance for objects displayed in an HMD and in a large immersive displays. Presumably, the simulated object dis-tances were always in front of the screen.
Experiment 2 also revealed that, overall, perceived depth was overestimated for a positive A-V conflict and under-estimated for a negative one. It also showed that sensitiv-ity to depth was somewhat poorer for long than for short object distance. These results are consistent with the conflict size hypothesis regarding bias direction and the asymmetry between positive and negative conflicts. In this experiment, depth perception was also slightly more accurate when the object was presented in a rich environment at a short distance, thus replicating the results observed for the long-distance object in Experiment 1.
One objective of this experiment was to compare depth perception in a CAVE-like system (i.e., the L-shaped system) with that in an HMD system, because of the technical differ-ences between these two systems. For instance, since it is the optical interface in HMD that determines A-V conflict size, this could be a potent factor. While both systems showed sim-ilar depth perception for the short object distance, the HMD system led to slightly more accurate depth perception at the longer distance than the L-shaped system. This latter result could be explained by the conflict size factor: conflict size in this condition was only 0.1 D for the HMD vs. 0.4 D for the L-shaped system. However, this result differs from the one observed by Lin et al. [43]. In their study, they observed that a large immersive display provides better accuracy in perceived distance than an HMD similar to the one used in this study. We should note, however, that their large immer-sive display is very different from the L-shaped system used in this study, and that the distance conditions were not the same.
Experiment 2 failed to reveal any significant effect of display orientation. Results from Comparison 1 suggest that, when conflict size is maintained constant, changing display orientation respective to gaze angle does not make much difference to depth perception. Thus, uncontrolled factors related to luminance non-uniformity in projection display are unlikely to be predominant in perceptual bias in these VR systems. Comparison 2 showed the accuracy of depth perception to be equivalent, without significant differences between the two CAVE-like systems. The fact that there was no impact from display orientation suggests that factors related to resolution and projection are of minor importance compared to screen distance and the resulting conflict size in the VR systems we used.
Only Comparison 1 showed significant differences between the HMD and L-shaped systems. We therefore carried out a supplementary analysis to explore the relation-ships between depth perception and conflict size, including all data reported for the three VR systems in Experiments 1 and 2. This additional analysis revealed that conflict size and simulated distance strongly contributed to depth per-ception in the empty environment and that the variance of depth ratios was explained by both factors equally. When
estimations were performed in the rich environment, only simulated distance still contributed and less variance was explained by this factor. These results thus strongly sug-gest that the effect of the A-V conflict can potentially be overcome by presenting environments with multiple depth cues.
IV. CONCLUSION
We reported here on two experiments dealing with depth perception in three different VR systems. The results show that display factors (luminance, resolution, and display ori-entation) have little or no effect on depth perception. How-ever, in both experiments the A-V conflict and the simulated distance affected perceived depth when the visual environ-ment in the VR systems was empty. Conflict size affected perceptual bias and sensitivity to depth. When a rich envi-ronment was displayed, the effect of the A-V conflict was no longer significant, suggesting a decreased contribution of this latter. A recent study revealed that depth perception and accommodation responses were concomitantly affected when exposed to A-V conflict in conventional stereoscopic displays [12]. This decreased importance of A-V conflict in explaining the bias in depth perception when multiple depth cues are displayed may stem from the predominance of monocular depth cues, unaltered by viewing conditions, over conflicting oculomotor ones. These results have implications for the use of VR systems where the A-V conflict size is substantial.
Finally, it is worth noting that to some extent, the outcomes of these findings can be extended to other immersive systems, such as mixed- and augmented-reality displays. The impor-tance of screen disimpor-tance and optical interface in these systems must be considered both when the entire scene is presented on screens and when it mixes real world with objects displayed on screen (e.g. in see-through systems). When presenting information on different interfaces, different accommoda-tion distance could result in conflicting informaaccommoda-tion from focus [4] and could affect performance in depth perception accordingly.
APPENDIX
An HTC VIVE headset was disassembled to extract the Fresnel lens. The focal length of the lens was measured on its center using a frontofocometer (Shin-Nippon LM-25), and estimated at 26.5 Diopters. Next, the distance between the optical center of the lens and the display, following the center of the lens, was estimated using a laser measuring arm (FARO). The distance between the screen and the optical center of the lens was computed as the distance between two planes fitted on the measured data points obtained using the software GeoMatrix 9.0, minimizing measurement noise by averaging the measured data points. From these two mea-sures, the image distance of the screen was obtained using the thin lens equation. The focal distance of the headset displays was estimated as infinite, meaning that rays of light passing through the lens were cast on the focal point of the lens.
ACKNOWLEDGMENT
The authors would like to thank Marjorie Sweetko for english language proofreading and editing of the manuscript. The authors also thank Pascaline Neveu for her help in the use of the frontofocometer and Charles-Antoine Salasc for his assistance to use the FARO arm. This study was part of the OpenLab agreement ‘‘Automotive Motion Lab’’ between Groupe PSA and Aix-Marseille University and CNRS.
REFERENCES
[1] S. H. Creem-Regehr, P. Willemsen, A. A. Gooch, and W. B. Thompson, ‘‘The influence of restricted viewing conditions on egocentric distance perception: Implications for real and virtual indoor environments,’’ Per-ception, vol. 34, no. 2, pp. 191–204, Feb. 2005.
[2] P. Willemsen, A. A. Gooch, W. B. Thompson, and S. H. Creem-Regehr, ‘‘Effects of stereo viewing conditions on distance perception in virtual environments,’’ Presence, Teleoperators Virtual Environ., vol. 17, no. 1, pp. 91–101, Feb. 2008.
[3] R. S. Renner, B. M. Velichkovsky, and J. R. Helmert, ‘‘The perception of egocentric distances in virtual environments-a review,’’ ACM Comput. Surv., vol. 46, no. 2, p. 23, 2013.
[4] D. Drascic and P. Milgram, ‘‘Perceptual issues in augmented reality,’’ Proc. SPIE, vol. 2653, pp. 123–135, Apr. 1996.
[5] A. Naceri, R. Chellali, F. Dionnet, and S. Toma, ‘‘Depth perception within virtual environments: Comparison between two display technologies,’’ Int. J. Adv. Intell. Syst., vol. 3, nos. 1–2, pp. 51–64, 2010.
[6] R. T. Surdick, E. T. Davis, R. A. King, and L. F. Hodges, ‘‘The perception of distance in simulated visual displays: A comparison of the effectiveness and accuracy of multiple depth cues across viewing distances,’’ Presence, Teleoperators Virtual Environ., vol. 6, no. 5, pp. 513–531, 1997. [7] V. Interrante, B. Ries, J. Lindquist, M. Kaeding, and L. Anderson,
‘‘Eluci-dating factors that can facilitate veridical spatial perception in immersive virtual environments,’’ Presence, Teleoperators Virtual Environ., vol. 17, no. 2, pp. 176–198, Apr. 2008.
[8] B. H. Woldegiorgis, C. J. Lin, and W.-Z. Liang, ‘‘Impact of parallax and interpupillary distance on size judgment performances of virtual objects in stereoscopic displays,’’ Ergonomics, vol. 62, no. 1, pp. 76–87, Jan. 2019. [9] J. P. Wann, S. Rushton, and M. Mon-Williams, ‘‘Natural problems for
stereoscopic depth perception in virtual environments,’’ Vis. Res., vol. 35, no. 19, pp. 2731–2736, Oct. 1995.
[10] S. J. Watt, K. Akeley, M. O. Ernst, and M. S. Banks, ‘‘Focus cues affect perceived depth,’’ J. Vis., vol. 5, no. 10, p. 7, Dec. 2005.
[11] D. M. Hoffman, A. R. Girshick, K. Akeley, and M. S. Banks, ‘‘Vergence– accommodation conflicts hinder visual performance and cause visual fatigue,’’ J. Vis., vol. 8, no. 3, p. 33, Mar. 2008.
[12] C. Vienne, J. Plantier, P. Neveu, and A.-E. Priot, ‘‘(Disparity-driven) Accommodation response contributes to perceived depth,’’ Frontiers Neu-rosci., vol. 12, p. 973, Dec. 2018.
[13] B. Rogers and M. Graham, ‘‘Motion parallax as an independent cue for depth perception,’’ Perception, vol. 8, no. 2, pp. 125–134, Apr. 1979. [14] F. Panerai, V. Cornilleau-PÉrÈs, and J. Droulez, ‘‘Contribution of
extrareti-nal sigextrareti-nals to the scaling of object distance during self-motion,’’ Perception Psychophys., vol. 64, no. 5, pp. 717–731, Jul. 2002.
[15] M. S. Landy, L. T. Maloney, E. B. Johnston, and M. Young, ‘‘Measurement and modeling of depth cue combination: In defense of weak fusion,’’ Vis. Res., vol. 35, no. 3, pp. 389–412, Feb. 1995.
[16] T. Kunnapas, ‘‘Distance perception as a function of available visual cues,’’ J. Exp. Psychol., vol. 77, no. 4, p. 523, 1968.
[17] J. W. Philbeck and J. M. Loomis, ‘‘Comparison of two indicators of perceived egocentric distance under full-cue and reduced-cue conditions,’’ J. Exp. Psychol., Hum. Perception Perform., vol. 23, no. 1, pp. 72–85, Sep. 2005.
[18] A. H. Holway and E. G. Boring, ‘‘Determinants of apparent visual size with distance variant,’’ Amer. J. Psychol., vol. 54, no. 1, pp. 21–37, Jan. 1941. [19] J. R. Tresilian, M. Mon-Williams, and B. M. Kelly, ‘‘Increasing confidence
in vergence as a cue to distance,’’ Proc. Roy. Soc. London B, Biol. Sci., vol. 266, no. 1414, pp. 39–44, Jan. 1999.
[20] L. Bringoux, C. Bourdin, J.-C. Lepecq, P. M. B. Sandor, J.-M. Pergandi, and D. Mestre, ‘‘Interaction between reference frames during subjective vertical estimates in a tilted immersive virtual environment,’’ Perception, vol. 38, no. 7, pp. 1053–1071, Jul. 2009.
[21] R. G. Eggleston, W. P. Janson, and K. A. Aldrich, ‘‘Virtual real-ity system effects on size-distance judgements in a virtual environ-ment,’’ in Proc. IEEE Virtual Reality Annu. Int. Symp., Mar. 1996, pp. 139–146.
[22] R. V. Kenyon, D. Sandin, R. C. Smith, R. Pawlicki, and T. Defanti, ‘‘Size-constancy in the CAVE,’’ Presence, Teleoperators Virtual Environ., vol. 16, no. 2, pp. 172–187, Apr. 2007.
[23] A. Murgia and P. M. Sharkey, ‘‘Estimation of distances in virtual environ-ments using size constancy,’’ Int. J. Virtual Reality, vol. 8, no. 1, pp. 67–74, Oct. 2019.
[24] A. Glennerster, B. Rogers, and M. Bradshaw, ‘‘Stereoscopic depth constancy depends on the subject’s task,’’ Vis. Res., vol. 36, no. 21, pp. 3441–3456, Nov. 1996.
[25] C. Vienne, J. Plantier, P. Neveu, and A.-E. Priot, ‘‘The role of verti-cal disparity in distance and depth perception as revealed by different stereo-camera configurations,’’ i-Perception, vol. 7, no. 6, Dec. 2016, Art. no. 204166951668130.
[26] I. P. Howard, Seeing in Depth: Basic Mechanisms, vol. 1. Toronto, ON, Canada: Univ. of Toronto Press, 2002.
[27] D. Cousineau, ‘‘The rise of quantitative methods in psychology,’’ Tuts. Quant. Methods Psychol., vol. 1, no. 1, pp. 1–3, Sep. 2016.
[28] R. D. Morey, ‘‘Confidence intervals from normalized data: A correction to Cousineau (2005),’’ Tuts. Quant. Methods Psychol., vol. 4, no. 2, pp. 61–64, Sep. 2016.
[29] G. Bruder, F. Argelaguet, A.-H. Olivier, and A. Lécuyer, ‘‘CAVE size matters: Effects of screen distance and parallax on distance estimation in large immersive display setups,’’ Presence, Teleoperators Virtual Environ., vol. 25, no. 1, pp. 1–16, Jul. 2016.
[30] W. Richards, ‘‘Structure from stereo and motion,’’ J. Opt. Soc. Amer. A, Opt. Image Sci., vol. 2, no. 2, pp. 343–349, 1985.
[31] R. Sousa, E. Brenner, and J. Smeets, ‘‘A new binocular cue for absolute distance: Disparity relative to the most distant structure,’’ Vis. Res., vol. 50, no. 18, pp. 1786–1792, Aug. 2010.
[32] W. Richards and J. Miller, ‘‘Increasing confidence in vergence as a cue to distance,’’ Perception Psychophys., vol. 5, no. 5, pp. 317–320, 1969.
[33] M. O. Ernst and M. S. Banks, ‘‘Humans integrate visual and haptic information in a statistically optimal fashion,’’ Nature, vol. 415, no. 6870, pp. 429–433, Jan. 2002.
[34] J. E. Cutting and P. M. Vishton, ‘‘Perceiving layout and knowing distances: The integration, relative potency, and contextual use of different informa-tion about depth,’’ in Percepinforma-tion of Space and Moinforma-tion. New York, NY, USA: Academic, 1995, pp. 69–117.
[35] S. Palmisano, B. Gillam, D. G. Govan, R. S. Allison, and J. M. Harris, ‘‘Stereoscopic perception of real depths at large distances,’’ J. Vis., vol. 10, no. 6, p. 19, Jun. 2010.
[36] A. Majumder, Z. He, H. Towles, and G. Welch, ‘‘Achieving color uni-formity across multi-projector displays,’’ in Proc. Visualization, 2000, pp. 117–124.
[37] A. Mazikowski, ‘‘Analysis of luminance distribution uniformity in CAVE-type virtual reality systems,’’ Opto-Electron. Rev., vol. 26, no. 2, pp. 116–121, May 2018.
[38] H. Kesten, ‘‘Accelerated stochastic approximation,’’ Ann. Math. Statist., vol. 29, no. 1, pp. 41–59, Mar. 1958.
[39] F. A. Wichmann and N. J. Hill, ‘‘The psychometric function: I. Fitting, sampling, and goodness of fit,’’ Perception Psychophys., vol. 63, no. 8, pp. 1293–1313, Nov. 2001.
[40] E. Klein, J. E. Swan, G. S. Schmidt, M. A. Livingston, and O. G. Staadt, ‘‘Measurement protocols for medium-field distance percep-tion in large-screen immersive displays,’’ in Proc. IEEE Virtual Reality Conf., Mar. 2009, pp. 107–113.
[41] T. Y. Grechkin, T. D. Nguyen, J. M. Plumert, J. F. Cremer, and J. K. Kearney, ‘‘How does presentation method and measurement protocol affect distance estimation in real and virtual environments?’’ ACM Trans. Appl. Percept., vol. 7, no. 4, pp. 1–18, Jul. 2010.
[42] J. W. Kelly, L. A. Cherep, and Z. D. Siegel, ‘‘Perceived space in the HTC vive,’’ ACM Trans. Appl. Percept., vol. 15, no. 1, pp. 1–16, Jul. 2017.
[43] C. J. Lin, B. T. Abreham, and B. H. Woldegiorgis, ‘‘Effects of displays on a direct reaching task: A comparative study of head mounted display and stereoscopic widescreen display,’’ Int. J. Ind. Ergonom., vol. 72, pp. 372–379, Jul. 2019.
CYRIL VIENNE received the master’s degree in cognitive psychology from Lille University, France, in 2009, and the Ph.D. degree in psy-chology from Paris Descartes University, France, in 2013. In 2014, he was a Teaching Assistant in cognitive sciences at Bordeaux University, France. He was a Postdoctoral Fellow at IRBA, until 2016. He was a Visiting Scientist during two years in the Openlab between Groupe PSA, Vél-izy, France, and Aix-Marseille University. He is currently a Research Scientist with the French Armed Forces Biomedical Research Institute (IRBA), France. His current research interests include multisensory perception, human behavior and performances, in new tech-nologies and in environmental conditions with strong sensory constraints (e.g., virtual reality and night perception).
STÉPHANE MASFRAND was born in 1968. He received the master’s degree in mechanical engineering from the University of Valenciennes, France, in 1992. He worked 5 years as consultant in numerical simulation (crashsworthiness, noise, and vibration). He joined Groupe PSA, in 1999, and managed different teams, mainly in the field of simulation. Since 2009, he has been the Head of the Driving Simulation and Virtual Reality Depart-ment. He is implied in several research projects as industrial supervisor for research. He has been a member of the Driving Simulation Conference Scientific Committee, since 2012.
CHRISTOPHE BOURDIN received the Ph.D. degree in movement sciences from University Joseph Fourier, Grenoble, in 1997, under the supervision of Prof. Vincent Nougier. He joined the Faculté des Sciences du Sport and the Institut of Movement Sciences, Aix-Marseille University and CNRS, in 1998, to work on the detailed ways and means of movement control by the central ner-vous system. Since 1998, he has been conducting research projects on the issue of movement learn-ing and its adaptation to environmental changes, with a major interest in the role of multisensory integration. He works particularly on the contributions of auditory, vestibular, and visual information to the capacities of control of movement. He is currently a Scientific Officer of the Automotive Motion Lab, a joint research center between Aix-Marseille University and the PSA Company (French Car Manufacturer) that deals with issues involving human factors in the automotive field. From 2001 to 2005 and from 2010 to 2014, he was the Vice Dean of the Faculty of Sport Sciences. He is currently a Research Officer with Aix-Marseille University, working with the Vice President for Innovation and Economic Development.
JEAN-LOUIS VERCHER received the Ph.D. degree in neuroscience from Aix-Marseille Uni-versity, France, in 1984. He was a Visiting Sci-entist (postdoc) at the Department of Physiology, Oxford University, U.K., before joining the CNRS, in 1988 as Research Assistant, and since 2000, he has been the Research Director. His work relates to the study of sensorimotor systems control (hand, head, and eyes movements), perception, coordi-nation, and plasticity, in particular in ergonomic situations. He was the Former Director of the Institute for Movement Sci-ence, Marseille, France. He is Founding Member of the Executive Board of AFRV (the French Association for Virtual Reality), member of the Société des Neurosciences, FENS, and the Neural Control of Movement Society. He published more than 120 articles in peer-reviewed journals and contributed to about 300 conference papers. His current research relates to the processes of multisensorial integration in orientation, navigation and visuo-guided behaviors.