HAL Id: hal-02397944
https://hal.archives-ouvertes.fr/hal-02397944
Preprint submitted on 6 Dec 2019HAL is a multi-disciplinary open access archive for the deposit and dissemination of sci-entific research documents, whether they are pub-lished or not. The documents may come from teaching and research institutions in France or abroad, or from public or private research centers.
L’archive ouverte pluridisciplinaire HAL, est destinée au dépôt et à la diffusion de documents scientifiques de niveau recherche, publiés ou non, émanant des établissements d’enseignement et de recherche français ou étrangers, des laboratoires publics ou privés.
Distributed under a Creative Commons Attribution| 4.0 International License
Manuel Vidal, Andrea Desantis, Laurent Madelain
To cite this version:
Manuel Vidal, Andrea Desantis, Laurent Madelain. Irrelevant auditory and tactile signals interact with the visual target onset and modulate saccade latencies, not visual signals. 2019. �hal-02397944�
1
Irrelevant auditory and tactile signals interact with the visual target onset and
1modulate saccade latencies, not visual signals
23
Manuel Vidal1,2,*, Andrea Desantis3,4 and Laurent Madelain1,5
4
1Institut de Neurosciences de la Timone, UMR 7289, CNRS, Aix-Marseille Université, France
5
2Laboratoire de Psychologie Cognitive, UMR 7290, CNRS, Aix-Marseille Université, France
6
3Département Traitement de l’Information et Systèmes, ONERA, Salon-de-Provence, France
7
4Integrative Neuroscience and Cognition Center, UMR 8002, CNRS, Université Paris Descartes, France
8
5Sciences Cognitives et Sciences Affectives, UMR 9193, CNRS, Université de Lille, France.
9
10
Abstract. Saccadic eye movements bring events of interest to the center of the retina, enabling
11
detailed visual analysis. This study explored whether irrelevant auditory (experiments A, B & F), visual 12
(C & D) or tactile signals (E & F) delivered around the onset of a visual target modulates saccade 13
latency. Participants were instructed to execute a quick saccade toward a target stepping left or right 14
from a fixation position. We observed an interaction between auditory beeps or tactile vibrations 15
and the oculomotor reaction that included two components: a warning effect resulting in faster 16
saccades when the signal and the target were presented simultaneously; and a modulation effect 17
with shorter – or longer – latencies when auditory and tactile signals were delivered before – or after 18
– the target onset. Combining both modalities only increased the modulation effect to a limited 19
extent, pointing to a saturation of the multisensory interaction with the motor control. Interestingly, 20
irrelevant visual stimuli (black background or isoluminant noise stripes in peripheral vision, flashed 21
for 10 ms) increased saccade latency whether they were presented just before or after target onset. 22
The lack of latency reduction with visual signals suggests that the modulation observed in the 23
auditory and tactile experiments was not related to priming effects but rather to low-level audio- and 24
tactile-visual integration. The increase in saccade latency observed with irrelevant visual stimuli is 25
discussed in relation to saccadic inhibition. Our results demonstrate that signals conveying no 26
information regarding where and when a visual target would appear modulate saccadic reactivity, 27
much like in multisensory temporal binding, but only when these signals come from a different 28
modality. 29
Keywords: auditory, visual, tactile, multisensory, temporal binding, saccades, eye-movements 30
2
Introduction
1
Our environment continuously provides information through physical signals that are 2
transduced and processed by various sensory systems. Although the study of human perception has 3
long focused on isolated senses, in the last decades the interaction between different sensory 4
systems has started to gain interest. Many scientists now believe that the nature of purely visual 5
contexts studied in the laboratory is quite different from the multisensory scenarios found in more 6
ecological settings; and that vision per se is often influenced at early stages by other modalities such 7
as audition. 8
Let us consider a daily life illustration: as we wander in a fun fair the sudden explosion of a 9
balloon on the right side of our visual field will automatically attract our gaze. This orientation 10
behavior facilitates further sensory processing needed for a fast reaction to a potential danger. The 11
resulting brief acoustic signal and salient visual change generated by the explosion are transmitted in 12
the air and then transduced by our auditory and visual systems at different speeds. Although these 13
signals reach the brain areas responsible for their integration at different moments (Keetels & 14
Vroomen, 2012; Pöppel, Schill, & von Steinbüchel, 1990), we will most likely perceive them as 15
simultaneous. Moreover, depending on the distance to the blowing balloon, the auditory signal 16
might reach the observer either before or after the visual signal. The mechanisms involved in the 17
subjective timing of natural events must then show some degree of flexibility to connect each 18
unimodal component and combine them into a single multisensory event. Furthermore, the 19
observed advantage of the visual modality over other senses for spatial processing does not hold for 20
the temporal domain: the auditory system is more sensitive and reliable than the visual system to 21
process the timing of events (Vidal, 2017). When presenting a flash just before or after a short beep, 22
the visual stimulus is perceived closer in time to the auditory stimulus than it actually is (Slutsky & 23
Recanzone, 2001). Consistently, the perception of a flash shifts either forward or backward in time 24
when paired with a lagging or leading sound click, respectively (Fendrich & Corballis, 2001). This 25
phenomenon – termed temporal ventriloquism – has been used to produce famous illusions (Shams, 26
Kamitani, & Shimojo, 2000; Freeman & Driver, 2008), to modulate low-level features of the visual 27
system (Scheier, Nijhawan, & Shimojo, 1999; Morein-Zamir, Soto-Faraco, & Kingstone, 2003; 28
Vroomen & de Gelder, 2004) or to modulate visually-guided motor control (Maij, Brenner, & Smeets, 29
2009). 30
Going back to our initial example, the literature tells us that the blowing sound affects the 31
moment when we visually perceive the visual counterpart of the balloon explosion, the latter being 32
shifted in time toward the auditory signal. Consequently, one might wonder whether this could 33
3
influence the triggering of the saccade bringing the retinal image of the visual event on the fovea. For 1
instance, if the balloon is far enough, the blowing sound will hit our senses and be processed after 2
the visual signal and delay the moment we perceive the explosion. Would this also delay the 3
execution of eye movements toward the location of the explosion as well? In other words, does 4
multisensory temporal binding influence the latency of actions we execute in response to 5
multisensory events? This is the question addressed in the present set of experiments. 6
To investigate the influence of multisensory temporal binding on motor reaction times to 7
multimodal events, we will use saccadic eye movements, as they proved to allow the measurement 8
of small differences in processing time (Carpenter, 1988). In addition, our decision of using saccades 9
to investigate multisensory binding, lies in the fact these eye movements are partly controlled by the 10
superior colliculus (SC), a well-known brain structure also involved in multisensory processing. In 11
mammals the SC in which sensory and motor maps are connected, transforms sensory inputs into 12
motor commands (D. L. Sparks, 1988; David L. Sparks & Nelson, 1987; Wurtz & Goldberg, 1972). The 13
mechanism underlying gaze fixation has been proposed to involve fixation cells in the rostral SC, 14
which inhibit the generation of saccades through the excitation of omnipause neurons in the 15
brainstem (Munoz & Wurtz, 1993). Importantly, SC was also the first structure where audiovisual 16
integration in time and space was observed (Meredith, Nemitz, & Stein, 1987; Stein, Meredith, & 17
Wallace, 1993; Wallace, Meredith, & Stein, 1993): neurons in the superficial SC layers respond to 18
visual stimuli and neurons in the intermediate and deep SC layers also respond to auditory stimuli, 19
such that auditory and visual sensory maps are connected at a very early processing stage. 20
Audiovisual interactions in monkey SC modulate saccade-related activity, though less than what 21
expected from earlier recordings (Maarten A Frens & Van Opstal, 1998). This physiological 22
organization has functional consequences that might be quantified in behavioral studies. 23
Only a handful of studies have investigated the influence of signals from non-visual sensory 24
modalities on the execution of saccades. Ross & Ross (1981) used continuous warning signals – onset 25
or offset of either sounds or visual symbols at fixation – around the time of target onset. Saccade 26
latencies were shorter for auditory signals presented 300 ms, 100 ms or 0 ms before target onset, 27
indistinctly for sound onset or offset, when compared to latencies in conditions without warning 28
signals. However, the nature of these effects proved to be different from what was observed with 29
visual signals as saccades were delayed when visual stimuli were displayed after target onset. 30
Moreover, onset and offset of visual signals differentially affected the execution of saccades. 31
However, the study used a group design and lacked data points precisely where strongest 32
multisensory interactions are expected to happen, that is, for stimulus onset asynchronies (SOA) 33
within [−100 ms; +100 ms]). Another study reported a facilitation modulated with SOA ranging 34
between −50 ms and +100 ms for spatially congruent sounds, which disappears with incongruent 35
4
sounds (M. A. Frens, Van Opstal, & Van der Willigen, 1995). However, the limited number of 1
participants (N=3) constrained statistical conclusions and weakened the impact of the study. Similar 2
multisensory latency variations have been reported for SOAs ranging from −30 ms to +120 ms, again 3
modulated by the spatial congruency between the sound and the visual target (H Colonius & Arndt, 4
2001). These multisensory influences have an effect on saccades that could share similar mechanisms 5
and combine with the gap/overlap effect (Saslow, 1967). Saccade latencies decrease when the 6
fixation disappears before target onset (gap) and increase when it remains after target onset 7
(overlap). 8
Another line of research focused on the effects of spatial congruency across modalities. 9
Saccades toward a visual target had shorter or longer latencies when an auditory distractor was 10
spatially aligned or misaligned, respectively (Corneil & Munoz, 1996). These effects depend on the 11
physical distance between the visual target and the sound source (H Colonius & Arndt, 2001; M. A. 12
Frens et al., 1995). For combined congruent audiovisual targets, the latency decrease was well 13
predicted by independent race models, suggesting that multisensory integration in the target 14
selection is not optimal (Corneil & Munoz, 1996). Finally, inhibiting saccades toward an auditory 15
distractor when the fixation point is already turned off proved more difficult than when the fixation 16
remains visible at the target onset (Munoz & Corneil, 1995), revealing an interaction between 17
disengaging fixation and the target selection in the SC. Importantly, tactile stimulations as well 18
influence saccades, both in the spatial and temporal dimensions (Hans Colonius & Diederich, 2004): 19
latencies are reduced when a touch is delivered before target onset, the facilitation being maximal 20
when the touch and visual target are spatially congruent (Amlôt, Walker, Driver, & Spence, 2003). 21
Reactive saccades (i.e. stimulus-driven) have been observed using purely somatosensory stimuli 22
(Amlôt & Walker, 2006), which points to early interactions of the visual and tactile modalities in the 23
generation of saccades. The best locus candidate being again the deep layers of SC (Findlay & Walker, 24
1999; Amlôt & Walker, 2011). 25
The current project brings new insights into the multisensory interactions occurring when 26
programming and executing eye-movements. We investigated whether an irrelevant stimulus 27
delivered around the appearance of a visual target, which expectedly alters the perceived timing of 28
the target onset, might influence saccade latencies. Specifically, we used auditory (experiments A 29
and B), visual (experiments C and D), tactile (experiment E) and combined tactile and auditory stimuli 30
(experiment F) to probe the effects of multisensory temporal integration on the possible mechanisms 31
underlying the selection and execution of saccades. Our results indicate reliable SOA dependent 32
multisensory effects on saccadic reaction time when using sounds or touches. Visual stimuli, on the 33
other hand, appear to produce a different behavioral pattern, indicating that temporal integration 34
requires signals from different modalities. 35
5
Experiment A – Beeps & Saccades
1
The goal of the first experiment was to test whether a short beep presented in temporal 2
proximity with the onset of the visual target alters the execution of saccades. We measured the 3
latencies of saccades toward visual targets appearing either rightward or leftward of a fixation, while 4
delivering a beep with a stimulus onset asynchrony (SOA) ranging from −240 ms (beep first) to 5
+240 ms (beep after). Saccadic eye-movements were chosen for they provide reliable and short 6
reaction times, allowing one to quantify subtle differences in decision processing delays. A baseline 7
condition without beep was also tested. 8
Materials and Methods
9Participants
10
8 volunteers (5 women and 3 men) participated in this experiment, all naïve to the purpose of 11
the experiment except two of the authors. Participants were aged between 22 and 43 years old 12
(average 32.3), all right handed. They gave a written consent after being informed of the 13
experimental methods used and their right to interrupt the experiment at any time. The whole 14
project was approved by the local ethics committee and complies with the regulations described in 15
the Declaration of Helsinki. 16
Apparatus and Stimuli
17
Subjects sat in front of a screen with head movements restricted by a chin and head rest. 18
Stimuli were generated on a Mac computer running Mac OS 10.6.8 operating system. Routines were 19
written in Matlab 7.10.0 using the PsychToolbox 3.0.9 (Brainard, 1997; Pelli, 1997). The right eye 20
position was recorded using an SR Research EyeLink 1000 video eye tracker (sampling at 1000Hz) 21
mounted on the same structure as the chin rest. Visual stimuli were displayed on a Sony Trinitron 22
CRT monitor running at a resolution of 1024×768 and refreshed at 100Hz (frames of 10 ms). The chin 23
rest was adjusted so that the eyes in primary position were aligned with the center of the screen, at a 24
distance of 57 cm. The fixation point was a small white disk (0.12° in diameter) displayed at the 25
center of the screen. The saccade target was a white disk (0.36° in diameter) that could appear either 26
to the left or to the right of the fixation at an eccentricity of 8°. Background was set to 50% grey level 27
(25.8 cd/m2 luminance after gamma correction). Beeps were 20 ms 880 Hz tones attenuated by a 28
raised-cosine waveform (50% after 10 ms) delivered binaurally through closed headphones 29
(Beyerdynamics DT770). The computer audio driver was set so that the audiovisual jitter remained 30
below 1 ms. The accuracy of the timing of visual and auditory stimuli was controlled using a dual-31
6
channel oscilloscope connected to both the auditory output and a photosensitive cell placed directly 1
on the screen. 2
Procedure
3
Fig 1 illustrates the general time course of a trial with the various signals used for each of the 4
six experiments we conducted. Trials started with the fixation point appearing in the center of the 5
screen. Subjects were asked to fixate it and to avoid blinking during the stimulus presentation. After 6
a random delay ranging from 750 ms to 1250 ms, the fixation was turned off and the saccade target 7
appeared either leftward or rightward, at an eccentricity of 8°. In most trials of experiment A a beep 8
was delivered around the time of target onset. Trial conditions were defined as the combination of 9
two factors: 10 values of stimulus onset asynchronies (SOA) i.e. the delay separating the onset of the 10
visual target and the auditory stimulus (−240, −120, −60, −30, 0, +30, +60, +120, +240 ms and No 11
beep baseline where no beep was played) and 2 target directions (left and right). Subjects were 12
instructed to perform a saccade as quickly and accurately as possible toward the visual target, 13
regardless of the non-informative beeps. 14
15
16
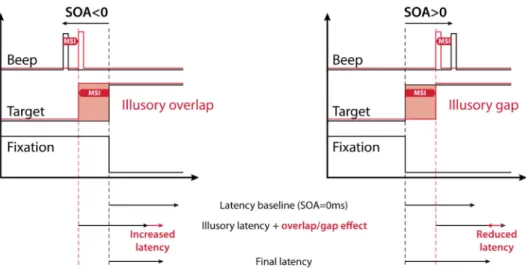
Fig 1. Time course of a trial with the different signals used for each experiment. A central fixation point 17
is presented for a random duration (ranging from 750 to 1250 ms) then the target appears either to the 18
left or to the right and a brief signal is delivered either before or after target onset (SOA ranging from 19
−240 to +240 ms). The signal was either a beep (exp. A, B & F), a background luminance decrease (exp. 20
C), a pair of isoluminant strips (exp. D) or a tactile vibration (exp. E & F), all lasting about 10 ms. In trials 21
with the baseline conditions, no signal was delivered. The participant had to shift gaze toward the target 22
as fast as possible. The saccade latency is defined as the delay between the target appearance and the 23
eye-movement onset; the saccade duration is the time needed to land on the target. 24
7
The first five subjects completed 8 sessions of 300 trials totalizing 2100 trials (105 per 1
SOA × direction). For the remaining three subjects, the experiment was reduced to 4 sessions of 240 2
trials totalizing 960 trials (48 trials per SOA × direction). The order of the conditions was randomized 3
within blocks of 40 trials. Between each session subjects had a few minutes break where they could 4
stand out of the setup to rest. The calibration procedure (using 13 positions on the monitor) was 5
performed at the beginning of each session. After each block of 50 trials, subjects could rest for a few 6
seconds without moving their heads, then a potential drift in eye movement calibration was checked 7
(using a single location) and corrected if needed, before resuming. 8
Data processing
9
We used the Eyelink online saccade detector to identify saccades onset and offset, using 30°/s 10
velocity and 8000°/s2 acceleration thresholds (Stampe, 1993). Invalid trials in which either no saccade 11
was detected, eyes blinked, saccades started too late (latency>400 ms) or fell too short 12
(amplitude<3°) – were discarded. An adaptive low-pass filter was then applied to the set of latencies 13
in order to remove most of anticipatory saccades. For each condition, the cutoff criterion of the 14
latency distribution was determined using an iterative process. The cutoff started at 80 ms and 15
increased by steps of 1 ms until fewer than 1% of the remaining saccades in the distribution were not 16
directed toward the target. Because anticipatory saccades have 50% chances to go in the wrong 17
direction, limiting these saccades below 1% mechanically limited anticipatory saccades going in the 18
right direction below 1% as well (see the discussion below for more details on this issue). In this 19
experiment, the cutoff was set at the lowest value (80 ms), with the proportions of saccades in the 20
wrong direction averaging 0.10% across participants (maximum 0.29%). This filter was designed to 21
adapt to individual peculiarities and find the optimal tradeoff between a maximum of visually-driven 22
saccades in the distributions while removing a maximum of saccades programmed before processing 23
the visual signal related to target onset. At this stage, only two saccades going in the wrong direction 24
were detected across all subjects. Finally, saccades falling short (gain<0.45) and going in the wrong 25
direction were excluded. A total of 12327 saccades out of the 13080 recorded trials were analyzed 26
(94.2%). For each subject and each SOA condition, the median value and the median absolute 27
deviation (MAD) of the saccade latency distribution were computed. In order to reduce inter-28
individual dispersion for the statistical analyses, and to allow for comparisons between experiments, 29
we have normalized the median latency and the MAD taking the No signal condition (i.e. No beep in 30
experiment A) as a baseline, using the following equations: 31
, = !
" #$% & (1)
8
where ' is either the median latency or the MAD of a given condition, and ( is the standard 1
deviation of ' across all conditions. A two-way repeated measure ANOVA (design: 9 SOA × 2 target 2
direction) was performed on the nscores. The No beep condition, that always had a null nscore by
3
construction, was excluded from the design. There was neither a main effect of Target direction 4
(F(1,7)=2.17, p=0.18) nor a SOA x Target direction interaction (F(8,56)=0.77, p=0.63). Consequently, 5
left and right saccades were pooled together in a single distribution and the median of this collapsed 6
distribution was further analyzed using a one-way repeated measure ANOVA with SOA as factor. 7
Planned comparisons consisted of paired student t-tests between SOA conditions, and a single 8
sample t-test to test the difference with the No beep baseline, as detailed below. To ensure that 9
nscores did not deviate from normality and that they met the homoscedasticity assumption required
10
for parametric statistics, we conducted a Shapiro-Wilk’s test and a Levene’s test before performing 11
these planned comparisons. Except otherwise stated, throughout this article all sets of measures had 12
distributions that did not significantly differ from normality, and the compared sets had 13
homogeneous variances. The alpha value for significance was set to 0.00555 after Bonferroni 14
correction for multiple comparisons on a single data set (here 9 comparisons). S1 Table reports the 15
results of all these tests along with the corresponding effect size (Cohen's d). 16
Results
17The effects of auditory beeps on the saccade onset as a function of SOA are summarized in Fig 18
2. The general pattern of individual median latencies – plotted in grey – show great similarities across 19
subjects, with some inter-individual differences in the amplitude of the effects. To reduce this 20
disparity we computed, for each SOA condition, the nscores taking the No beep condition as a baseline,
21
which revealed a great homogeneity in participants’ behaviors. SOA had a significant main effect on 22
the nscores (F(8,56)=55.50, p<0.0001, ηp2=0.89). In order to evaluate the extent of the warning effect
23
when a beep is delivered near target onset, we performed single sample t-tests with the nscores
24
observed in the SOA=0 ms condition and with the average nscores across the range of SOAs. This
25
analysis revealed that saccade latency decreased significantly by about 11.0 ms when the target and 26
the beep were presented simultaneously (p<0.0002) and by 7.6 ms on average (p<0.00001), 27
compared to the No beep condition. 28
To further investigate possible modulations of saccade latency we then performed paired t-29
tests on the nscores comparing the SOA=0 ms reference with each of the other SOA condition. Saccade
30
latencies tended to be shorter for earlier beeps (i.e. beep onset precedes target onset) compared to 31
synchronous beeps (p=0.024 and p=0.038 for SOA=−120 and −60 ms respectively) and increased 32
significantly for later beeps (i.e. beep onset follows target onset) (p<0.0001 for all positive SOA). This 33
9
modulation produced saccades that tended to have even longer latencies than the No beep baseline 1
for SOA=+60 ms and +120 ms (paired t-tests, p=0.011 and p=0.008), before returning to the 2
asymptotic level of the baseline at SOA=+240 ms. Within the studied range of SOA, beeps modulated 3
the saccadic reaction time by about 22 ms, corresponding to 16% of the median latency observed 4
with synchronous auditory and visual stimuli. 5
Finally, we performed the same analyses on the median absolute deviation (right panel) to 6
determine the effect of the beeps on the temporal precision of saccades. Interestingly, delivering a 7
synchronous beep significantly reduced latency dispersion (p<0.003), which was significantly larger 8
than with a synchronous beep for SOA=−120 ms (p<0.004), 60 ms (p<0.002) and 120 ms (p<0.0004). 9
10
Fig 2. Experiment A. Effect of sound beeps on saccade onset. Median latencies (left panel) and median absolute deviations (right panel) averaged across participants for each SOA condition (top) and their corresponding nscores (bottom). Dashed lines show the No beep condition level and grey lines show
individual results. Error bars indicate inter-individual SEM. Statistics included a single sample t-test performed on the nscores of the SOA=0 ms reference condition to highlight the difference with the No
beep condition (black arrow), and paired t-tests comparing this reference with each of the other SOA condition (red stars for each SOA above the X-axis). Three stars indicate highly significant differences after Bonferroni correction (p<0.00555) while single stars significant differences without correction (p<0.05). Red arrows indicate the overall range of variations.
10
Discussion
1
Saccades were triggered sooner by about 11ms when a spatially non-informative beep was 2
delivered precisely at the target onset (SOA=0 ms). This reduction in reaction time could be the 3
signature of increased attention: the external sound would act as a warning event that speeds-up 4
saccade triggering (S. M. Ross & Ross, 1981; Reuter-Lorenz, Oonk, Barnes, & Hughes, 1995). Another 5
interpretation might propose that the sound acts as a distractor that partially disengages the 6
attention allocated to the fixation point, thereby reducing latencies with mechanisms similar to those 7
possibly involved in a gap paradigm (Fischer & Weber, 1993). Moreover, early beeps tended to 8
reduce the saccade latencies compared to the synchronous beep condition, while late beeps 9
significantly delayed the saccades for all positive SOAs, producing saccades with even longer 10
latencies than when no beep was delivered. For beeps occurring 240 ms after target onset, saccade 11
latencies decreased back to the baseline asymptote. 12
It is noteworthy that subjects sometimes initiated their saccades before having correctly 13
processed where the target appeared, mostly in conditions where the beep was presented before 14
target onset. This could possibly reduce the latencies for negative SOAs and produce the overall 15
pattern we observed. However, we believe that this was not the case. Saccades triggered before 16
proper target detection have 50% chance of going in the right direction. To remove these 17
anticipatory saccades, we used a similar reasoning as what has been proposed to isolate true express 18
saccades (Fischer & Weber, 1993). Individual histograms showing, for each condition, the number of 19
initial saccades going in the opposite direction – plotted either before or after applying the adaptive 20
low-pass filter on latencies described in the Materials and Methods – are provided in Fig S4 of the 21
supporting information. Only 12 saccades going in the wrong direction remained, a negligible fraction 22
of the distribution (considering the 12327 that were analyzed). Therefore, we are confident that the 23
vast majority of saccades programmed before target detection (but going in the right direction) were 24
also removed by our low-pass filter. Moreover, unlike for means, the analysis of medians is rather 25
robust to extreme values. We can therefore conclude that anticipatory saccades did not significantly 26
contribute to the observed latency modulations. 27
In this experiment, we presented a sound in the majority of trials and participants might have 28
developed an expectation such that in each trial they waited for a sound before triggering the 29
saccade. This strategic behavior would obviously lead to increased latencies in trials in which the 30
sound was played after the visual target or not played at all. One could therefore argue that the 31
effect we observed might be simply induced by the experimental design. In order rule out this 32
possibility, we conducted a control experiment in which the experimental conditions were blocked to 33
better control the participant’s expectation. 34
11
Experiment B – Blocked control
1
This experiment used the same method as experiment A except that conditions now were 2
blocked and only 3 SOAs (−60, 0 and +60 ms) and the No beep condition were used. In other words 3
each SOA condition and the No beep condition were presented in separate blocks. If the warning 4
effect found in experiment A was due to delayed saccades in the No beep condition rather than 5
shorter latencies with synchronous beeps, this advantage should be reduced or cancelled when 6
blocking the experimental conditions. Similarly, if the modulation effect found in experiment A was 7
due to waiting for the late arrival of beeps, one would expect to find a limited difference between 8
the SOA=0 ms and the other positive SOA conditions with a blocked design. 6 volunteers (2 women 9
and 4 men) participated in this experiment, 4 of them participated in experiment A. They were aged 10
between 24 and 43 years old (average 35.8) and all but one right handed. Subjects completed 2 11
sessions of 240 trials totalizing 480 trials (48 per SOA × direction). Each block included 60 trials with a 12
single SOA and two possible target directions. The order of these 60-trials blocks was randomized for 13
each participant. 14
Results
15A total of 2727 out of 2880 recorded trials were analyzed (94.7%). After applying our low-pass 16
filter to remove anticipatory saccades, only 3 saccades going in the wrong direction remained. Given 17
that the latencies for leftward and rightward saccades did not differ – no main effect (F(1,5)=0.25, 18
p=0.88) nor interaction with SOA (F(2,10)=1.82, p=0.21) – we pooled them together for further 19
analyses. Latency nscores were computed for each of the 3 SOA conditions taking the No beep
20
condition as a baseline. 21
Fig 3 summarizes the results of experiment B, showing the effect of beeps on saccade latency 22
when the SOA conditions were blocked (left panel) and comparing it with the results of experiment A 23
where conditions were interleaved (right panel). In experiment B, SOA had again a significant main 24
effect on the nscores (F(2,10)=154.44, p<0.0001, ηp
2
=0.97). In order to evaluate whether saccade 25
latency was affected by the beeps, we performed single sample t-tests on the nscores of the SOA=0 ms
26
condition and on the average nscores across the range of SOAs. The analysis showed that saccade
27
latency significantly decreased by about 13.5 ms with a synchronous beep (p<0.001) and by 8.9 ms 28
on average (p=0.018), compared to the no beep condition. We then compared latencies from the 29
SOA=0 ms reference condition with the other two SOAs using Student’s paired t-tests. The analyses 30
showed that early beeps tended to have shorter latencies (p=0.07 for SOA=−60 ms), while late beeps 31
significantly increased saccade latencies (p<0.0001 for SOA=+60 ms). In order to compare data 32
obtained in experiment B with the ones from experiment A, we computed for both experiments the 33
12
individual median latency differences between each SOA condition and its respective No beep 1
baseline. Unpaired Student t-tests comparing the latency differences obtained for each experiment 2
revealed no significant difference. Moreover, the average modulation effect within the same range 3
(i.e., −60 to +60 ms) was not different (19.6 ms vs. 18.8 ms for experiment B and A, respectively). 4
5
Fig 3. Experiment B. Effect of sound beeps on saccade onset with blocked conditions (left panel). Median latencies averaged across participants for each SOA condition (top) and the corresponding nscores
(bottom). Dashed lines show the No beep condition level and grey lines show individual data. Error bars indicate inter-individual SEM. Statistics included a single sample t-test performed on the nscores of the
SOA=0 ms reference condition to highlight the difference with the No beep condition (black arrow), and two paired t-tests comparing this reference with SOA=−60 or +60 ms conditions (red stars above the X-axis). Interleaved vs. blocked conditions (right panel). Comparison between experiment B (red plot) and A (grey plot): median latency differences (top) and nscore differences (bottom) aligned on the No beep
condition (dashed lines). Unpaired t-tests performed on the nscore differences between experiments for
the 3 SOA conditions showed no significant difference. Three stars indicate highly significant differences after Bonferroni correction (p<0.01666). Red arrows indicate the overall range of variations.
Discussion
6Grouping the various trial types in blocks should promote forming expectations about when 7
exactly the beep would appear with respect to target onset. We did not observe a reduction of the 8
advantage found in experiment A when delivering a synchronous beep, nor limited difference 9
13
between the SOA=0 ms and the other positive SOA conditions. The absence of differences in the 1
blocked versus interleaved experiments provides a clear indication that the modulation observed in 2
experiment A is not a design artifact related to a strategic waiting for the auditory signal. Overall, 3
these results support the view that the effects on saccade latency result from multisensory 4
interaction influencing the temporal processing of the target. Auditory and visual maps encoding 5
saccadic goals in space have been found in the deep layers of superior colliculus (D. L. Sparks, 1988; 6
David L. Sparks & Nelson, 1987). These maps are spatially kept in register permitting efficient 7
audiovisual integration (Jay & Sparks, 1984). The evidence for integration in the temporal dimension 8
reported here could take place in the superior colliculus as well. Indeed, auditory events delivered 9
near the timing of target onset would produce a stronger multisensory activity in the motor maps 10
coding for the target in SC (M. A. Frens et al., 1995). 11
Interestingly, multisensory interactions influenced the temporal processing of the target, even 12
though the beeps did not provide any information regarding the direction or timing of the target. In 13
an earlier study, we found that the temporal integration of a beep and a flash can modulate the 14
perceived appearance of the flash, so that it is perceived later or, to some extent, earlier in time, 15
depending on whether it is preceded or followed by a beep (Vidal, 2017). Such asymmetrical 16
modulation was also reported for multisensory integration after adaptation to an audiovisual 17
temporal lag (Vroomen, Keetels, de Gelder, & Bertelson, 2004; Fujisaki, Shimojo, Kashino, & Nishida, 18
2004; Desantis & Haggard, 2016). Here we found a similar asymmetrical modulations of saccade 19
triggering, suggesting that the same multisensory mechanisms might be involved. Importantly, two 20
interaction modes depending on the audiovisual offset are possible (Vidal, 2017): for offsets below 21
40 ms, a single fused bimodal event is perceived while for larger offsets and up to 200 ms, two 22
separate events are perceived but they are reported as being closer in time than they physically are. 23
Supposing that the same perceptual law applies to the target onset, we propose that for short SOAs 24
the beep and the target were perceived as being simultaneous while for longer SOAs the perceived 25
target is only shifted in time toward the beep. Consequently, participants might have detected the 26
visual target faster or slower depending on whether the auditory signal preceded or followed the 27
target, thus modulating saccade latency. It should however be pointed out that the extent of 28
latencies modulations reported here (about 12 ms) is much smaller than what has been found in 29
purely perceptual tasks (about 120 ms, Vidal, 2017), a result that will be further discussed in the 30
general discussion. 31
14
Experiment C – Background flashes & Saccades
1
To probe whether the modulation effects we found in the two previous experiments is specific 2
to audiovisual integration and to disentangle it from possible alertness effects, we conducted 3
another experiment in which the auditory signal (beep) was replaced by a visual signal. The visual 4
signal was a full-screen luminosity decrease from the usual grey background (25.8 cd/m2) to a totally 5
black background (0 cd/m2) lasting one frame (10 ms) before returning to the original grey value. We 6
used a transient signal – as for the previously used auditory signal – and, since we operate in the 7
visual modality, we opted for a signal that carries no spatial information to prevent possible 8
interference with saccadic control mechanisms. Indeed, we reasoned that in the studies of Ross & 9
Ross (1980; 1981) the onset and offset of symbols might compete with the encoding of the target 10
location, possibly taking place in the superior colliculus, resulting in specific interactions not related 11
to a multisensory combination. The experimental protocol and data processing were otherwise the 12
same as in experiment A. 8 volunteers (5 women and 3 men) participated in this experiment, 7 of 13
which already participated in experiment A. They were between 25 and 43 years old (average 31.4) 14
and all right handed. 15
Results
16A total of 7354 out of 7680 recorded trials were analyzed (95.8%). After applying our adaptive 17
low-pass filter only 6 saccades going in the wrong direction were not removed, showing that the vast 18
majority of anticipatory saccades were successfully eliminated. Since no difference was observed in 19
the latencies of leftward versus rightward saccades – no main effect (F(1,7)=0.041, p=0.84) nor 20
interaction with SOA (F(8,56)=1.17, p=0.33) – they were pooled together for further analyses. 21
Latency nscores were computed for each of the 9 SOA conditions taking the No flash condition as a
22
baseline. Fig 4 summarizes the results of experiment C, showing the effect of background flashes on 23
saccadic onset (left panel) and comparing it with the effect of beeps reported in experiment A (right 24
panel). SOA had a significant main effect on the nscores (F(8,56)=23.84, p<0.0001, ηp
2
=0.77). Single 25
sample t-tests on the SOA=0 ms condition nscores and on the average nscores across the SOA range
26
showed that neither synchronous flashes (p=0.52) nor flashes in general (p=0.34) affected saccade 27
latencies, compared to the No flash condition. Moreover, student t-tests comparing the SOA=0 ms 28
reference with each of the other SOA condition showed that flashes increased saccade latency both 29
when they were presented just before (p=0.020 for SOA=−30 ms) and after target onset (p<0.003 30
and p<0.0004 for SOA=+30 and +60 ms, respectively). This reactivity impairment is confirmed by the 31
reduced accuracy observed in the saccade landing positions: saccadic gains were significantly lower 32
when flashes were delivered 30 ms before or 120 ms after target onset (p<0.004, see supporting 33
15
information S5 Fig left). In order to compare the results from experiment C with the ones from 1
experiment A, we computed the individual median latency differences between each SOA condition 2
and the No beep (experiment A) or No flash (experiment C) baselines. We then performed unpaired 3
Student t-tests to compare these latency differences between experiments. We found a qualitatively 4
different pattern, with nearly all SOA conditions yielding significantly higher latencies in experiment C 5
compared to experiment A (p<0.0025 for all except SOA=−60, +120 and +240 ms with p=0.0070, 6
p=0.036 and p=0.68 respectively). The maximum average difference across the SOA range was only 7
marginally different (31.3 ms vs. 22.2 ms, p=0.063 computed on the nscores).
8 9
Fig 4. Experiment C. Effect of background flashes on saccade onset (left panel). Median latencies averaged across participants for each SOA condition (top) and the corresponding nscores (bottom). Dashed
lines show the No flash condition level and grey lines show individual results. Error bars indicate inter-individual SEM. Statistics included a single sample t-test performed on the nscores of the SOA=0 ms
reference condition to highlight the difference with the No flash condition (black arrow), and paired t-tests comparing this reference with each of the other SOA condition (red stars for each SOA above the X-axis). Auditory beeps vs. visual background flashes (right panel). Comparison between experiment C (red plot) and A (grey plot): median latency differences (top) and nscore differences (bottom) aligned on
the No signal conditions (dashed lines). Statistics were unpaired t-tests performed on the nscore
differences between experiments for each of the 9 SOA conditions. Three stars indicate highly significant differences after Bonferroni correction (p<0.00555), single stars and two stars significant differences without correction (p<0.05 and p<0.01 respectively). Red arrows indicate the overall range of variations.
16
Discussion
1
In this experiment, the data show that when a visual signal – a background flash – was 2
presented 30 to 60 ms after target onset, saccades were strongly impaired with longer latencies and 3
lower spatial accuracies. When the background flash was presented 30 ms before target onset, 4
saccades were also impaired albeit to a limited extent. However, when the visual signal and the 5
target onset were simultaneous we observed similar saccade latencies both when the target was 6
presented alone and when it was combined with a simultaneous flash. However, when the visual 7
signal occurred between 60 to 120 ms before target onset, saccade latency tended to decrease. 8
These findings could be regarded as related to the effects induced by visual warning signals – onset, 9
offset or change of symbol ‘o’ within the fixation cross – on saccades (L. E. Ross & Ross, 1980; S. M. 10
Ross & Ross, 1981). The authors reported a warning effect when the visual signal was delivered 11
100 ms to 600 ms before target onset, with shorter latencies than without a visual signal. Conversely, 12
when the visual signal was delivered 50 to 150 ms after target onset, saccade execution was impaired 13
and latencies were longer. Furthermore, they found differential effects between onset and offset 14
signals on saccade latencies, which points to underlying mechanisms similar to the ones involved in 15
the gap and overlap effects (Saslow, 1967). Indeed, in the Ross and Ross (1980; 1981) paradigm, 16
visual signals inside the fixation cross that appeared before (or disappeared after) target onset could 17
have impaired (or facilitated) the release of fixation by modulating the activity of the rostral pole of 18
the superior colliculus responsible for fixational eye movements (Krauzlis, Goffart, & Hafed, 2017). To 19
avoid such interactions between visual signal, fixation and target, we used a full-background flash 20
conveying no spatial information. Despite this important methodological difference we also found 21
longer saccade latencies when the flash was presented 30 ms before and 30 or 60 ms after target 22
onset. However, we found a limited warning effect when the flash appeared more than 60 ms before 23
target onset; and no changed in latencies when the flash coincided with the target onset. Curiously, 24
White et al. (2005) found a strong warning effect using a large pink noise visual distractor presented 25
before target onset. In their study, the visual signal remained on until the end of the trial, which 26
might explain why they did not observe the same detrimental interference we did. Indeed, the rapid 27
transient feature of our visual signal probably comes with a stronger propensity to divert attention. 28
Moreover, in their study only the fixation-to-target SOA was manipulated, inducing a gap or overlap 29
situation, while the distractor always appeared at the offset of fixation. Therefore, the effect of the 30
visual signal timing relative to the target onset – our SOA – could only be determined indirectly by 31
subtracting the gap/overlap effect obtained in baseline conditions, reducing the validity of this result. 32
Because the transient visual signal we used did not provide a fixation signal that could 33
compete with the target, the changes in saccade latencies we observe here cannot result from a 34
17
difficulty to release fixation, as in it is thought to be the case in an overlap paradigm. Instead, in our 1
experiment the reduced saccade performance could relate to masking effects produced by saccadic 2
inhibition. On the one hand, it is well established that when a visual distractor is presented 3
simultaneously with the target, saccade latencies increase depending on the distractor’s position in 4
the visual field (Lévy-Schoen, 1969; Walker, Deubel, Schneider, & Findlay, 1997), a phenomenon 5
called the remote distractor effect (RDE). On the other hand, a large peripheral distractor presented 6
shortly after the target strongly reduces the probability of triggering a saccade around 100 ms after 7
the distractor appearance, a phenomenon called saccadic inhibition (SI) which results in a dip in the 8
saccade latency distributions (Reingold & Stampe, 2002). It has been proposed that these are one 9
and the same phenomenon, where SI would be the underlying mechanism of the RDE (Buonocore & 10
McIntosh, 2008; Bompas & Sumner, 2015). In our experiment, when adding a full screen visual flash 11
shortly after the target onset we create the condition where SI takes place. Indeed, we found 12
delayed saccades with latencies peaking when the flash occurred about 60 ms after target onset. This 13
is consistent with the SI reported for transient large top/bottom flashes (Reingold & Stampe, 2002), 14
persistent large arrays of targets (Guillaume, 2012), but not persistent large pink noise stimuli (White 15
et al., 2005) where backward masking, once isolated from the gap/overlap baseline, was only very 16
limited. As discussed earlier, this difference could relate to the transient nature of our signal, but also 17
to different choices in the design, which allowed us to assess directly the effect of the signal offset on 18
latencies. Lastly, the reduced gain of saccade amplitudes observed when the flash was presented 19
about 100 ms after the target onset is yet another signature of SI (Guillaume, 2012). Interestingly, we 20
found no saccadic impairment when both flash and target onset occurred simultaneously, which 21
could be interpreted as the absence of RDE when using large distractors (White et al., 2005). 22
However, in such situation, the drastic change in luminance contrast when the background screen 23
turns black increases the saliency of the target, which might reduce its processing time: the RDE 24
could be compensated by an opposite effect due to the increased visibility of the target. 25
Overall, we found a limited visual warning effect: adding background flashes before the target 26
onset did not lead to shorter saccadic latencies, except for the 120 ms SOA. We could not find 27
evidence for visual-visual temporal integration either: irrelevant background flashes did not attract 28
the target onset in time to modulate saccade latencies in the same way as beeps did. As we 29
proposed, the latency modulation observed with auditory signals could result from audiovisual 30
integration, taking place most probably in the deep layers of the superior colliculus. We now suggest 31
that mechanisms other than multisensory integration are involved when using this visual signal, 32
namely saccadic inhibition and the RDE. At this stage, three hypotheses could explain this difference: 33
(i) the modulation resulting from cue combination is specific to audiovisual integration; (ii) sensory 34
cues have to come from different modalities to combine, as it has been reported in a different 35
18
context (Hillis, Ernst, Banks, & Landy, 2002); (iii) the properties of the irrelevant visual stimulus used 1
in experiment C do not permit the observation of visual-visual integration. These questions are 2
addressed in the experiments reported below. More specifically, in experiment D we replaced the 3
transient change in background luminance used in experiment C with a less visible pair of 4
isoluminant stripes presented in peripheral vision to avoid overlapping with the attended locations 5
where targets are displayed. Indeed, the high saliency of the visual signal used in experiment C could 6
be responsible for strong masking effects, thereby preventing the observation of subtle visual-visual 7
interactions. Experiments E and F investigated whether a tactile signal presented around the onset of 8
the visual target might produce a modulation of saccade latency similar to the one observed with 9
auditory stimuli. 10
Experiment D – Strips flashes & Saccades
11
The change in background luminance used in experiment C was particularly salient. Notably, 12
the whole background luminance was significantly altered for 10 ms over a large portion of the visual 13
field, which included the attended regions of the visual field where the visual target was presented. 14
This salient signal could have generated a strong saccadic inhibition resulting in the significant 15
masking effects observed in experiment C, behind which visual-visual integration evidence would be 16
concealed. To rule out this explanation, we created a new visual signal where the overall changes in 17
saliency were much reduced. The background flash was replaced by a pair of horizontal isoluminant 18
strips flashed for 10 ms in peripheral vision (see Fig 1). The strips displayed in the top and bottom of 19
the screen (10.5° to 15.1° vertical eccentricity) had an average luminance equal to the grey 20
background (50% corresponding to 25.8 cd/m2). The experimental protocol was otherwise similar to 21
the one in experiment C. 4 volunteers (2 women and 2 men) participated in this experiment, all from 22
experiment C’s pool of subjects. They were aged between 36 and 43 years old (average 39.8) and all 23
right handed. 24
Results
25A total of 3780 out of 3850 recorded trials were analyzed (98.4%). Only one saccade going in 26
the wrong direction was not removed by the adaptive low-pass filter, which shows that the vast 27
majority of anticipatory saccades were correctly eliminated. Given that saccade latency of leftward 28
and rightward saccades did not differ – no main effect (F(1,3)=0.022, p=0.89) nor interaction with 29
SOA (F(8,24)=1.19, p=0.34) – we pooled them together for further analyses. Latency nscores were
30
computed for each of the 9 SOA conditions taking the No flash condition as a baseline. Fig 5 31
summarizes the results of experiment D, showing the effect of strips flashes on saccadic onset (left 32
19
panel) and comparing it with the effect of background flashes reported in experiment C (right panel). 1
SOA had a significant main effect on the nscores (F(8,24)=4.56, p<0.002, ηp
2
=0.6). Student t-tests 2
comparing the SOA=0 ms reference condition with each of the other SOA condition revealed that 3
flashes occurring just before the target tended to increase latencies (p=0.038 and p=0.031 for 4
SOA=−60 and −30 ms, respectively), a tendency that became mostly significant with flashes 5
presented after the target (p<0.0026 for SOA=+30 and +120 ms, and p=0.018 for SOA=+60 ms). This 6
impairment is partly confirmed by the reduced accuracy observed in the landing positions when 7
flashes were delivered after target onset: saccadic gains tended to be lower (p=0.012 for 8
SOA=+120 ms, see supporting information S5 Fig right). Curiously, a single sample t-test on the nscores
9
of the SOA=0 ms condition showed that adding synchronous flashes tended to reduce saccade 10
latencies by 9.9 ms (p=0.020), although across the whole range of SOAs, flashes did not affect 11
latencies (p=0.51). 12
In order to compare the results of experiment D with the results of experiment C, we 13
computed for both experiments the individual median latency differences between each SOA 14
condition and its respective No flash baseline. We then performed unpaired Student t-tests to 15
compare these latency differences between experiments and found a quite similar pattern of 16
behavior, except that with strips flashes saccades were significantly faster when SOA=0 ms 17
(p<0.0055), and the limited warning effect found for SOA=−120 and −60 ms with background flashes 18
tended to disappear (p=0.041 and p=0.057, respectively). 19
20
Fig 5. Experiment D. Effect of strips flashes on saccade onset (left panel). Median latencies averaged across participants for each SOA condition (top) and the corresponding nscores (bottom). Dashed lines
show the No flash condition level and grey lines show individual results. Error bars indicate inter-individual SEM. Statistics included a single sample t-test performed on the nscores of the SOA=0 ms
reference condition to highlight the difference with the No flash condition (black arrow), and paired t-tests comparing this reference with each of the other SOA condition (red stars for each SOA above the X-axis). Background flashes vs. strips flashes (right panel). Comparison between experiment D (red plot) and C (grey plot): median latency differences (top) and nscore differences (bottom) aligned on the No flash
condition (dashed lines). Statistics were unpaired t-tests performed on the nscore differences between experiments for each of the 9 SOA conditions. Three stars indicate highly significant differences after Bonferroni correction (p<0.00555) while single stars significant differences without correction (p<0.05). Red arrows indicate the overall range of variations.
Discussion
1In this experiment, we used a new visual signal – isoluminant strips flashed for 10 ms in 2
peripheral vision – designed to induce a much lower transient change in saliency than the full-3
background luminance decrease used in experiment C. During the debriefing, subjects reported that 4
these flashes were indeed barely visible. We expected that this type of visual signal would limit the 5
remote distractor effect (RDE), and thus reveal a potential modulation – even limited – of saccade 6
latency similar to the one observed with the auditory signal. The effects on saccade latency were to 7
some extent reduced with strips flashes compared to background flashes, which supports our 8
hypothesis regarding the limited RDE. The limited warning effect that we observed when the 9
background flashes were presented 120 ms and 60 ms before the target onset was eliminated with 10
the strips flashes. However, there was still no evidence for visual-visual temporal interactions: 11
irrelevant flashes did not combine with the target onset to modulate saccade latencies. The strips 12
flashes also led to a reduced accuracy in saccade landing positions when the flash occurred after 13
target onset. Interestingly, when the target and signal onset were synchronous, saccade latencies 14
were shorter. As previously discussed, the target visibility could be increased by the simultaneous 15
flash, producing an effect opposite to the RDE. One might speculate that, although with the low-16
saliency signal, this effect could have been reduced, this was not the case and since the masking 17
effect mediated by the saccadic inhibition was reduced, the combined effect resulted in saccade 18
latencies 10 ms shorter than without visual signal. 19
To summarize, contrary to what we observed with auditory signals, visual targets were not 20
temporally integrated to visual signals, and consequently did not modulate saccade latencies. This 21
multisensory effect is therefore either exclusive to audiovisual interactions, or requires a sensory 22
21
signal coming from another, non-visual, modality. To address this question, experiments E and F 1
investigated whether we could evidence multisensory interaction with tactile and audio-tactile 2
signals. 3
Experiment E – Touches & Saccades
4
We found that visual signals – whether salient or not – presented around target onset do not 5
produce the same temporal interaction resulting in saccade latencies modulation as auditory signals 6
do. In a new experiment, we replaced the auditory event (beep) with a brief tactile stimulation 7
(100Hz vibration for 10 ms) to investigate whether a similar multisensory integration effect could be 8
observed. Participants were asked to place their hands on the table at a comfortable distance. One 9
hand was placed on top of the other, and the tactile stimulation was delivered at the center of the 10
dorsal surface of the top hand by a solenoid tactor (Dancer Design). The tactor was held in place by 11
an adhesive ring and was controlled with Matlab. In order to avoid any possible biases induced by the 12
hand receiving the tactile stimulation, the left and right hand positions were alternated after each 13
block of 60 trials, hence stimulating alternately each hand. Closed headphones were used to prevent 14
the participant from hearing the noise produced by the tactile vibrations. Except for the tactile 15
stimulation and hand alternation, the experimental protocol was the same as for experiment A. 8 16
volunteers (5 women and 3 men) participated in this experiment, only one from the same initial pool. 17
They were between 22 and 42 years old (average 29.6) and all but one were right handed. 18
Results
19A total of 7520 out of 7680 recorded trials were analyzed (97.9%). Only 24 saccades going in 20
the wrong direction were not removed by the adaptive low-pass filter, showing that the majority of 21
anticipatory saccades were eliminated. Latency nscores were computed for each of the 36
22
combinations of hand touched × target direction × SOA, taking the No touch condition of each hand 23
touched × target direction as baselines. Saccade latencies did not differ when the tactile stimulation 24
was delivered to the left or to the right hand – no main effect (F(1,7)=0.26, p=0.63); and the hand 25
stimulated did not introduce a lateral bias for leftward or rightward saccades – no target direction × 26
hand touched interaction (F(1,7)=0.85, p=0.39). Consequently, latencies observed in the left and the 27
right hand conditions were pooled together for further analyses. Latency nscores were computed for
28
each of the 18 combinations of target direction × SOA, taking the No touch condition of each 29
direction baselines. The latency of leftward and rightward saccades did not differ – no main effect 30
(F(1,7)=1.53, p=0.26) nor interaction with SOA (F(8,56)=0.32, p=0.95). Consequently, leftward and 31
rightward saccades were pooled together for further analyses. Latency nscores were finally computed
22
for each of the 9 SOA conditions, taking the No touch condition as a baseline. Fig 6 summarizes the 1
results of experiment E, showing the effect of tactile stimulation on saccade latency (left panel) and 2
comparing it with the effect of beeps reported in experiment A (right panel). SOA had a significant 3
main effect on the nscores (F(8,56)=41.08, p<0.0001, ηp2=0.85). Single sample t-tests on the nscores
4
showed that saccade latencies were not reduced in the SOA=0 ms condition with synchronous tactile 5
stimulations (p=0.11), although across the SOA range tactile stimulation tended to reduce latencies 6
by 5.8 ms on average (p=0.044), compared to the No touch baseline. Further paired t-tests 7
comparing the SOA=0 ms with each other SOA condition, showed that latencies decreased when 8
touch was delivered before target onset (p<0.001 for SOA=−60 ms and below; and p=0.048 for 9
SOA=−30 ms) and increased when delivered after target onset (p=0.0082 and p<0.0002 for SOA=+30 10
and +60 ms respectively). 11
In order to compare with the results of experiment A, we computed the individual median 12
latency differences between each of the SOA condition and the No beep (experiment A) or No touch 13
(experiment E) baselines. We then performed unpaired Student t-tests to compare these latency 14
differences between experiments and found a very similar pattern of behavior, albeit shifted in time 15
by roughly 30 ms. The tactile modulation found in the synchronous condition would correspond to 16
the auditory modulation in the SOA=+30 ms condition. As a consequence, the warning effect with the 17
tactile stimulation is to be found in the SOA=-30 ms, which explains why the SOA=0 ms condition was 18
not different than the No touch baseline. 19