APPLICATION OF FULL WAVEFORM ACOUSTIC LOGGING DATA TO THE ESTIMATION OF RESERVOIR PERNEABILITY
by
Fred6ric Mathieu Ingenieur Civil des Mines
Ecole Nationale Superieure des Mines de Paris Paris, France
(1982)
SUBMITTED TO THE DEPARTMENT OF EARTH, ATMOSPHERIC, AND PLANETARY SCIENCES IN PARTIAL FULFILLMENT OF THE
REQUIREMENTS FOR THE DEGREE OF MASTER OF SCIENCE
in
Earth and Planetary Science at the
MASSACHUSETTS INSTITUTE OF TECHNOLOGY May, 1984
0 Massachusetts Institute of Technology
Signature of Author ... - ...
Department of Earth, Atmospheric, and Planetary Sciences May 11, 1984 Certified by .. ...---...-..--... M. Nafi Toksoz Thesis Advisor
-
'%4
Accepted by -.--....- - ---- r--.-.-. - - ----...- - - -1%.1G'f L!r~e
n Tieocore R. Madden Chairman Departmental Committee on Graduate StudentsAPPLICATION OF FULL WAVEFORM ACOUSTIC LOGGING DATA
TO THE ESTIMATION OF RESERVOIR PERMEABILITY
by
FREDERIC MATHIEU
Submitted to the department of Earth, Atmospheric and Planetary
Sciences on May , 1984 in partial fulfillment of the
requirements for the degree of Master of Science in Geophysics
ABSTRACT
Development of borehole geophysics has recently focused on reservoir
characterization. Within this effort, extensive full waveform acoustic surveys
have demonstrated a correlation between the occurrence of open fractures and
attenuation of Stoneley waves. A relationship is obtained here between
fracture permeability and attenuation of Stoneley waves, on the basis of a
physical mechanism. This mechanism involves an energy transfer under the
form of a fluid flow inside permeable formations. It is applied to the cases of a
single open fracture, a multiply-fractured medium and a homogeneous porous
medium. In each case a diffusion equation is used to describe the flow inside
the formation. Boundary conditions relate the different pressures in order to
obtain an expression for the attenuation. Theoretical results show the effects
of formation elastic parameters, fluid parameters, frequency, borehole radius,
permeability, fracture density, and porosity on attenuation. The single fracture
theory is applied to observed attenuation data due to isolated large open
fractures in crystalline formations: the theoretical fracture apertures obtained
compare favorably to values determined from packer tests.
Thesis Supervisor: M.N. Toksoz
ACKNOWLEDGENENTS
I am grateful to the scientists of the Earth Resources Laboratory who were of invaluable support throughout this research. I -am indebted "to my advisor, Professor M.N. Toksoz, for allowing me to study in :such a irich scientific environment as ERL. His efforts enabled me to take the best advantage of my stay. Within my research, his insights put me back on the right track many times. My gratitude goes to Wafik Beydoun 'for 'numerous theoretical discussions, for his valuable advice, and his continued support and friendship. I wish to thank F. Paillet, (now at U.S.G.S. in Denver) for the initial idea, and for subsequently placing field data at my disposal. Arthur Chengs support and interesting comments were helpful. I am grateful to Dominique Dubucq for his theoretical help. I owe a lot to Tim Keho who introduced me to the great computer facility of ERL, and to the secrets of Texas, particularly the big "L". Many thanks to Naida Buckingham, for kindly looking over my thesis.
I am greatly appreciative of the generosity of the company ELF AQUITAINE that supported me for the totality of my stay at M.I.T. Spec.ial thanks go to G. Henry who made this stay possible, and to P. Arditty, P. Staron, and G. Arens who strengthened my motivation, by allowing -me to participate in the development of the Full Waveform Acoustic Logging tool EVA despite the distance between Cambridge and Paris.
Last but not least, sincere thanks to all friends, at ERL and outside ERL, American, French, and from many other countries, who contributed to this unforgettable American experience.
This research was supported by the Full Waveftorm Acoustic Logging Consortium at the Earth Resources Laboratory. During this study I was supported as a graduate fellow by ELF AQUITAINE.
TABLE OF CONTENTS A B S T R A C T ... ... ... ... 2... 2 AC K N O W LE D ENTS ... DGKW ... ... 4 N O M E N C LAT U R E ... ... ... ... ... ... 7... 7 1 . IN T R O D U C T IO N ... ... ... 8... 8 2. THEORETICAL DEVELOPMENT ... 10... 10
2.1. Expression for the attenuation and discussion of the flow parameters ... 10
2 .2. B ou n d ary con dition s ... 13
2.2.1. Case of a single fracture ... 13
2.2.2. Case of a porous m edium ... 15
2.3. Fluid flow in the form ation ... 16
2.3.1. Diffusion equation for a single fracture ... 16
2.3.2. Diffusion equation for a densely fractured medium ... 17
2.3.3. Diffusion equation for a homogeneous porous medium ... 17
2.3.4. Solution of the diffusion equation ... 19
2.4. Sum m ary of theoretical results ... 19
3. NUMERICAL RESULTS ... 22
3.1. Attenuation dependence on formation elastic parameters ... 22
3.2. Attenuation dependence on fluid parameters ... 23
3.3. Attenuation dependence on frequency ... 24
3.4. Attenuation dependence on the borehole radius ... 24
3.5. Attenuation dependence on formation flow parameters ... 25
5. DISCUSSION AND CONCLUSIONS ... 30
APPENDIX A: Continuity equation for the fracture flow ... 32
APPENDIX B: Diffusion equation for a porous m edium ... 35
APPENDIX C: Im pedance calculations ... 36
REFERENCES ... 40 T A B L .E S ... 4 2 F IG U R E S ... 4 7
NOMENCIATURE
A attenuation of the Stoneley wave
AA amplitude attenuation
AE energy attenuation
b diffusion equation coefficient B,D constant coefficients
c Stoneley wave phase velocity
d fracture density
f
Stoneley wave horizontal wavenumberh width of a small layer in a porous medium H width of a fractured or porous medium IA modified Bessel function of the i-th order
k Stoneley wave vertical wavenumber
K conventional permeability
K11 intrinsic fracture permeability
L fracture width
La fracture aperture obtained from inversion of the attenuation LP fracture aperture obtained from packer tests
PD(r,t) fluid pressure distribution in the porous medium
PF(r,t) fluid pressure distribution in the fracture
P, incident Stoneley wave pressure in the borehole PR transmitted Stoneley wave pressure in the borehole
PT reflected Stoneley wave pressure in the borehole
qD(r,t) rate of fluid flow in the porous medium
qF(r ,t) rate of fluid flow in the fracture
g, rate of fluid flow in the borehole, associated with the incident Stoneley wave
gR rate of fluid flow in the borehole, associated with the reflected Stoneley wave
gr rate of fluid flow in the borehole, associated with the transmitted Stoneley wave
R borehole radius
SB borehole cross-section
SF fracture cross-section
T time period of the Stoneley wave
uk (r,t) vertical displacement of the Stoneley wave
VF fluid particle velocity in the fracture
og fluid particle velocity for the incident Stoneley wave
yR fluid particle velocity for the reflected Stoneley wave
VT fluid particle velocity for the transmitted Stoneley wave
v~f P-wave velocity in the fluid
ZB impedance of the borehole fluid flow
ZF impedance of the fracture fluid flow
Zp impedance of the fluid flow in the porous layer a attenuation coefficient in PT Pl=erp (-az)
formation compressibility fluid compressibility y dynamic fluid viscosity
porosity
Pf fluid density
1. IlTRODUCTION
Borehole geophysics is being increasingly applied to reservoir characterization. In particular, full waveform acoustic logging surveys seem to be of great interest in identifying fractured zones in a reservoir. Such a technique could be very helpful in determining quantitatively the total permeability of a fractured hydrocarbon reservoir in carbonate formations, since it can be related to fracture permeability (Stearns and Friedman, 1969). In addition, applications can be found in other areas, such as mapping ground water flow for various purposes (Davison et al., 1982).
Historically, Biot (1956) seems to be the first to relate the attenuation of waves propagating along a borehole surrounded by a porous formation, with the formation permeability. Rosenbaum (1974) applied his theory to the computation of synthetic seismograms. Previously, Bamber and Evans (1967) observed a correlation between fractures and anomalously porous zones on the one hand, and the attenuation of the wave train on the other hand. Staal and Robinson (1977) attempted successfully to test Robinson's theoretical calculations, and obtained good qualitative agreement between the attenuation of the Stoneley wave and the variable permeability of a porous medium.
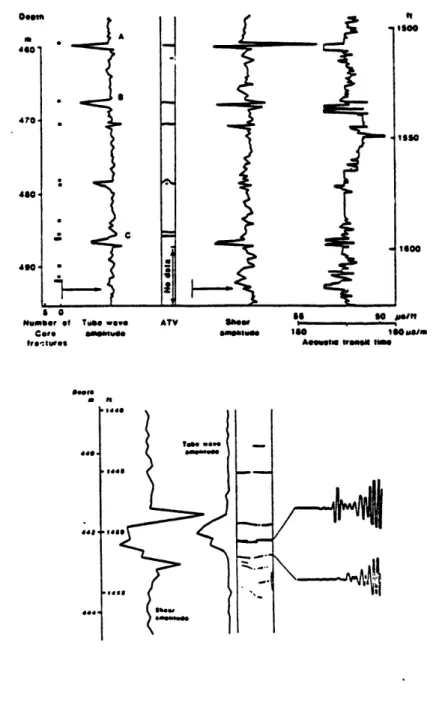
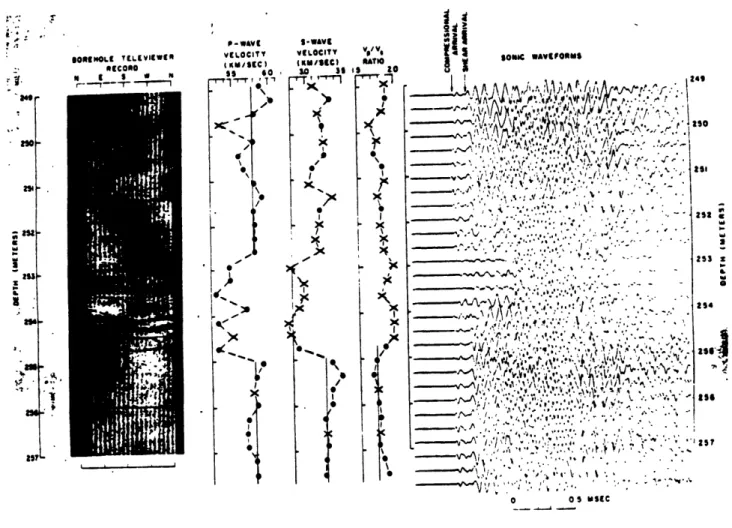
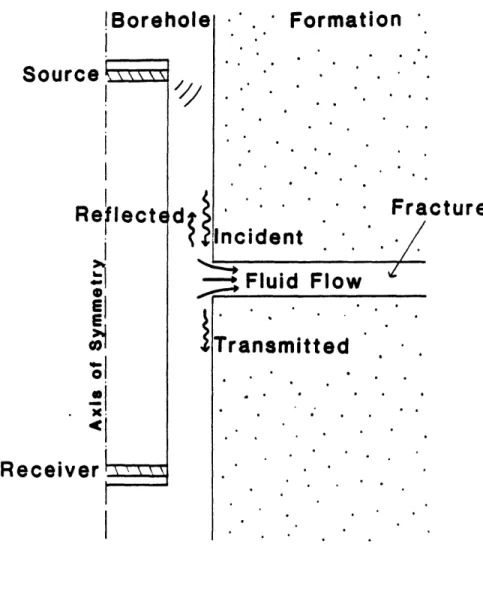
More recently, field experiments with full waveform acoustic logging tools showed a good correlation between fractures in crystalline formations and Stoneley wave attenuation in those formations. An extensive survey in two well sites of Manitoba, Canada, used full waveform logs, televiewer logs and hydrologic experiments to detect fractures in granite (Paillet, 1980; Davison et al., 1962). Figure 1 shows the correlation between fractures detected by a televiewer log and attenuation of the Stoneley waves at the corresponding depths. In Figure 2, we show iso-ofiset sections from ELF AQUITAINE's multi-offset tool E.V.A. In a portion of the formation where a hydro-fracturing experiment was conducted (Arens and Arditty, 1982), P and S waves are completely attenuated and Stoneley waves are partially attenuated. Finally, similar attenuation of
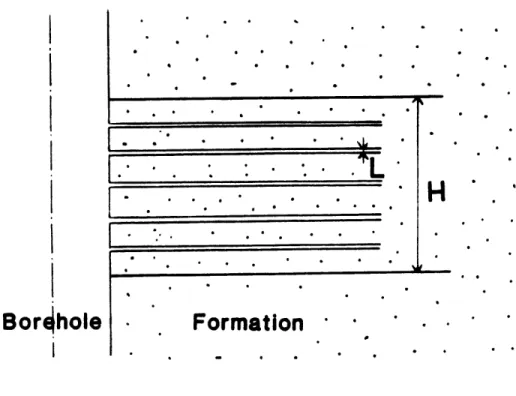
the whole wave train, including Stoneley waves, was correlated with the occurrence of fractures by means of a televiewer log (Figure 3), in the Hi Vista well drilled in granite in Southern California (Moos and Zoback, 1983).
In this study, a theoretical model is derived to relate the fracture permeability and the attenuation of Stoneley waves. The proposed mechanism attributes the Stoneley wave attenuation to fluid flow inside the formation and reflection at the fracture interface. The mechanism is first analyzed for an isolated fracture and then extended to a homogeneously fractured medium. A variation of the theory is then used to model Stoneley wave attenuation in a porous medium. Subsequently, the effects of the model parameters on the computed attenuation are discussed. Finally, theoretical fracture permeabilities are obtained from real data and compared to values obtained from packer tests in wells.
2. THEOREIICAL DEVELOPNENT
2.1 Expression for the attenuation and discussion of the flow parameters
The proposed mechanism for the attenuation of Stoneley waves involves the transfer of a part of the Stoneley wave energy to fluid flow in the permeable formation. Consider an incident Stoneley wave propagating along a borehole. The pressure variation in a borehole due to Stoneley waves is given by Cheng and Toksoz (1981).
P(r,z,t)
=
B Io(fr)ei(t*kz)
(1)with
f
= k2 (1- 2)(2)
where w is the angular frequency, c the phase velocity of the Stoneley wave, k
=W/
c the vertical wavenumber, vp1 the P-wave velocity in the fluid,f
the horizontal wavenumberand B a constant.
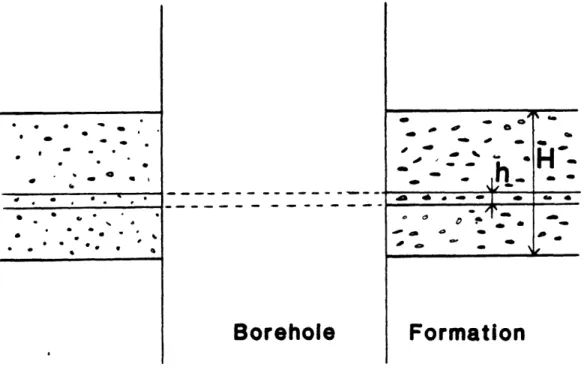
The z-dependence of the Stoneley wave is similar to that of a compressional plane wave traveling along the z-axis. The wave train consists of a succession of alternating compressions and dilatations. Each compression provokes a pressure buildup at the interface between the borehole and the formation. Therefore, when a compression phase encounters the permeable formation, be it a single isolated fracture (Figure 4), a series of fractures (Figure 5), or a more general porous medium (Figure 6), the pressure gradient at the interface forces the fluid to diffuse into the fracture (Figure 7). Thus, part of the Stoneley wave energy is lost, resulting in its attenuation. The effect of the Stoneley wave propagating within the formation can be ignored in the case of "hard" formations because most of the energy is in the fluid (Cheng et al., 1982).
The purpose of this theory is to derive a relationship between the formation flow parameters - porosity and permeability - and the attenuation of the incident Stoneley wave. This attenuation is defined by
PT
A
=1
- (3)P,
where PI and Pr are the incident and transmitted Stoneley waves, respectively. The transmission coefficient PT P, can be calculated in each case, using the appropriate boundary conditions.
In the energy transfer, due to the role of the fluid flow in the formation, it is natural to relate attenuation to the formation flow parameters. Basically, the purpose of this research is to obtain estimates of these parameters from the observation of Stoneley wave attenuation. To do so, the forward theory developed here aims to calculate attenuation, for a given'porosity and a given permeability. Three different formation models are investigated.
In the case of a single wide open fracture (Figure 8), the aperture L can be related to the intrinsic fracture permeability K11 by (Van Golf-Racht, 1982)
KS K L2 (4)
1 2
and to the conventional fracture permeability by
KSf = LS (5)
where H stands for the thickness of the matrix layer surrounding the fracture. In the case of equation (5), Darcy's law, underlying the permeability concept, will give us the flow rate inside the formation (considered as the system - impervious matrix + fracture). In the former case, the fracture is considered by itself. Both permeabilities
are expressed in darcys (m2) and should not be confused with hydraulic conductivity whose unit is meters/second (Brace, 1980). For a single fracture, the conventional fracture permeability should not be used to parameterize the attenuation of Stoneley waves, since the quantity H could merely characterize the tool and not the formation. Neither should the intrinsic fracture permeability be chosen as the flow parameter, since it is not commonly used. Therefore, for the case of a single fracture, attenuation is calculated as a function of the fracture width L.
In the case of a series of fractures, the formation layer containing the fractures is of significance, and conventional fracture permeability will parameterize attenuation. However, its relation to a single fracture's width changes, since several fractures are present. It is assumed that all fractures have the same width L and are evenly distributed with a density d in the fractured layer (Figure 5). Therefore, the permeability K in the layer is
K = d (6)
A more general porous medium (Figure 6) can be described by its permeability K and its porosity (. Here, the porosity is unrelated to permeability, contrary to the case of a fractured medium where the fracture density d implicitly plays the role of the porosity:
@ = L d (7)
where d is the fracture density of the fractured medium, L the width of a single fracture, and 4 the porosity of the medium. The porosity considered for the general porous medium is the interconnected porosity.
2.2. Boundary conditions
2.2.1. Case of a single fracture
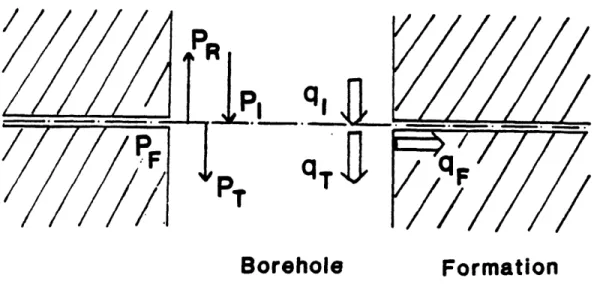
The different waves can be related by means of boundary conditions. The problem is analogous to that of a plane acoustic wave propagating in a duct, and attenuated by an absorptive strip (Young, 1953). One major assumption is that the inhomogeneity's width should be very much smaller than the wavelength of the incident wave. An open fracture in a crystalline rock or a carbonate formation is generally less than a few millimeters. On the other hand, assuming the borehole fluid is fresh water and the Stoneley wave frequency 10 kHz, its wavelength is 15 centimeters. Therefore, in this single fracture approach, the assumption is well verified. Due to the discontinuities at the edges of the fracture, the incident pressure wave P[ (Figure 9) is assumed to be scattered in the form of a reflected wave PR and a transmitted wave PT. As explained before, the attenuation mechanism involves a diffused flow, expressed by the fracture pressure PF. Since the fracture width L is small compared to the wavelength of the Stoneley wave, the reflected and transmitted waves can be considered as Stoneley waves of phase velocity c.
Pressure continuity in the borehole can be written
PI + PR = P)
We also assume that
PT(R) = PF(R) (9)
where PT(R) and PF(R) are the transmitted pressure and the fracture pressure at the borehole-fracture boundary (r=R).
Volume conservation relates the incident fluid flow across the borehole cross-section gI, the reflected flow qR, the transmitted flow q and the diffused flow into the
fracture qF(R)
q1= qR + qT + qF(R) (10)
All quantities are averaged over a half period of time TI 2 corresponding to a compressive phase of the Stoneley wave. The Stoneley wave pressure values PI, PR and
PT are averages over the borehole cross-section. Their common radial dependence is (Appendix C, Equation C.7)
Pj = Ii(f R) (11)
where Di is the constant coefficient for each case. PT and PT(R) are related by
PT(R)= fR 1
2 10(f R) Py (12)1(fR)
Equations (8), (9) and (10) actually involve only the unknowns PR!1/! P/PI and PF1 PI, as the concept of normal acoustic impedance relates flow rates to pressures. The normal acoustic impedance of a flow is
Z =<P> (13)
<V >
where < P > and < v > are respectively the averages of pressure and particle velocity over the flow cross-section. Applying this concept, equation (9) can be written
SBVI = SBVR + SBVT + SFVF (14)
in which
P, PR PT PF
where ZB and ZF are respectively the borehole and fracture impedances, and SB and SF the borehole and fracture cross-sections, velocities and pressures being averaged over those cross-sections.
The system of three equations can then be used in a straightforward way for all three normalized pressures. In particular, the transmission coefficient is
-T
=
(16)P1 1 +X with
X= (fR) Z (17)
2 1,(f R) ZF
Impedances can be calculated after obtaining the expression of the fracture pressure in part 2.3. This is done in Appendix C.
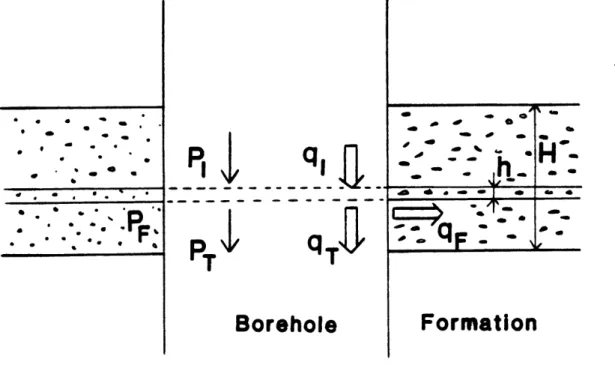
2.2.2. Case of a porous medium
Consider a porous medium of thickness H (Figure 10). Boundary conditions similar to the previous ones cannot be applied directly to the whole medium, since H can be as big or greater than the wave length of the Stonely wave. To overcome this difficulty, we will consider a layer of this porous medium, of thickness h, where h is larger than the size of a pore, but still small compared to the wave length of the Stoneley wave. It is reasonable to assume the absence of a reflected wave, as pores in a porous medium (such as porous sandstone) are smaller scale inhomogeneities than are fractures in a fractured medium. Pressure continuity at the borehole-formation interface is
PT(R) = PD(R) (18)
borehole-fracture boundary (r=R). Volume conservation relates the incident fluid flow q, the transmitted flow q, and the diffused flow into the porous medium qD(R)
q = q + qD(R) (19)
Introducing impedances as before, the two equations - two unknowns system can be solved to obtain the transmission coefficient for the thin layer
1 = 1 (20) P, 1 +X with 10(f R) ZB X =
f
h (D (fR) -- (21) I1 (f R) Zpwhere h is the width of the thin porous layer, D the porosity, Z the borehole impedance and Zp the porous layer impedance.
2.3. Fluid flow in the formation
2.3.1. Diffusion equation for a single fracture
Consider an isolated fracture modeled by a plane fluid layer perpendicular to the borehole (Figure 4). Under the assumption of a one-dimensional laminar flow, Darcy's law relates the fluid flow rate diffused inside the fracture qF(r,t) to the pressure gradient OPF(r,t)/Br as
qF(rt) - KL2r r PFrt) (22)
where K11 is the intrinsic fracture permeability, y the fluid viscosity and L the fracture
width. Assuming the fracture walls are rigid (i.e. L is a constant), the continuity equation relates aqF(r,t)/Or to aPF(r,t)/Ot as
OqF(rt) = -2Tr L OPF(,t)
(23)
Or 0
t
where y is the compressibility of the fluid (Appendix A). Combining (22), (23) and (4) yields the diffusion equation for a single fracture
1 af OPF(r,t)] 1 OPF(T,t)
r r Or b at
where
12
b -L 2 (25)
2.3.2. Diffusion equation for a densely fractured medium
In the case of a medium of fracture density d (Figure 5), the permeability K of the medium, the width L of a single fracture, and d are related by equation (6), and equation (22) changes in
q(rt) =- K OP F(t) (26)
y d Or
Equation (23) is still valid, and its combination with (26) and (6) yields the diffusion equation (24) where
1
Ld
12d"
= y K = y _ (27)
2.3.3. Diffusion equation for a homogeneous porous medium
In considering a porous layer of thickness h, permeability K, and porosity 4 (Figure 6), under the assumption of a radial laminar flow, Darcy's law relates the diffused flow
qD(r,t) = -- - - OPD(rt)
y Or
A rough approximation used to obtain the continuity equation is to write it as if the fluid were concentrated in a layer of thickness h't. Then, the continuity equation relates
OqD(r,t)/ Br to 6PD(r,t)/t as
OqD(r ,t )
OPD(r,
,t)
Or
=)
27r r h 4 - t (29)Combining equations (28) and (29) yields the diffusion equation for a porous layer
1 P(r,t)
1
1 OPD(r,t) (30)rT r
Or
~b
at
where
(31)
b K
A more rigorous approach (Appendix B) takes into account the matrix compressibility
P.
The coefficient 1/ b becomesy+
(32)
For a sample of Berea sandstone (Table 1; Simmons et al., 1982), the relative error in 1/ b, while using equation (31) instead of equation (32), is 30%. However, the compressibility effect on attenuation is so small (Section 3.2.) that the relative error in attenuation is reduced to 9.5%. Therefore, as a first approximation, equation (31) is chosen to calculate attenuation.
2.3.4. Solution of the diffusion equation
A compression phase of the Stoneley wave is defined as one positive half cycle of a sine wave. A rigorous approach would be to find the impulse response to the diffusion equation, which means finding the Green's function, and integrating over time. However, Figure (11) shows how this pressure function imposed at the fracture boundary is approximated by a boxcar function. A simple finite difference analysis shows that attenuations computed with this approximation are very close (less than 5% error) to what the actual sine dependence would have given. For such a boundary condition, the
solution of equation (24) near the borehole is (Rice and Cleary, 1976)
PC (r, t) PC erf c 4r (33) with
erf c (z) -( )dp )1 (34)
f-- exp (-p2)d
JX0
where Po=PF for a fracture and PO=PD for a layer of a porous medium.
2.4. Summary of theoretical results
Once impedances are calculated in Appendix C from equation (13), the transmission coefficient
T (35)
P[
1+ X
can be developed for the different approaches. For a single isolated fracture,
X
=
p f (f R) +L
(36) 24pe I1(f R) gR by bnFor a multiply-fractured medium, the flow parameter is the permeability K. In such a medium, the attenuation for a single fracture involves
X=pf Io(fR)
1
+r
K
2y 1
1(fR) 2R iT b d
(37)
where b is given by equation (27). For the total layer of thickness H (Figure 5), n=Hd is the number of fractures in this layer. The effect of the upgoing reflected waves on the boundary conditions is negligible in comparison to the downgoing incident wave, since the reflection coefficient of a single fracture is much smaller than 1. The transmission coefficient of the layer is
(
PTI
[PT) -- I = I--PrPPu f PIJ
As X< 1 for large densities, equation (38) can be approximated by
EL e -"
PI,
For a thin layer of width h in a porous medium (Figure 6)
(38) (39)
(40)
X = ah where a=pg of I 0(f R) _-+ y 1(fR) 2RThe layer being thin enough for the coefficient coefficient for that layer can be approximated by
K (41)
X to verify X<<1, the transmission
ST
-ah
PI &
where a is given by equation (19). Therefore, the total transmission coefficient for the
porous medium of thickness H is
e
-aH
(43)
3. NUMERICAL REULTS
The theoretical attenuations just derived depend on four subsets of parameters: formation and fluid parameters, frequency, borehole radius, and the flow parameters of the medium (permeability and porosity).
Since the purpose of the theory is to extract the flow parameters from the attenuation data, it would be rewarding to find that attenuation varies a lot with those flow parameters, and little with the other parameters. This section shows that attenuation is indeed very much dependent on permeability, while some other parameters have a strong influence too, and should be ascertained accurately prior to any permeability determination.
3.1. Attenuation dependence on formation elastic parameters
Formation parameters appear only through the period equation of the Stoneley wave (Cheng and Toksoz, 1981). They should have little effect on attenuation, since the Stoneley wave is only slightly dispersive. This can be checked in Figure 12. The plots show attenuation versus fracture width for different formation types using the single fracture model (Equation 36). The formation parameters used to generate the plots are listed in Table 2. The "hard" formation stands for hard, compact limestones whereas the "soft" formation represents uncompacted sediments such as ocean bottom sediments. Postponing the analysis of the fracture width effect on attenuation, it can indeed be seen that granite and "hard" formations yield very similar attenuations, for a given fracture width. The larger discrepancy between the results for "hard" and "soft" formations can be explained by the fact that the shear wave velocity of the "soft" formation is smaller than the fluid velocity. In such a case, the dispersion curve of the Stoneley wave behaves differently and its phase velocity is much less than its "hard" formation counterpart for a given frequency (Figure 13; Cheng et al., 1982). In any
case, fracturing is unlikely to occur in soft formations, and it should only be remembered that, for "hard" formations, the elastic parameter variations have little effect on attenuation.
3.2. Attenuation dependence on fluid parameters
The effect of different fluids on attenuation is a more delicate problem. It was assumed in the theory that the borehole fluid and the formation fluid were the same. This is in particular the case for crystalline formations where water reservoirs should not be contaminated. However, if the drilling fluid is mud and is not removed from the well, a mud cake builds up at the borehole-formation boundary. The characteristics of the mud cake depend on the mud composition. In the worst case it will impede any flow between the borehole and the formation. Rosenbaum (1974) introduced a variable impedance to account for the effect of the mud cake. It turns out, however, that he only considered cases of a sealed interface and a free flow, since there is no way to measure this variable impedance. In a way, this legitimates the free flow assumption made here.
Beside the assumption of a free flow, the fluid is still considered here to be the same in the borehole and in the formation, the latter being invaded in the vicinity of the borehole. Figure 14 shows the effect of different fluids on attenuation for the single fracture theory (Equation 34). Their parameters are listed in Table 3 (McGray and Cole, 1976). Compressibility variations have almost no effect on attenuation and this parameter is therefore held constant for the plots in Figure 14.- Attenuation increases slightly with increasing fluid velocity. Compared to the effect of the other parameters, its changes are not noticeable in the velocity range typical of most muds. Viscosity has an outstanding influence on attenuation. While all other parameters are similar, in fresh water, and two other fluids with common clay and Wyoming bentonite as additives, it is viscosity that separates the curves generated for each (Table 3). Figure 14 shows how increasing viscosity causes attenuation to decrease, from no additive (p=10-3 Poiseuille)
to common clay (p=10-2 Poiseuille) and Wyoming bentonite (p=3.10-e Poiseuille). This phenomenon can be explained by the fact that high viscosity reduces the flow. Therefore, less elastic energy can be transferred to the formation and the attenuation is smaller. The effect of different mud densities can be seen in a comparison between two muds of identical viscosities (Wyoming bentonite and barite), where one has a much higher density due to the addition of barite (Table 3). Figure 14 shows that attenuation increases with increasing densities. In conclusion, it must be stressed that, in order to make proper calculations, mud properties, and especially viscosity, have to be accurately measured.
3.3. Attenuation dependence on frequency
The usual frequencies of full waveform acoustic logging tools range between 1 and 40 kHz. For example, the peak frequency of Stoneley waves recorded by ELF AQUITAINE's tool E.V.A. is about 6 kHz, while that of the U.S.G.S. tool is 34 kHz. Figures
15-16 show that, for isolated fractures of different widths, attenuation increases slightly with increasing frequency. For porous media of different porosities (Figure 17),
attenuation increases with increasing frequency, and the rate of increase is greater for larger porosities. In all cases, the rather low dispersion implies that attenuation will be very similar over a fairly narrow frequency spectrum. Therefore, the best way to invert attenuation of a real signal for permeability is to calculate the theoretical attenuation for the central frequency of the Stoneley wave.
3.4. Attenuation dependence on the borehole radius
Variation in the borehole radius R affects attenuation in a much more drastic way. The phase velocity is only slightly affected by a change of R. However, the coefficients IO(fR)/Il(fR) and 1/2R in equations (36), (37) and (41) control the R dependence of attenuation. The predominant factor is 1/ 2R. Figure 18 shows that in boreholes with smaller radii the observed attenuations are greater. In crystalline formations, fractures
intersect the borehole rather cleanly and should not cause major changes in the borehole radius. However, fractures and anomalously porous areas in other formation types are the very zones where caves are likely to exist and the borehole radius is likely to change. Therefore, a good caliper log will be a prerequisite on which to base the theoretical calculations.
3.5. Attenuation dependence on formation flow parameters
The flow parameters of a medium are its permeability and its porosity. In the case of a single fracture, the fracture width characterizes the flow (Equation 4). Figure 22 shows how the attenuation increases with increasing fracture width, and how thin isolated fractures remain unnoticed on Stoneley wave attenuation data. Figures 19 and 20 plotted for the fractured medium and the porous medium show the same dependence on permeability. Moreover, they show how the attenuation depends on fracture density and porosity, respectively. A porous medium of greater porosity and greater permeability produces a greater attenuation (Figure 20). This result agrees with the observations of Bamber and Evans (1967) and Staal and Robinson (1977), and with the results of Rosenbaum (1974) based on Biot's theory (Biot, 1956). In the case of a fractured medium, it may not be obvious intuitively that, for a given permeability, many fractures of a lesser width produce more attenuation than fewer fractures of a greater width (Figure 19). However, this is evident from equation (37), where nX=hdX only involves d1 3 in the coe ffic ient 2/ ir(c/ b ).
In the case of a fractured medium, the relationship between porosity and permeability is implicit in the model of parallel plates (Figure 5, Equation 7). Since porosity is defined as an external parameter in the porous medium theory, an "a-priori" dependence on permeability is not assumed. However, the two parameters are generally dependent. The curves of Figure 20 are calculated without introducing any porosity-permeability relationship.
It would be gratifying to link the two approaches in a model applicable to both. The parallel plates model, as a specifically porous medium, may be such a model. However, the boundary conditions are different in that reflected waves are only considered in the fractured medium model, a porous medium being too smooth to generate them. Therefore, no comparison can be made at this point between the two approaches, and they should be tested separately on real data. According to the lithology porous sandstones are likely to adapt well to the porous medium theory, whereas carbonates or crystalline rocks with subhorizontal fractures will do better with the single fracture, or the fracture density theory.
4. COMPARISON OF THEORK'CAL RESULTS AND FIELD DATA
In this section, theoretical fracture apertures are calculated from observed attenuation data using the single fracture theory (Equation 34), and those estimates are compared with packer test results. Figure 1 showed good correlation between Stoneley wave attenuation and open fractures, as evidenced by a televiewer log. This subset of data belongs to a fairly exhaustive survey made in Manitoba, Canada for the purpose of nuclear waste storage in granite (Paillet, 1980; Davison et al., 1982). Hydrologic tests were used in addition to borehole geophysical logs. Some packer tests were carried out to determine in situ permeability in selected zones that straddle single, open fractures evidenced by cores and televiewer logs (Figure 21).
The Stoneley wave energy attenuation AE can be obtained simply. The Stoneley wave arrivals have large amplitudes. There is no geometric spreading. Waves show little dispersion (Cheng and Toksdz, 1981). Therefore, the portion of the waveform directly after the fluid arrival time is mostly the Stoneley wave. Paillet (1980) selected a time window of 150 ps to calculate the energy of the Stonely wave. Energy attenuation is the ratio of energy values between the attenuated wave and the undisturbed wave just above or just below the depth of the anomaly. It is transformed into an amplitude attenuation
AA by means of
AA = 1 -(1-AE]) (44)
Theoretical values for fracture widths are then obtained from the attenuation versus fracture width plot (Figure 22). Physical parameters required to model the attenuation from equation (34) are listed in Table 4. Spectral analysis (Paillet, 1980) yielded a central frequency of 34 kHz for the Stoneley wave. Attenuation is computed here on the basis of this frequency.
Similarly, fracture apertures were estimated from fluid-injection tests, using a
single fracture model (Davison
et
al., 1982). Results of the comparison between the two
estimates are listed in Table 5, including the relative deviation AL/L,
of the acoustic
estimate L. versus the packer test estimate L,.It is important to consider some limiting factors before interpreting the results. First, the depths of penetration of the flows are very dissimilar (10 to 100 meters in the case of fluid-injection tests, much less than 1 meter in the case of a diffused wave). Second, the nature of the flow is different (steady injection in the first case, high frequency steady-state flow in the second case), and permeabilities are unlikely to be the same for such different flow conditions.
Furthermore, in the theoretical developments, three simplifications were made: 1) there are no obstructions in the fractures to laminar flow (i.e., no turbulence, asperities or loose particles)
2) the 'return flow" from formation into borehole is small and does not contribute to the energy of the Stoneley waves
3) there is no diffraction (scattering) of acoustic energy into other wave modes
The first condition biases the theoretical results towards lower fracture densities for given permeabilities. However, it does not affect the overall permeability value for a given observed attenuation. The second condition implies that we assume the maximum attenuation for a given permeability. Thus theoretical permeability calculated from attenuation may be lower than the actual value. The third assumption means that we ignore attenuation of Stoneley waves due to elastic scattering (as shown in Figure 2) and attribute all attenuation to permeability. Thus we introduce a bias towards greater permeability.
Given these limitations, and given the t25% accuracy of the packer test measurements (Davison et al., 1982), the comparisons between packer test results and
computed permeability based on our theory are extremely good except for case 5 at depth 424 m and case 6 at depth 468 m (Table 5). These two discrepancies are most likely due to possible changes in fracture properties away from the borehole.
On the whole, however, Table 5 shows very good agreement between both approaches for obtaining in-situ permeability due to large fractures. The packer test might be more flexible for determining the permeability due to extended fractures, because of its larger and variable depth of penetration. On the other hand, a borehole survey gives fast results, and is relatively inexpensive. Therefore, permeability detection from acoustic surveys could add much value to the full waveform acoustic logging method.
5. DISCUSSION AND CONCLUSIONS
This theory involves fluid transfer from the borehole into the formation, driven by the Stoneley wave. Fluid flow into the formation results in the transfer of Stoneley wave energy into the formation and, therefore, in Stoneley wave attenuation. Although this energy transfer occurs only away from the borehole, the fluid flow can occur from the borehole into the formation, in the case of a compression phase of the Stoneley wave, as well as from the formation into the borehole in the case of a dilatation phase. We calculated attenuation only in the case of a compression phase, but the symmetry of the mechanism implies that the expression we obtained is valid in the opposite case and, thus, for the whole wave train.
In the case of a compression phase of the Stoneley wave, attenuation is higher when more fluid flows into the- formation. Therefore, attenuation increases with increasing permeability and porosity. Furthermore, increasing fluid viscosity implies less flow into the formation and decreasing attenuation. However, this last statement is only valid for relatively high viscosities. If it were not for viscous dissipation within the formation, unattenuated waves would be set up and the problem would become irresolvably complex. We implicitly assumed in the theory that dissipation was complete. In the real world, what remains from the flow in one direction interferes with the flow in the opposite direction (as we go from a compression phase of the Stoneley wave to a dilatation phase, for instance), thus reducing the global fluid flow. Theoretical results we calculated are therefore biased towards higher attenuations, or lower permeabilities when the fracture permeabilities are calculated from observed attenuations. Since there is good agreement in the comparison of theoretical estimates with field data where water is the fluid, it is probable that dissipation of the formation flow is almost complete in the great majority
Two other simplifications were made in the theoretical development. The first assumption states that flow is laminar in a fracture, and unobstructed by irregular fracture walls or loose particles within the fracture. This constraint also causes theoretical values to be biased towards higher attenuations, or lower permeabilities. The second assumption is to ignore the edge effects of the fracture intersection with the borehole. The theory assumes that there is no diffraction of acoustic energy into other wave modes and introduces a bias towards lower attenuation and greater permeability. Together, the different assumptions do not bias the results in a single direction. In this initial study, we did not determine quantitatively the errors introduced into permeability values.
We compared permeabilities derived from the Stoneley attenuations with independent measurements made in the borehole by "packer tests". Theoretical values obtained from attenuations compare very favorably with packer test results. Additional data may become available from some recent surveys for more comparisons. More theoretical work should be done to generalize the single fracture model, and to remove some of the assumptions. Furthermore, vertical fractures should be modeled since they may dominate in deep wells. Porous media, such as sandstones with intergranular porosity, could be modeled more accurately if a relationship between porosity and permeability is introduced. Finally, there is a great need of data in order to test the theory in cases of fractured reservoirs and porous reservoirs.
APPENDIX A CONTINUITY EQUATION FOR THE FRACTURE FLDW
Starting from the general conservation equation in fluid dynamics, we want to get the continuity equation for the special application of a plane horizontal fluid layer of width L:
--
-
=7.( p
(A.1)
a t
where p is the fluid density and V' is the particle velocity vector. Taking the cylindrical symmetry into account,
V.1(p) = - 6 prv (A.2)
r Or
Combining equations (A. 1) and (A.2),
_6p
B6pro _ 1_r p- + p r
( A.3)
0 t
r Or
r
Or
Or
Dividing each term by p,
l-op_ =.
rV2 +2-
(A.4)
p Ot
r Ip
Or
Or
Partial derivatives of density and partial derivatives of pressure can be related by means of the fluid coeffcient of compressibility y, usually simply called compressibility.
- = -- _V (A.5)
where V is the volume of an infinitesimal mass of fluid submitted to a pressure P, at constant temperature T. The conservation of mass is
d (pV) =0
Equation (A.6) can be expressed as
-dv = - dp
V p
There remains to relate volume and pressure by means of
dV= Ov
(OPPJ
dP(A.7)
(A.8)
since the temperature is constant. Combining equations (A.5), (A.7) and (A.8), pressure and density differentials are related by
(A.9)
dP = -- d p
7 p
Density and pressure are functions of radius and time:
P = P (r,t) = f ( p (r,t) )
(A.
10)
Therefore, and d p = -dr + a dt r a t d P = + a OPdr dt 0 r a t (A.11) (A.12)Combining (A.9) and (A.11), and identifying with (A.12),
aOP 1
O-Or yp Or
and
(A.13) (A.6)
a0P 1i (A.14) OT -p Ot
The flow rate q (r,t) in the fracture is
q = Sv = 2Tnr L v (A.15) where S is the fracture cylindrical cross-section at the radius r. Substituting equations
(A.13), (A.14) and (A.15) into equation (A.4), The continuity equation is obtained:
OP = - + 1 6 (A.16)
t r 2rL Or 2nL Or
It can also be written as
1
=
-2 7r L 7 r -g (A.17)Or Tt Or
Now, as q involves a partial derivative of the pressure with respect to r, infinitesimal quantities of the second order are negligible in comparison to infinitesimal quantities of the first order, and equation (A.17) can be simplified as
= -2 7r L Y r (A.18)
Or
at
This result can be reached, starting from the physical situation rather than from the general expression of the conservation equation (Beydoun et al., 1983).
APPENDIX B: DIFFUSION EQUATION FOR A POROUS MEDIUM
The pressure head can be substituted for the fracture pressure in the diffusion for a horizontal porous layer (Marsily, 1982), so that
1 a aPF(rt) E aPF(rt)
r !r
r
T
at
(B.
1)
with T= Kp 1Jg (B.2) and wheree
=
pf D g h 7
+
(B.3)
T is the porous layer transmissivity, h its width, @ its porosity and K its permeability, y the fluid viscosity, pf the fluid density, y the fluid compressibility, P the matrix compressibility and g the gravitational acceleration. Combining (B.1), (B.2) and (B.3), the diffusion equation becomes
1
0rOPF(T t)
.6PP(rt)
r Tr Or b at (B'4)
with
+ (B.5)
APPENDIX C: IMPEDANCE CALCULATIONS
The normal acoustic impedance of a flow is
< P >
Z = <v >(C1)where < P > and <v > are respectively the averages of pressure and particle velocity over the flow cross-section. Impedances are calculated for the vertical borehole flow opposite the fracture or the thin porous layer causing the attenuation, and for the radial flow into that fracture or thin porous layer.
Borehole impedance
To get both pressure and particle velocity averages over the borehole cross-section, one has to start with the expression of the Stoneley wave pressure inside the borehole (Cheng and Toksbz, 1961):
P(r,z,t) = B Io(fr) e"'(-A) (C.2)
with
f 2
=
k2 (1 C2 ) (C.3)Vf
where w is the frequency, c the phase velocity of the Stoneley wave, k
=W/
c the vertical wavenumber, vP! the P-wave velocity in the fluid, f the horizontal wavenumber and B a constant. The origin of the z-axis is located at the fracture or the porous layer depth, so that the z-dependence of the pressure cancels out. The pressure average over a half-period T/ 2, corresponding to a compression phase, iswhere D is a constant. The pressure average over the flow cross-section is
<P> = D Io(fr) 2rr dr (C.5)
Using the identity (Gradshteyn and Ryzhik, 1980)
f 1
0(u) u du=
uII(u)
(C.6)the pressure average becomes
= 2D
<>=-
11(f R) (C.7)The vertical particle velocity v (r,t) is obtained from the pressure P(r,t), noticing that, for the Stoneley wave (Cheng and Toksdz, 1981),
auk (r,t)
at (C.8)
where uk (rt) is the vertical component of the displacement, and
ikc
u' (rT,t) = - P(r,t)
Pir W
(C.9)
The velocity average over the fnow cross-section is therefore
(v>~~ .JRkD
<V>= f kD 10(fr) 2nTr dr
R 0 pf W (C.10)
Using the identity (C.6), it becomes
<v> - 2kD 11(fR)
Pf wf R
(C.11)Finally, taking into account the relation between phase velocity c, frequency W, and vertical wavenumber k
C = W(C.12)
k
the borehole impedance for the Stoneley wave flow is
ZB =pf c (C.13)
which is the normal acoustic impedance of a plane wave. This could be expected, since the vertical dependence of the Stoneley wave is precisely that of a plane wave.
Permeable formation impedance
The pressure expression in the formation is
PO(r,t) PC o erf c 4t(C. 14)
with
erf c (X) 1-
(2)
fexp
(-p
2) dp
(C.15)
where Po=PF for a fracture and PO=PD for a layer of a porous medium. The coefficient b is given for the different kinds of permeable formations by equations 25, 27 and 31. The pressure average at the borehole-formation boundary is simply P0 .
The particle velocity average is obtained by relating the velocity v (R) and the flow rate q (R) at the boundary, and deducing the flow rate from the pressure expression by means of Darcy's law. The velocity and flow rate are related by
q (R) = S v (R) (C.16)
where S is the fracture or porous layer cross-section. For a fracture of width L,
S = 2rRL (C.17)
S = 2nRh? (c.
The flow rate q (r,t) is obtained through Darcy's law (Equations 22, 26, 28) and it is time averaged over a half-period of the Stoneley wave TI 2, corresponding to a compression phase. The result is
q (R) = 27RPC Y + (C.19)
where Y=L/ 12 for a single fracture, Y=K/ d for a fractured medium, and Y=h for a porous layer of thickness h.
After combining equations (C.14), (C.15), (C.16), (C.17), (C.18) and (C.19), the impedance ZF for the fracture flow is such that
-1=
-
1-+
2[
(C.20)
ZF 12p 2R r b
where L is the fracture width. Expressed with the permeability K and the density d of a fractured medium, it becomes
ZF~1213
~
2
/
3
1-2K1
-1-=
1 _ 2/ _ + 2 (C.21)ZF a(1)1/3 d 2R r b For a porous medium of permeability K and porosity 4),
1- = _--_ + 2 L (C.22)
Z, p@ 2 R nT brI
REFERENCES
Arens, G., Arditty, P., 1982, Traitement et interpretation des diagraphies acoustiques EVA; Rapport Interne S.N.E.A.(P.).
Bamber, C.L. and Evans, J.R., 1967, D-k Log (Permeability Definition from Acoustic Amplitude and Porosity Logs): AIME, Midway USA Oil and Gas Sympos., paper no.
SPE 1971, Wichita, Kansas, November 9-10.
Beydoun, W.B., Cheng, C.H. and Toksdz, M.N., 1983, Detection of subsurface fractures and permeable zones by the analysis of tube waves: Annual report 1983, Full waveform acoustic consortium, Earth Resources Laboratory, Department of Earth and Planetary Sciences, M.I.T.
Biot, M.A., 1956, Theory of propagation of elastic waves in a fluid-saturated porous solid: J. Acoust. Soc. Am. , v.28, p.168-191.
Brace, W.F., 1980, Permeability of crystalline and Argillaceous Rocks, Int. J. Rock Mech. Mn. Sci. & Geomech., v.17, p.241-251.
Cheng, C.H. and Toksbz, M.N., 1981, Elastic wave propagation in a fluid-tilled borehole and synthetic acoustic logs: Geophysics, v.46,p.1042-1053.
Cheng, C.H., Toksbz, M.N. and Willis, M.E., 1982, Determination of in situ attenuation from full waveform acoustic logs: Jour. Geoph. Res., v.87,p.5477-5484.
Davison, C.C., Keys, W.S., Paillet, F.L., 1982, Use of borehole-geophysical logs and hydrologic tests to characterize crystalline rock for nuclear-waste storage, Whiteshell Nuclear Research Establishment, Manitoba, and Chalk River nuclear Laboratory, Ontario, Canada; Technical report, ONWI-418.
Gradshteyn, I.S. and Ryzhik, L.M., 1980, Table of Integrals, Series, and Products, Academic Press.
Marsily, G.de, 1981, Hydrogdologie quantitative; Masson, Paris.
McGray, A.W. and Cole, F.W., 1976, Oil well drilling technology; University of Oklahoma Press, Norman.
Moos, D. and Zoback, M.D., 1983, In situ studies of velocity in fractured crystalline rocks, Jour. Geoph. Res., v.88, p.2345-2358.
Paillet, F.L., 1980, Acoustic propagation in the vicinity of fractures which intersect a fluid-filled borehole: S.P.W.L.A., 21 Symp., DD.
Rice, J.R. and Cleary, M.P., 1976, Some basic stress diffusion solutions for fluid-saturated elastic porous media with compressible constituents: Rev. Geoph. Space Phys., v.14,No.2, p.227-241.
Rosenbaum, J.H., 1974, Synthetic microseismograms: Logging in porous formations; Geophysics, v.39,p.14-32.
Simmons, G, Wilkens, R, Caruso, L, Wissler, T, Miller, F, 1982, Physical properties and microstructures of a set of sandstones, An Annual Report to the Schlumberger-Doll Research Center, Department of Earth and Planetary Sciences, M.I.T.
Staal, J.J., and Robinson, J.D., 1977, Permeability profiles from acoustic logging: S.P.E. paper no. 6821 presented at the 52nd Ann. Fall Tech. Conf. and Exh. of the Soc. of Pet. Eng. of AIME, Denver, CO.
Stearns, D.W. and Friedman, M., 1969, Reservoirs in fractured rock, Am. Assoc. Petroleum Geologists, Memoirs 16,p.8 2-106.
Van Golf -Racht, T.D., 1982, Pundamentals of fractured reservoir engineering; Elsevier.
Young, J.E., 1953, Propagation of sound in attenuating ducts containing absorptive strips, Ph-D Thesis; M.I.T.
Table 1
P=0.5Kbar (Simmons et al., 1982) Berea sandstone parameters at
m/s m/s Kg/rm3 md compressional velocity shear velocity density incompressibility porosity permeability VP V8 p K =4080 =2580 =2128 =3.7 1010 =18
=76.6
Table 2
Formation parameters used in Figure 12
v,(m/s) v,(m/s) p(kg/mS)
granite 5500 3300 2700
"hard" 4500 2500 2300
Table 3
Fluid parameters used in Figure 14
Pf A 71
P-(kg/rm3) (Poiseuiles) (Pa) (m/s)
water 1000 10-3 2. 109 1500
common drilling mud 1160 10-2 2.1 09 1600
Wyoming bentonite 1045 3. 10-2 2. 10 1600
barite mud 1800 3. 10-2 2.
10
91800
Table 4
Physical parameters used to invert attenuation for fracture aperture.
Full waveform acoustic survey in granite (Paillet, 1980)
v,(m/s) v,(m/s) p(kg/m 3)
granite 5850 3350 2650
fluid 1500 0 1000
fluid viscosity y = 10-3 Poiseuille
fluid incompressibility 7-1
=
2. 109 PaTable 5
Fracture apertures comparison
for the full waveform acoustic and packer test approaches.
Depth(m) AE AA L.(Am) Lp(Am) AL/Lp(%)
1) 450. (WN1) 0.44 0.25 173. 197. -12. 2) 417. (WN1) 0.47 0.27 183. 265. -31. 3) 430. (WN1) 0.50 0.29 187. 126. +48. 4) 442. (WN1) 0.62 0.38 220. 188. +17. 5) 424. (WN1) 0.28 0.15 133. 18. +639. 6) 468. (WN4) 0.32 0.18 150. 46. +226.
FIGURE CAPTIONS
Figure 1: Correlation between fractures detected by a borehole televiewer (AM) and the attenuation of the Stoneley wave (tube wave)
(Paillet, 1980).
Figure 2: Full waveform acoustic data recorded after a hydrofracturing experiment (E.V.A.-Elf Aquitaine, 1982).
Figure 3: Correlation between fractures detected by a borehole televiewer and the attenuation of the complete wave train (Moos and Zoback, 1983).
Figure 4: Single fracture model.
Figure 5: Model for a multiply-fractured medium. Figure 6: Model for a porous medium
Figure 7: The attenuation mechanism in the case of a single fracture. Figure 8: Permeability definitions for a single fracture
Figure 9: Boundary conditions for the single fracture case. Figure 10: Boundary conditions for the porous medium case. Figure 11: Pressure approximation at the fracture boundary.
Figure 12: Effect of different formations on attenuation - Case of a single fracture. Formation parameters are listed in Table 2.
Figure 13: Dispersion curves for Stoneley waves in a hard formation (above), and a soft formation (below).
Figure 14: Effect of different fluids on attenuation - Case of a single fracture. Fluid parameters are listed in Table 3.
Figure 15: Frequency effect on attenuation - Case of a single fracture. Figure 16: Attenuation versus frequency - Case of a single fracture. Figure 17: Attenuation versus frequency - Case of a porous medium.
Figure 18: Borehole radius effect on attenuation - Case of a single fracture. Figure 19: Attenuation versus permeability -Case of a fractured zone. Figure 20: Attenuation versus permeability -Case of a porous zone.
Figure 21: Correlation between Stoneley wave attenuation and permeability estimates from packer tests (Paillet, 1980). Circles stand for the Stoneley wave attenuation (Tube wave deflection), from 0 to 100 %; Black dots stand for the permeability estimates from packer tests, on a normalized scale.
t600
460.
*C
1600
4- 0
Number of Tube wince ATV seow pn
,r.-tures AeesetSe tr8M te
9440
#dos