HAL Id: hal-02628634
https://hal.inrae.fr/hal-02628634
Submitted on 26 May 2020
HAL is a multi-disciplinary open access
archive for the deposit and dissemination of sci-entific research documents, whether they are pub-lished or not. The documents may come from
L’archive ouverte pluridisciplinaire HAL, est destinée au dépôt et à la diffusion de documents scientifiques de niveau recherche, publiés ou non, émanant des établissements d’enseignement et de
best friends or faux amis?
Myriam Carrère, Federica Demaria, Sophie Drogue
To cite this version:
Myriam Carrère, Federica Demaria, Sophie Drogue. Maximum residual levels of pesticides and pub-lic health: best friends or faux amis?. Agricultural Economics, Wiley, 2018, 49 (1), pp.111-118. �10.1111/agec.12399�. �hal-02628634�
Version postprint
This article has been accepted for publication and undergone full peer review but has not been Maximum Residual Levels of Pesticides and Public Health
Best Friends or Faux Amis?
Carrère Myriama, DeMaria Federicaa,b, Drogué Sophiea,1 aINRA, UMR MOISA, 2 place Pierre Viala, F-34060, Montpellier, France.
bDipartimento di Economia, Gestione, Società e Istituzioni, Università degli Studi del Molise, II
Edificio Polifunzionale, Via F. de Sanctis, snc, 86100 Campobasso, Italy.
Abstract: The purpose of this article is to analyse the relation between public health and the
regulations of Maximum Residue Limit (MRL) of pesticides. Many authors underline the role of trade protectionism in fixing these limits whereas these regulations should be intended for public health protection. We first establish the link between the MRL for a given chemical in plant products and its level of toxicity. In order to perform this analysis we cross the FAS USDA MRL database and the classification of the long term toxicological effects (LTE) for active substances provided by SAgE pesticide. We then compute a synthetic and polyvalent tool namely "Health Score" which provides a first overview of the link between LTE and MRL by country. Then this score is regressed in a logit model in order to identify the relationship between the countries' Health Score and the socio-economic and political characteristics of such areas. Results highlight the importance of public health expenditures in determining the settings of MRL towards stricter levels.
Keywords: food safety, pesticide residues, fruits and vegetables, scoring, logit model JEL codes: C51, I18, Q18
Received 30 Sept., 2015; received in revised form 08, Nov. 2016; accepted 26 Jan., 2017 Data Appendix Available Online
Version postprint
1. Introduction
According to Henson and Caswell (1999), food safety regulations are the outcome of a
complex trade-off between (…) consumers, food manufacturers, food retailers, farmers, (…)
the government itself and taxpayers. Concerning regulations on Maximum Residual Level
(MRL) of pesticides, it is widely recognized that they have been designed in order to protect the health of consumers and ensure that farmers adopt good practices. But even if an international regulation has been designed by the Codex Alimentarius (hereafter Codex), its application is not compulsory and nations keep their sovereignty in fixing these limits. Some countries appear as very severe while others, and particularly those deferring to the Codex, are considered as much laxer. This regulatory heterogeneity is at the core of a growing literature (Winchester et al., 2012; Drogué and Demaria 2012; Li and Beghin, 2014; etc.). These authors try to measure the differences in regulations by comparing the limits set by countries’ authorities. This literature generally tries to measure the trade impact of setting stricter MRL for a product or a group of products. It draws a picture of the trade-restrictiveness of MRL regulations around the world. National regulations are compared to the international regulation used as the reference point above which national standards may be considered as protectionist.
Recently, a new literature emerges to analyse the “formation” of the MRL. Referring to the model of Grossman and Helpman (1994), Foletti (2012) has opened the debate on
disentangling protectionism from health protection as drivers for MRL regulations inserting
the Acceptable Daily Intake (ADI) in its empirical analysis. Her analysis also includes the impact on human health of the various chemicals referenced in her database. She draws some results on the motivations of countries in setting their MRL which can be either set for health
Version postprint
protection or for trade protectionism. More recently Li, Xiong and Beghin (2014) propose a model which contributes to the understanding of the policy formation of food safety standard. These authors use a political support function approach to represent the decision of policy makers in setting the MRL and measure econometrically the level of trade protectionism induced by the MRL of pesticides and veterinary drugs. They introduce in their model economic, social and political variables and measure the weight of each other. They find that MRL regulations and tariffs are substitute trade protectionism tools and that, countries with
higher regulatory quality set tougher standards. For these authors MRL are the outcome of
the complex trade-off described by Henson and Caswell (1999). But claiming that MRL of pesticides are the results of a political compromise denies that they are set independently, based on sound science, and therefore suggest that they do not respond to legitimate social objectives. The WTO and particularly the SPS committee declares that SPS measures should
be based on (i) international standards as those of the Codex, (ii) science, including
assessment of risk, (iii) a temporary principle of precaution in the absence of international
standards or scientific evidence. Countries are free to set their own standards based on
science. As a consequence, each country can establish MRL independently on national
conditions and on the basis of agricultural practice. This means that for a given product, countries may regulate various substances. A pesticide authorized in a country may not be regulated or even prohibited in another one.
But how are the MRL actually established? According to the FAO, the MRL is the maximal concentration of a residue legally permitted or considered acceptable in or on a food product, a farm produce or a product intended for animal feeding. When a chemical is approved, studies on residues are made in order to determine the residue level which could remain in the product after harvest in the worst case (worst case scenario). For this purpose, the substance
Version postprint
studied is applied at the maximum of its recommendation for a given crop. During the field experiment a theoretical maximum daily intake (TMDI) is computed taking into account all the vegetables and animal products a human being can consume given his diet pattern ( ∑ ), being i, the product. This theoretical maximum daily intake is then compared to an admissible daily intake (ADI) which is the maximum quantity of a substance someone can consume during its lifetime without adverse effects. The MRL should be fixed such that:
Each country establishes a list of MRL and sometimes provides a default value for those pesticides that are not explicitly listed (see Table 1).
[Insert Table 1]
It seems thus, that MRL are efficient to protect human’s health. Despite this, consumers’ protection non-governmental organisations still claim for a reduction in the use of pesticides or even the ban of other ones and declare that the setting of MRL can be called into question. For instance, regularly the Pesticide Action Network (PAN) tries to alert the public opinion that current MRL would not be protective enough regarding consumers’ health (PANE, 2014).
In this article we try to investigate the strength of the relationship between the setting of MRL and their primary objective that should be the consumer’s health protection. We reconcile the link between MRL regulations and public health and investigate, more thoroughly, the social drivers of regulations on limits of pesticides residues. We restrict our analysis to plant products (i.e. fruits, vegetables, seeds, nuts, spices, tea, etc.). In order to perform this analysis we compute a synthetic and polyvalent tool hereafter Health Score (HS). This Health Score takes into account the level of long term toxicity of the regulated pesticides on consumer
Version postprint
health and ranks their MRL in order to establish if they are consistent with health protection (and have legitimate purpose) or if it is much laxer than the required level of protection it should provide.
We use the database on Maximum Residual Level of pesticide provided by the Federal Agricultural Service of the United State Department of Agriculture (FAS USDA MRL database http://www.fas.usda.gov/maximum-residue-limits-mrl-database). We cross the MRL with the classification of long term toxicological risk effects (hereafter Long Term Effects or LTE) provided by the Quebec Ministries of Agriculture, and Environment and the National Institute of Public Health of Quebec on the SAgE pesticides website (http://www.sagepesticides.qc.ca/Default.aspx). The information provided in this website was used to compute the Quebec Pesticide Risk Indicator (Samuel et al, 2012). The combination of these two sets of information provides an original database that establishes the link between long term toxicology and MRL by product and country. Intuitively these two variables should be negatively correlated, as a low LTE should imply a high MRL and
vice-versa. At first, we cross data on MRL and LTE and compute the HS in order to identify how
cautious a country is when it fixes the limits of pesticides residue that plant products should contain in order to be suitable for consumption. We cluster the HS to draw a world picture of consumers’ health protection. Then, we model the relation between the HS and certain variables that take into account not only socio-economic patterns but also political and health characteristics to understand the formation of this specific standard.
We analyse the link between pesticides MRL regulations and public health as this link has been somehow neglected in previous literature which mainly focus on the trade protectionism aspect of the MRL. The literature on political economy on food standards, particularly the works of Swinnen and Vandemoortele (2008, 2009 and 2011) provide our analysis for
Version postprint
theoretical foundations. Following these authors a standard should be the result of a social optimum which is determined by comparing the gains and losses of both producers and consumers. The determinants can be summarized from the supply side by the difference between the prices and the costs of compliance and from the demand side by the difference between the price and the “consumption effect” which is the benefit for a consumer to consume pesticide-free goods. But given the existence of conflicting interests they model the standards as the results of a political optimum by introducing in the analysis the weight of the lobbies and the taxpayers. Our analysis addresses two issues: (i) are the MRL of pesticides driven by legitimate precautionary motives? (ii) What is the role of these objectives (proxied by public health expenditures) in the setting of the MRL? We deal with the first issue by trying to give a measure of the “precautionary MRL” via the computation of a Health Score; the second issue is addressed thanks to an econometric modelization of the relation between this score and selected variables to understand the role of certain determinants (and particularly public health) in its formation. The results show that public health expenditures play a stronger role in the setting of stricter MRL for hazardous substances than the level of income.
This article is structured as follows. Section 2 presents the motivation of the analysis performed in this article. Section 3 describes the data and the clustering approach we implemented. The model is specified in Section 4 and results are developed in Section 5. Section 6 is devoted to the discussion of the results and conclusion.
2. Building a Health Score
At first we draw our analysis using information on MRL and on LTE which include three different dimensions: countries, products and substances. For more clarity, we will use
Version postprint
hereafter the term “product” to designate the plant products and the word “substance” to designate the chemicals. Information on the level of MRL is from the FAS USDA international MRL database which provides the level of pesticides and veterinary drug for 661 plant and animal products commodities, 90 markets (the European Union constitutes one market) and 352 pesticides. The database does not include processed food products. Our analysis focuses only on plant products (fruits, vegetables, cereals, etc.); meat, fish and dairies are not considered.
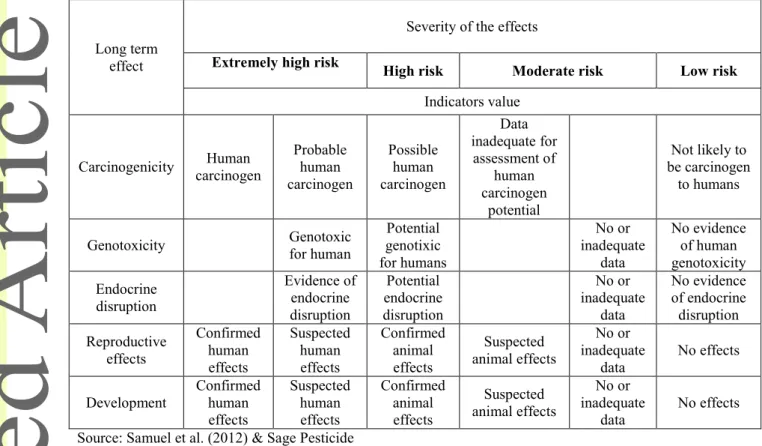
The toxicity of the pesticides is captured through the Long Term Effects provided by the SAgE pesticides website maintained by the government of Quebec (Canada). This website describes for a list of 441 substances their impacts on health and on environment. The impacts on human health are disaggregated in acute toxicity and long term toxicity. Long term toxicity of a substance is graded according to its risk level (extremely high, high, moderate and low, see Table 2 and Table A1 in Appendix).
[Insert Table 2]
The intuition is that the MRL of a given substance should vary inversely with the level of its toxicity. Here, we are mainly interested in the chronic toxicity (or long term effect) which affects the consumer (acute toxicity affects above all the producers). We can summarize this proposition in the following way: a low LTE should be associated with a high MRL for a harmless substance while a high LTE should be associated with a low MRL for a hazardous substance. Thus we can grade the substances listed by the SAgE pesticides by level of toxicity. We attribute a grade of 1 if the substance has a low level of risk, to 4 if the risk for human health is extremely high. Then we match the list of substances contained in the FAS database with the corresponding one in the SAgE pesticides database. This merging led us to
Version postprint
keep a list of 252 substances, 116 countries (for the need of the estimation we disaggregated the EU in 27 countries) and 585 plant products.
Combining LTE and MRL allows the performance of a score analysis to classify countries regarding their sensitivity to health concerns. In some way we measure the level of precaution of countries with respect to human food exposure to pesticides and we can rank countries depending on their precautionary status.
Before computing the HS we study the distribution of MRL (see Table A2 in Appendix). The MRL range between 0.0005 and 1500 mg/kg with a kurtosis equal to 535.5. The peak of the distribution is around zero. To get an accurate overview of the sample we first focus on the values of the MRL ranging between 0 and 500, and then on the values between 0 and 50; and subsequently between 0 and 10 to finally zoom in on the MRL between 0 and 1 which are the most frequent values. As far as the MLR values above 500 are marginal (they represent 0.004% of the observations), the kurtosis is still high; in the second we lose 1.1% of the observations and the kurtosis is still high; in the third one, we lose 5.14% of observations and finally in the fourth 21%.
Looking at the distribution of MRL for LTE equal to 3 or 4 (see Figures A1 to A3 in Appendix), we define 7 classes of scoring for each triplet country (c)/product (p)/substance (s) based on the following rule of decision:
HScps= 7 if LTE =1 or 2 and 0 ≤MRL≤1500 HScps= 6 if LTE =3 or 4 and 0 ≤MRL<0.02 HScps= 5 if LTE =3 or 4 and 0.02 ≤MRL<0.05 HScps= 4 if LTE =3 or 4 and 0.05 ≤MRL<0.1 HScps= 3 if LTE =3 or 4 and 0.1 ≤MRL<1 HScps= 2 if LTE =3 or 4 and 1 ≤MRL<10
Version postprint
HScps= 1 if LTE =3 or 4 and 10≤MRL≤1500
Table 3 summarizes the distribution of the HScps=7
[Insert Table 3]
Then, we calculate the score by country as follows: ∑ ∑
where c denotes the countries, p denotes the product, s the substance; P.S is the number of products and substances pairs. The denominator is multiplied by 7 to take into account the number of classes for each product and substance pair. Due to its formalization, the HSc is
lower and upper bounded between 0 and 1. This score should be interpreted as a precaution level index. The higher the score, the more a country is concerned with human dietary exposure to pesticides in food. A score equal to 1 means that the country has ruled out all pesticides which LTE is high or extremly high.
We observe that whatever a given MRL the HScps is decreasing with LTE for a given pair of
product/substance. Reciprocally, the HScps is decreasing or constant with MRL whatever the
level of LTE. This index allows us to rank countries combining the level of the toxicity of a substance and the enforced regulation. Our previous considerations about the monotonicity along the LTE (respectiveley MRL) are transmitted to the HSc at the country level. As a
matter of fact, the HSc can be considered as a mean of the HScsp for a specific country. Thus,
if almost all the substances regulated by a country displayed a high LTE, it would correspond to an over representation of low HScps, which sum would tend to remain low (and vice-versa).
Version postprint
Finally, the HSc is invariant to the number of the regulations by averaging the sum of HScps
by the total number of products and substances pairs. In other words, even changing the number of products or substances referenced by a given country, the computation of the HSc
does not change.
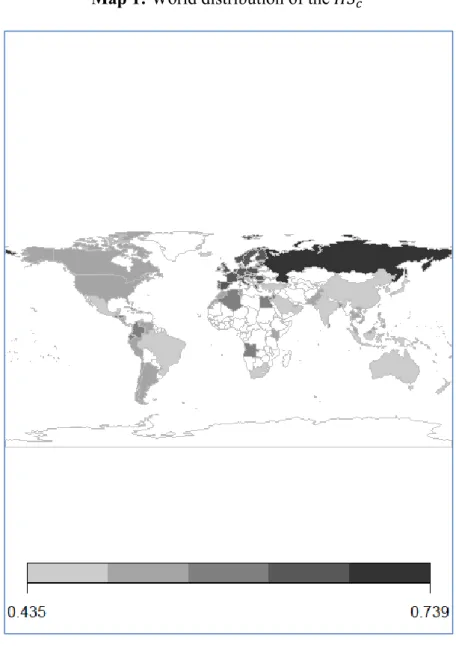
This score ranges between 0.43 and 0.74 (see Map 1, Figure A4 and Table A3 in Appendix). For instance, a country with a score equal to 0.74 can be considered as more cautious than another with a score equal to 0.43. Globally the score is not very high (between 0.4 and 0.7). But when we cluster it some rough observations can be made.
[Insert Map 1]
The lowest scores appear for countries referring to the rules of the Gulf Cooperation Council. Then, come two groups of countries where we find China, New Zealand, Mexico, India, Australia, Brazil and the USA, among the main actors on the world agricultural markets. The fourth group gathers the countries which defer to the Codex. Finally, the European Union and Russia close the series. It seems that for the chemicals explicitely listed (we do not take into account missing MRL), those with the highest toxicological effects are not those with the more stringent limits.
3. The model
In order to establish the determinants of the HSc we complete our analysis with an
econometric estimation accounting for legitimate public health objectives. Following Swinnen and Vandemoortele (2008, 2009 and 2011), we consider the HSc as the level of
standard s. They consider two levels of standards: s# corresponds to the social optimum resulting from the maximization of a welfare function and s* is the political optimum, a result of the maximization of the same welfare function taking the lobbies influence into account. s*
Version postprint
is driven by a trade-off between social, economic and political interests while s# is driven by legitimate social objectives.
We are interested in econometrically investigating the relationship between certain determinants (and particularly public health) and the variation of the Health Score. Today, the Codex is considered as the reference by many countries. But we observe in our data that countries which adopt more restrictive standards than the Codex have a HSc greater than the
countries which follow the Codex. Moreover as underlined by Josling and al. (2004), page 43: the SPS agreement has politicized decision making within the Codex more than in other
standards organizations.2 Thus we suppose that standards higher than the Codex's HS
(hereafter HSCodex) tend to be more influenced by public health considerations than the others.
Countries with a HSc > HSCodex may be considered as countries which standards are more
driven by precautionary legitimate motives than countries with a HSc ≤ HSCodex. We thus take
the HSCodex as the threshold (denoted ̅ ). We define a binary variable ̃ to discriminate
against these two classes in order to understand what drives the HSc beyond the reference
level defined by the Codex (HScodex).
For this purpose we use a logit model by re-defining the dependent variable as follows: {̃ ̃ ̅
̅
Let y the observed dependent variable and the latent variable satisfying the single index model
(1) Even if is not observed, we do observe
Version postprint
{ (2)
In their model Swinnen and Vandermoortele (2009) considered that the level of a food safety standard is driven on the supply side by the producers’ cost of compliance, and on the demand side by the consumers’ preferences, their perception bias (also called consumption effect) and the externality effect (also called warm glow effect). For the authors public food safety standards do not induce any warm glow effect (Swinnen and Vandermoortele, 2009; page 515) thus we do not include it in our empirical analysis. Increasing the stringency of a food safety standard is a cost for both domestic and foreign producers, consequently the impact will depend on the relative competitiveness of both industries. Concerning the consumers, increasing the stringency of the standard, the cost for the consumer increases but it increases its utility because it guarantees a safer product particularly if consumers trust in the capacity of the government to enforce the standard. We test some of these indicators on the standard setting. Our empirical model is written as follows:
̃
On the demand side Lngdp_capc is the logarithm of the gross domestic product (GDP) per
capita of country c. It takes the level of consumption into account. Corruptionc is the World
Bank’s Control of Corruption indicator. It captures perceptions of the extent to which public
power is exercised for private gain, including both petty and grand forms of corruption, as
well as "capture" of the state by elites and private interests. Following Onyango et al. (2007)
Version postprint
the consumer’s perception of food safety, thus this variable accounts for the perceived risk probability. Both indicators come from the World Bank Development Indicators (WBDI) database.
On the supply side, The RCA_Vegc is the revealed comparative advantage of Balassa for
vegetable products which accounts for the competitiveness of the domestic industry.
MFN_vegc is the weighted average most-favoured-nation tariff rate for agricultural products.
Both indicators have been retrieved from the World Bank World Integrated Trade Solution (WITS) database.
We also add two variables which may explain the formation of stringent/loose standards and have an impact on the cost for both consumers and producers. Lnpubhexpc is the logarithm of
public health expenditures in percentage of GDP. Public expenditure consists in the recurrent
and capital spending from (central and local) government budgets, external borrowings and
grants and social (or compulsory) health insurance funds. We suppose that countries with
high percentage of public health expenditures will be more inclined to set stringent standards. This indicator comes from the World Health Organization National Health Account database. On the contrary, following Besley and Kudamastsu (2006) whose results suggest that there is a positive link between health and democracy, we suppose that countries with a lower level of democracy are less able to set and enforce stricter standards. In order to test this relation, we add the Autocracy score from the Polity IV Projects (www.systemicpeace.org/polity/polity4.htm) which measures the degree of a government authority. Where “autocracy” defines the political systems whose common properties are a
lack of regularized political competition and concern for political freedoms. It ranges from 0
(weak autocracy) to 10 (strong autocracy). We transform this variable in a binary variable.
Version postprint
MLR variables are measured for 2010; all other variables are for 2011 (except when they were not available in this case the closest values were substituted).
4. Results
Our model includes economic, social and political factors that may influence the ̃. This section presents the results from the specification of a logit regression3 (see Table 4).
[Insert Table 4]
The model is consistent in the sense that the impacts of most regressors are statistically significantly different form zero but Lngdp_cap and Corruption. The confusion matrix gives the performance of the model in the classification of the observations. Looking at the confusion matrix (see Table 5) we can tell that this model fits quite well regarding the sample size in terms of its overall and correct classification rates. It also correctly predicts more than 86% of the countries positioning. The confusion matrix highlights also that the model performs better (88%) the negative predicted values (that is to say, countries with the lower score) than the others (81%). These slightly unbalanced predictive performances can be imputed to the fact that there are more countries which score is lower or equal than the Codex (corresponding to 2/3 of the sample).
[Insert Table 5]
In the estimation, the coefficient of Lngdp_cap, the economic dimension of the countries is positive but not significant. However, the coefficient of Lnpubhexp, the share of public health expenditures is positive and significant. This model highlights also the non-neutrality of the political regime as the lack of democratic institutions (Autoc_bin) has a negative and significant coefficient. The perception of the quality of institutions by consumers
Version postprint
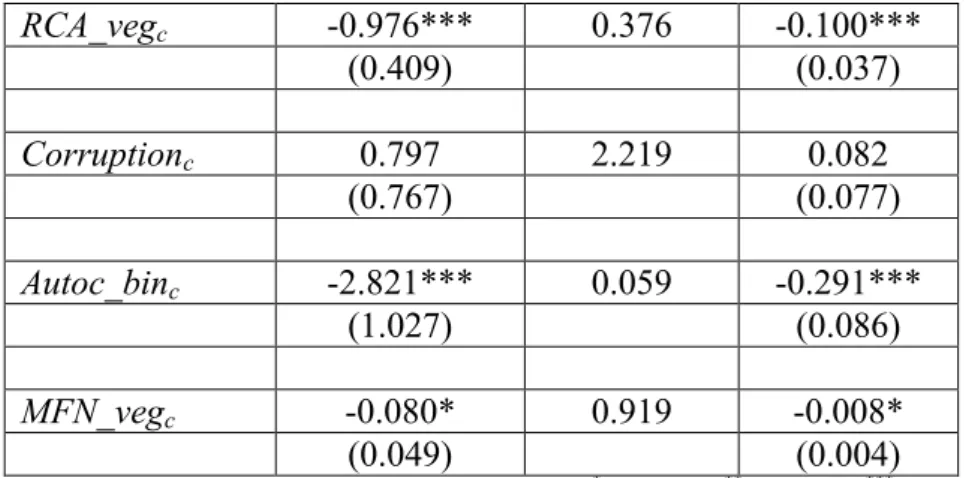
(Corruption) is positive but not significant. Concerning the remaining variables, the coefficient of RCA_veg is negative and significant which means that countries less competitive tend to set stricter standards. And the coefficient of MFN_veg is also negative and significant meaning that countries with higher tariff rates have less restrictive standards. In order to quantify the impact of each variables involved in the model, we compute the odds ratio and marginal effects (see Table 4). The odds ratios give information on the multiplicative effect of the variation, for a unit change, on the probability for the dependent variable to switch from zero to one. That is to say, odds ratios specify the determinants (independent variables) which make a country move from the group of countries less concerned with pesticide exposure to the group of countries more concerned with pesticides exposure.
The marginal effects measure discrete change for categorical variables while they measure the instantaneous rate of change for continuous variables; when all other variables are at mean. But interpreting the marginal effects is only straightforward for categorical variable because they change for each level of the independent variable, thus we will mainly focus on the interpretation of the odds ratios.
Focusing on odds ratios, a 1 percentage point increase in the share of public health expenditures (Lnpubhexp) increases by 69% the odds of setting a stringent standard, all other variables being constant. On the contrary, if Autoc_bin switch from 1 to 0 the odds of ̃ diminish by 94%. Finally, countries more competitive tend to resort less on the stringency of MRL and a unit increase in RCA_veg decreases by 62% the odds of a precautionary standard, in a similar way countries with higher MFN import duty rates are less likely to set stricter MRL (-8%).
Version postprint
Our analysis highlights some factors involved in the formation of MRL of pesticides. We first compute a Health Score reconciling data on MRL and data on chronic toxicity for several chemicals. Then we transform this score in a binary variable in order to test with a logistic model the relation between this score and some economic, social and political variables. We are interested in analysing the factors that drive the setting of MRL for substances with the highest long term toxicological impacts on human health and thus the level of health protection a nation wants to achieve. We want to know first if standards on MRL are driven by precautionary legitimate objectives or if it is the outcome of a political trade-off and what influences their divergence. In contrast with other research (particularly the work of Li and al; 2014) we find no statistical evidence on a positive link between the Health Score and the level of income or the consumer’s risk perception but with the importance of public health expenditures. The results show here that it is not the absolute wealth of a nation that influences the level of health protection but rather the share of its wealth devoted to health. If the perception by consumers of the quality of the institutions does not matter (Corruption is not significant), the political regime matters, in the sense that a restriction in the openness and competitiveness in executive recruitment and participation diminishes the chance to set stricter standards. Finally, in line with other works, economic factors also matter. The competitiveness of the domestic industry limits the stringency in standards (the odds of setting stricter standards decreases by 62% when RCA_veg increases) while freeing trade has instead a positive impact on it (+8%).
We underline here, the important role of public health in the setting of MRL. These results are interesting as they show that at a same level of wealth, population, democracy, a 1 unit increase in the share of public health expenses in GDP multiplies the probability of setting stricter MRL regulations by 69%. These results are not fully consistent with the recent
Version postprint
outcomes of the literature dealing with this issue. Li, Xiong and Beghin (2014) show that in higher per capita income countries, consumers’ economic and socio-demographic characteristics are the main drivers of MRL. We shed light on the fact that public health expenditures also matter in limiting the residue of highly hazardous substances. Those authors measure the absolute stringency of the MRL while adding the level of toxicology (via the LTE), we provide a measure of their relative stringency. We are thus able to determine the way countries arbitrate between the level of the regulation and the health impact of pesticides.
6. Acknowledgements
We thank Mr. Onil Samuel from IRPEQ for giving us access to the data used in the preliminary version of this article. We thank the participants of the 29th International Conference of Agricultural Economics in Milan, for their useful comments and suggestions. We especially thank the co-editor Dr. Ashok Mishra and three anonymous referees for their outstanding comments and suggestions.
7. References
Drogué, S., DeMaria, F., 2012. Pesticide residue and trade, the Apple of Discord. Food Pol. 37, 641–649.
Folletti, L., 2012. Sanitary and phytosanitary measures: health protection or protectionism? Paper presented at the European Trade Study Group 14th Annual Conference, Leuven, Belgium, September 13-15.
Grossman, G.M., Helpman., E., 1994. Protection for sale. Am. Econ. Rev. 844, 833–50, September.
Henson, S., Caswell, J., 1999. Food safety regulation: an overview of contemporary issues. Food Pol. 24, 589–603.
Version postprint
Josling, T.E., Roberts, D., Orden, D., 2004. Food regulation and trade: toward a safe and open global system. Peterson Institute Press: All Books.
Li, Y., Beghin, J.C., 2014. Protectionism indices for non-tariff measures: an application to maximum residue levels. Food Pol. 45(C), 57–68.
Li, Y., Xiong, B., Beghin, J.C., 2014. The political economy of food standard determination: international evidence from maximum residue limits. Iowa State University Department of Economics Working Paper No.13011.
Onyango, B., Miljkovic, D., Hallman, W., Nganje, W., Coundry, S., and Cuite, C., 2007. Food Recalls and Food Safety Perceptions: The September 2006 Spinach Recall Case. North Dakota State University, Department of Agribusiness and Applied Economics Report No. 602, Fargo, ND.
PANE, 2014. Missed and dismissed. Pesticides regulators ignore the legal obligation to use independent science for deriving safe exposure levels. Report of the Pesticide Action Network Europe.
Samuel, O., Dion, S., St-Laurent, L., April, M.-H., 2012. Indicateur de risque des pesticides du Québec – IRPeQ – Santé et Environnement 2nd edition [on-line] Québec : ministère de l’Agriculture, des Pêcheries et de l’Alimentation/ministère du Développement durable, de l’Environnement et des Parcs/Institut national de santé publique du Québec, 44p.
Swinnen, J.F.M., Vandemoortele, T., 2008 The political economy of nutrition and health standards in food markets. Appl. Econ. Perspect. and Pol. 30(3), 460–468.
Swinnen, J.F.M., Vandemoortele, T., 2009. Are food safety standards different from other food standards? A political economy perspective. Eur. Rev. Agric. Econ. 36(4), 507–523. Swinnen, J.F.M., Vandemoortele, T., 2011. Trade and the political economy of food
Version postprint
Wilson, J., Otsuki, T., 2004. To spray or not to spray: Pesticides, Banana exports, and food safety. Food Pol. 29(2), 131–146.
Winchester, N., Rau, M.-L., Goetz, C., Larue, B., Otsuki, T., Shutes, K., Wieck, C., Lee Burnquist, H., Pinto de Souza, M.J., Nunes de Faria., R., 2012. The impact of regulatory heterogeneity on agri-food trade. World Econ. (special issue) 35, 973–993.
8. Tables and figures
Table 1: List of countries in the analysis and MRL regulation rules
Rule Countries
Countries set their
own standards Argentina, Australia, Brazil, Canada, Chile, China, India, Indonesia, Israel, Japan, Korea, Russia, Singapore, South Africa, Taiwan, Thailand, Turkey, New Zealand, Vietnam, United Arab Emirates, Malaysia, Switzerland
Countries defer to Codex
Algeria, Angola, Barbados, Bermuda, Bahamas, Bangladesh, Colombia, Costa Rica, Cuba, Dominican Republic, Ecuador, Egypt, El Salvador, Guatemala, Hong Kong, Honduras, Jordan, Kenya, Lebanon, Morocco, Netherlands Antilles, Nicaragua, Pakistan, Panama, Peru, Philippines, Trinidad and Tobago, Tunisia, Venezuela
Countries defer to EU standards
Belgium, Denmark, Finland, French Pacific Islands, France, French West Indies, Germany, Greece, Ireland, Italy, Jamaica, Netherland, Norway, Poland, Portland, Spanish, Sweden, United Kingdom
Countries defer to Gulf Cooperation Council standards
Bahrain, Kuwait, Saudi Arabia, Oman, Qatar
Countries defer to exporting countries standards
Albania, Antigua and Barbuda, Cayman Island, Haiti, St. Kitts and Nevis, Sri Lanka, St. Lucia
Countries defer to US
Version postprint
Table 2: Long term effect of active ingredients
Long term effect
Severity of the effects
Extremely high risk High risk Moderate risk Low risk
Indicators value
Carcinogenicity carcinogen Human Probable human carcinogen Possible human carcinogen Data inadequate for assessment of human carcinogen potential Not likely to be carcinogen to humans
Genotoxicity Genotoxic for human genotixic Potential for humans No or inadequate data No evidence of human genotoxicity Endocrine disruption Evidence of endocrine disruption Potential endocrine disruption No or inadequate data No evidence of endocrine disruption Reproductive effects Confirmed human effects Suspected human effects Confirmed animal effects Suspected animal effects No or inadequate data No effects
Development Confirmed human effects Suspected human effects Confirmed animal effects Suspected animal effects No or inadequate data No effects
Source: Samuel et al. (2012) & Sage Pesticide
http://www.sagepesticides.qc.ca/Infos/SignificationSymbole.aspx#link-TraitementSanteTableau1
Table 3: Distribution of HScps=7
HScps Freq. Percent Cum.
1 210,856 25.85 25.85 2 19,533 2.39 28.24 3 29,695 3.64 31.88 4 7,543 0.92 32.8 5 25,578 3.14 35.94 6 15,805 1.94 37.88 7 506,804 62.12 100 Total 815,814 100
Version postprint
Map 1: World distribution of the
Table 4: Estimations results
Coefficients Odds-ratios Marginal effects ̃
Lngdp_capc 0.006 1.006 0.0006
(0.602) (0.062)
Lnpubhexc 1.688* 5.413 0.174*
Version postprint RCA_vegc -0.976*** 0.376 -0.100*** (0.409) (0.037) Corruptionc 0.797 2.219 0.082 (0.767) (0.077) Autoc_binc -2.821*** 0.059 -0.291*** (1.027) (0.086) MFN_vegc -0.080* 0.919 -0.008* (0.049) (0.004)
Standard errors in parentheses; significant at level: * p < 0.10, ** p < 0.05, ***p< 0.01
Table 5: Confusion matrix
True Classified D ~D Total + - 22 7 53 5 27 60 Total 29 58 87 Classified + if predicted Pr(D) ≥ .5 True D defined as HSc ≠ 0 Sensitivity Specificity
Positive predicted value Negative predictive value False + rate for true ~D False – rate for true D False + rate for classified + False – rate for classified -
Pr(+│D) 75.86% Pr(-│~D) 91.38% Pr(D│+) 81.48% Pr(~D│-) 88.33% Pr(+│~D) 8.62% Pr(-│D) 24.14% Pr(~D│+) 18.52% Pr(D│-) 11.67% Correctly Classified 86.21%