HAL Id: hal-03234925
https://hal.umontpellier.fr/hal-03234925
Submitted on 25 May 2021
HAL is a multi-disciplinary open access archive for the deposit and dissemination of sci-entific research documents, whether they are pub-lished or not. The documents may come from teaching and research institutions in France or abroad, or from public or private research centers.
L’archive ouverte pluridisciplinaire HAL, est destinée au dépôt et à la diffusion de documents scientifiques de niveau recherche, publiés ou non, émanant des établissements d’enseignement et de recherche français ou étrangers, des laboratoires publics ou privés.
comparative study of bioclimatic definitions using two
climatic data sets
Jonathan Pando Ocón, Thomas Ibanez, Janet Franklin, Stephanie Pau,
Gunnar Keppel, Gonzalo Rivas-Torres, Michael Edward Shin, Thomas
Gillespie
To cite this version:
Jonathan Pando Ocón, Thomas Ibanez, Janet Franklin, Stephanie Pau, Gunnar Keppel, et al.. Global tropical dry forest extent and cover: A comparative study of bioclimatic definitions using two cli-matic data sets. PLoS ONE, Public Library of Science, 2021, 16 (5), pp.e0252063. �10.1371/jour-nal.pone.0252063�. �hal-03234925�
RESEARCH ARTICLE
Global tropical dry forest extent and cover: A
comparative study of bioclimatic definitions
using two climatic data sets
Jonathan Pando Oco´ nID1☯*, Thomas IbanezID2☯, Janet FranklinID3‡, Stephanie Pau4‡, Gunnar Keppel5‡, Gonzalo Rivas-Torres6,7,8, Michael Edward Shin1, Thomas
Welch Gillespie1☯
1 Department of Geography, University of California Los Angeles, Los Angeles, CA, United States of
America, 2 AMAP, CIRAD, CNRS, INRAE, IRD, Univ Montpellier, Montpellier, France, 3 Department of Botany and Plant Sciences, University of California Riverside, Riverside, CA, United States of America,
4 Department of Geography, Florida State University, Tallahassee, FL, United States of America, 5 UniSA
STEM and Future Industries Institute, University of South Australia, Adelaide, Australia, 6 Colegio de Ciencias Biolo´gicas y Ambientales, Universidad San Francisco de Quito, Quito, Ecuador, 7 Wildlife Ecology and Conservation, University of Florida, Gainesville, FL, United States of America, 8 Instituto de Geografı´a, Universidad San Francisco de Quito, Quito, Ecuador
☯These authors contributed equally to this work. ‡ These authors also contributed equally to this work.
*jonocon@g.ucla.edu
Abstract
There is a debate concerning the definition and extent of tropical dry forest biome and vegeta-tion type at a global spatial scale. We identify the potential extent of the tropical dry forest biome based on bioclimatic definitions and climatic data sets to improve global estimates of distribution, cover, and change. We compared four bioclimatic definitions of the tropical dry forest biome–Murphy and Lugo, Food and Agriculture Organization (FAO), DryFlor, aridity index–using two climatic data sets: WorldClim and Climatologies at High-resolution for the Earth’s Land Surface Areas (CHELSA). We then compared each of the eight unique combina-tions of bioclimatic definicombina-tions and climatic data sets using 540 field plots identified as tropical dry forest from a literature search and evaluated the accuracy of World Wildlife Fund tropical and subtropical dry broadleaf forest ecoregions. We used the definition and climate data that most closely matched field data to calculate forest cover in 2000 and change from 2001 to 2020. Globally, there was low agreement (<58%) between bioclimatic definitions and WWF ecoregions and only 40% of field plots fell within these ecoregions. FAO using CHELSA had the highest agreement with field plots (81%) and was not correlated with the biome extent. Using the FAO definition with CHELSA climatic data set, we estimate 4,931,414 km2of closed canopy (�40% forest cover) tropical dry forest in 2000 and 4,369,695 km2in 2020 with a gross loss of 561,719 km2(11.4%) from 2001 to 2020. Tropical dry forest biome extent varies significantly based on bioclimatic definition used, with nearly half of all tropical dry forest vege-tation missed when using ecoregion boundaries alone, especially in Africa. Using site-specific field validation, we find that the FAO definition using CHELSA provides an accurate, standard, and repeatable way to assess tropical dry forest cover and change at a global scale.
a1111111111 a1111111111 a1111111111 a1111111111 a1111111111 OPEN ACCESS
Citation: Oco´n JP, Ibanez T, Franklin J, Pau S, Keppel G, Rivas-Torres G, et al. (2021) Global tropical dry forest extent and cover: A comparative study of bioclimatic definitions using two climatic data sets. PLoS ONE 16(5): e0252063.https://doi. org/10.1371/journal.pone.0252063
Editor: RunGuo Zang, Chinese Academy of Forestry, CHINA
Received: December 1, 2020 Accepted: May 9, 2021 Published: May 20, 2021
Peer Review History: PLOS recognizes the benefits of transparency in the peer review process; therefore, we enable the publication of all of the content of peer review and author responses alongside final, published articles. The editorial history of this article is available here:
https://doi.org/10.1371/journal.pone.0252063
Copyright:© 2021 Oco´n et al. This is an open access article distributed under the terms of the
Creative Commons Attribution License, which permits unrestricted use, distribution, and reproduction in any medium, provided the original author and source are credited.
Data Availability Statement: All relevant data are within the manuscript and itsSupporting Informationfiles.
Introduction
Tropical dry forest has been estimated to comprise 42% of all tropical forests and is believed to be one of the world’s most endangered biomes [1–3]. Tropical dry forests provide the ecosys-tem services needed to support millions of subsistence farmers in some of the world’s poorest areas, and higher population densities are driving the demand for energy and land leading to higher tropical deforestation rates in dry forest than humid forest [4,5]. Additionally, tropical dry forests harbor unique and diverse ecological communities and their deforestation contrib-utes to the steady erosion of Earth’s biodiversity [6–8]. To protect this critically endangered and valuable resource, we need reliable estimates on the extent of the tropical dry forest biome and understand the degree of uncertainty around those estimates.
Terrestrial biomes have long been associated with climatic range limits [9,10]. These foun-dational early descriptions of global biome patterns are complemented by a growing under-standing of the relationship between climate and vegetation form and function [11–14]. Recent advances in global climate data sets are improving our understanding of the extent and distribution of biomes. WorldClim, the most widely used climate dataset in biogeography, provides global, gridded climate data at up to 1 km resolution interpolated from a network of weather stations [15], while the Climatologies at High-resolution for the Earth’s Land Surface Areas (CHELSA) offer 1 km resolution climate data based on a quasi-mechanistically statistical downscaling of global circulation models [16]. Furthermore, global data sets for estimated potential evapotranspiration (PET) can now map aridity indices at 1 km resolution [17,18].
Bioclimatic definitions are useful for estimating biome extent and forest cover at different spatial scales and to predict the dominant vegetation without the influence of humans or dis-turbances such as fire [14,19]. However, bioclimatic definitions cannot differentiate between vegetation types, such as savannas, shrublands, woodlands, and deciduous to evergreen forests, whose climatic limits overlap [14,20–22]. Thus, climatic definitions allow delimiting the potential extent of biomes, but not detailed mapping of vegetation type boundaries.
There have also been significant advances in spaceborne remote sensing of forest cover [23–
26]. Forest cover for the first two decades of the 21stcentury can be mapped globally based on for-est cover change data sets that contain forfor-est cover and percent forfor-est cover at a 30 m resolution from Landsat imagery for 2000 to 2020 [27]. Such global forest cover products can be used to eval-uate the extent and change of forest cover within the climatic boundaries of different biomes and forest types, providing crucial information for conservation and land use planning [28,29].
There has been a growing number of efforts to map forest extent and forest cover change in tropical dry forest regions, especially to identify dry forest regions with a high conservation priority at a global spatial scale [4,8,23,29,30]. Most biogeographical studies and conserva-tion evaluaconserva-tions of tropical dry forest biomes at a global spatial scale use World Wildlife Fund (WWF) terrestrial ecoregions to establish the potential extent of this biome [3,23,27,31,32]. Currently, the WWF has defined 53 tropical and subtropical dry broadleaf forest ecoregions.
Previous global analyses of tropical dry forest cover have, however, also shown that the tropical dry forest vegetation type (e.g. canopy height � 3 m, closed canopy � 40%, drought-adapted species) has been misidentified within 500 m pixels as tropical and subtropical grass-lands, savanna and shrubland, woodland and scrub; and desert and xeric shrubland ecoregions [23]. Thus, more precise knowledge of the extent and location of tropical dry forest biome is needed in order to track forest cover change and better understand threats (deforestation, fire, climate change) and the conservation status (endangered species, old growth, protected areas) of this tropical forest biome.
The range boundaries of the tropical dry forest biome should coincide with climatic thresh-olds related to temperature, mean annual rainfall, seasonality, and water deficit [17,20,33].
Funding: JPO received the 2019 Geospatial @ UCLA Summer Fellowship which helped fund this research. URL:https://gis.ucla.edu/. The funders had no role in study design, data collection and analysis, decision to publish, or preparation of the manuscript.
Competing interests: The authors have declared that no competing interests exist.
However, there are several bioclimatic definitions of tropical dry forest that can be used to assess the global extent of this biome independently from WWF ecoregion data [1,8,17,30,
34]. Widespread consensus on the bioclimatic parameters defining the tropical dry forest biome extent is yet to be established [35] and no studies compare the predicted global or regional extent of the forest biome based on different definitions of bioclimatic suitability [5].
There are a number of ways to validate and refine bioclimatic assessments of the tropical dry forest biome. Results can be compared to local vegetation maps [33,36], high resolution (< 1 m) remote sensing imagery [17], and field inventories or georeferenced specimens [8,33,
36]. Field plots, however, offer the most robust approach to validating bioclimatic models because they provide high resolution data on location, species composition, and structure over a standardize area [37]. Furthermore, field ecologists are often familiar with a site’s natural his-tory and have identified the vegetation and function as a tropical dry forest. Global studies of plant and forest diversity [38] and structure [31] now contain over 100 field plots from tropical dry forests, although certain regions may be underrepresented.
This study has three objectives related to the global extent of the tropical dry forest biome and vegetation type. First, we compare the extent of tropical dry forest predicted by four biocli-matic definitions (Murphy and Lugo, Food and Agriculture Organization, DryFlor, aridity index) for the biome using two different climatic datasets (WorldClim and CHELSA) and compare these to widely-used WWF ecoregions. We would expect that there should be high agreement (e.g. 70%) between individual bioclimatic definitions and WWF ecoregions regard-less of climate datasets used. Second, we identify if WWF ecoregions or bioclimatic definitions have the highest agreement with field plots defined as tropical dry forest. We would expect that there is high agreement among WWF ecoregions, bioclimatic definitions, and field plots. Third, we use the best definition to calculate tropical dry forest vegetation cover and change from 2000 to 2020. Global tropical dry forest cover estimates should be similar to other pub-lished global estimates.
Materials and methods
Climatic definitions of tropical dry forest
We computed the bioclimate envelope (or the potential extent) of tropical dry forest located between 30˚N and 30˚S using four different definitions (Table 1). For all these definitions, we first subsetted frost-free areas (> 0˚C) using minimum temperature of coldest month with mean annual temperature > 17˚C [1]. We defined tropical dry forest biome according to the four bioclimatic definitions by subsetting areas of relevant climate variables according to the thresholds or ranges (Table 1), and then overlaid (intersected) those subsetted areas to delimit where all climatic criteria co-occur.
Table 1. Overview of bioclimatic definitions (Murphy and Lugo, Food and Agriculture Organization of the United Nations [FAO], DryFlor, Aridity Index) of the tropical dry forest biome.
Bioclimatic Definition Source Annual Precipitation, Dry Season Murphy and Lugo Murphy and Lugo 1986 250–2000 mm, 4–7 months �100 mm FAO Sunderland et al. 2015 500–1500 mm, 5–8 months �100 mm DryFlor Banda et al. 2016 �1800 mm, 3–6 months �100 mm Aridity Index� Bastin et al. 2017 0.2 < aridity index < 0.65 �Calculated by taking the ratio of mean annual precipitation to potential evapotranspiration.
Climate data sets
We used two different climatologies to compute the potential extent of tropical dry forest biome, WorldClim [15,https://www.worldclim.org/] and CHELSA [16,http://chelsa-climate. org/]. Both climatologies have a spatial resolution of 30 arc seconds, or ~1 km, but differ in the way they were computed. We used the 2nd version of the WorldClim climatology, released in 2017. This climatology was derived from weather station measurements (1970–2000) interpo-lated using thin-plate splines with covariates including elevation, distance to the coast and three satellite-derived covariates: maximum and minimum land surface temperature as well as cloud cover, obtained with the MODIS satellite platform [15]. Trabucco and Zomer (2019) provided aridity index and PET computed using the WorldClim climatology [18,https:// cgiarcsi.community/2019/01/24/global-aridity-index-and-potential-evapotranspiration-climate-database-v2/]. The second climatology, CHELSA, was derived from a quasi-mechanis-tically statistical downscaling of the ERA interim global circulation model with a GPCC bias correction [16]. This climatology is based on averaged climatic condition between 1979–2013. CHELSA incorporates topoclimate (e.g., orographic rainfall and wind fields), which is highly relevant for islands. We used the ENVIronmental Rasters for Ecological Modeling R-package [39] to compute the PET and aridity index using the CHELSA climatology.
WWF ecoregions
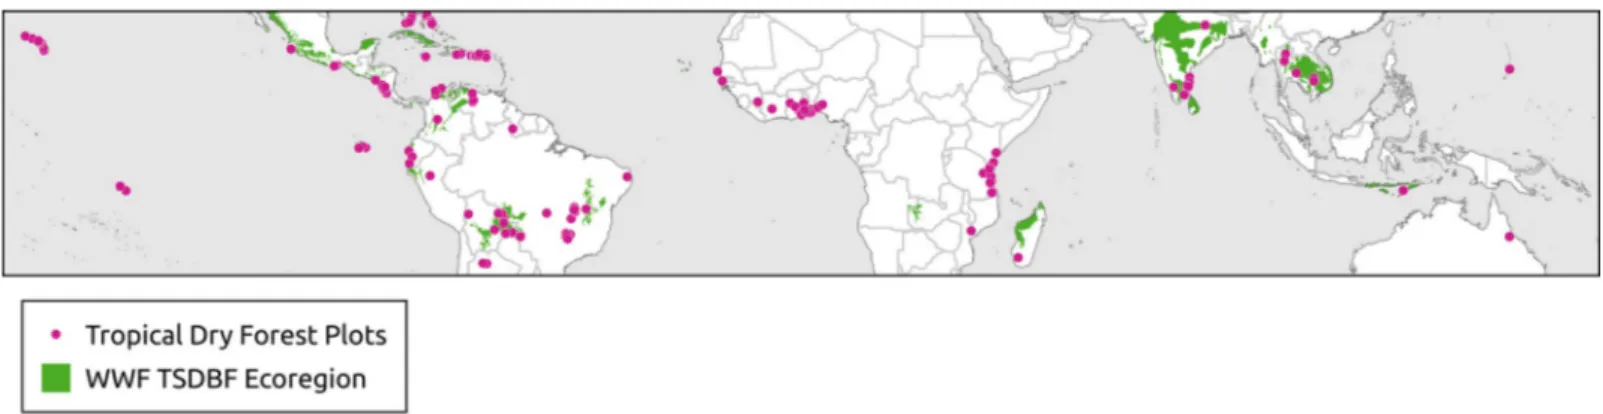
The WWF ecoregions are polygon shapefiles that included 867 land units classified into 14 dif-ferent ecoregions [40]. Each represents large units of land or water containing a geographically distinct assemblage of species, natural communities, and environmental conditions [40]. WWF has identified 53 ecoregions that fall within the Tropical and Subtropical Dry Broadleaf Forest category (Fig 1) (S1 Appendix).
Field data sets
Biodiversity data, including vegetation plots, are valuable for addressing macro-ecological questions about community patterns and processes [41,42], as well as global conservation problems in the global change era [43]. We tested the occurrence of the tropical dry forest biome based on bioclimatic definitions against 540 verified locations of tropical dry forest veg-etation compiled from two primary sources (Fig 1). First, we searched Web of Science (v.5.32), Scopus, and Google Scholar databases for peer-reviewed articles published between January 1990 and September 2019. We queried titles, abstracts, and keywords for the following terms: tropical�dry�forest�plots�. We selected the peer-reviewed articles based on three criteria:
Fig 1. Distribution of 540 tropical dry forest plots and the World Wildlife Fund’s tropical and subtropical dry broadleaf forest ecoregion.
1) plots classified as dry forest (closed-canopy) following author’s classifications, and not savannas, woodlands (open-canopy), riparian or flooded forests, 2) articles needed to include published latitude and longitude of the plot location to within 1 km, and 3) forest had to be composed of drought tolerant tree species native to the region. Second, we searched four global forest data repositories for sites classified as tropical dry forest. Our search using the Global Biodiversity Information Facility, as well asForestPlots.net, yielded much of the same plot data we had collected from our list of peer-reviewed studies. The Dryad data repository, how-ever, yielded 40 additional dry forest plots from three peer-reviewed studies of dry forest across Latin America [44–46]. Additionally, we collected 150 sites from the United States Geological Survey’s Forest Inventory and Analysis program covering tropical dry forest from the United States and territories (Hawai’i, Puerto Rico and US Virgin Islands). We used Google Earth to verify the coordinates were within areas with closed canopy forest and to establish seasonality using built-in, time-lapse imagery collected since 1984 across varying seasons. These plot loca-tions were used to determine whether the tropical dry forest bioclimatic definiloca-tions accurately capture observed locations of the tropical dry forest vegetation type (S2 Appendix).
Global forest cover and change
Originally developed to provide high-resolution global maps of forest cover change from 2000 to 2012 using Landsat 7 imagery, the Global Forest Change data set has grown to include time series analysis of Landsat 5, 7 and Landsat 8 imagery now covering forest cover and forest loss from 2000 to 2020 [18]. Each pixel has a spatial resolution of 1 arc second, or roughly 30 m. We calculate mean, minimum, and maximum percent canopy cover over each field plot at 1 km resolution to provide estimates of tropical dry forest cover and variability across the land-scape in 2000 (S2 Appendix). Within the bioclimatic envelope of tropical dry forest biome that best matched the field plots, we identified forest areas as areas with a forest cover � 40% [17,
23] for the year 2000, 2001 and 2020, and calculated forest cover change between 2001 and 2020.
Data analyses
Spatial coverage. We divided global results into six regions (Africa, North and Central America, South America, South Asia, and South East Asia and Pacific). We further sub-divided regions using biodiversity hotspots [47,48] (S4 Appendix) and countries [49] (S5 Appendix).
Bioclimatic potential for tropical dry forest. We used geospatial analysis tools to com-pile spatial data and develop binary raster maps (dry forest, non-dry forest) by applying the four bioclimatic definition of dry forest. Free and open-source Python software was used to manipulate raw data, primarily using Geospatial Data Abstraction Library and RasterIO. We used the cloud-based geospatial analysis platform Google Earth Engine [50] to analyze forest cover [27]. All analyses were compiled in a WGS84 projection and code used in our analysis is available inS6 Appendix.
Statistical analyses. Regions, biodiversity hotspots, and country level data on area of trop-ical dry forest biome potential extent were examined for a normal distribution using one-sam-ple Shapiro-Wilk normality test for small samone-sam-ples (� 30) and Kolmogorov-Smirnov tests (> 30). Non-parametric (Wilcoxon’s rank sum test) tests were used to identify significant dif-ferences in area among bioclimatic definitions and between the WorldClim and CHELSA data sets for regions and biodiversity hotspots. Parametric (paired T-tests) were used to identify sig-nificant differences in area among bioclimatic definitions and between the WorldClim and CHELSA data sets for countries.
Comparisons with WWF ecoregions, bioclimatic definitions, and field plots. We calcu-lated the area of each WWF ecoregion and compared results with four bioclimatic definitions (S1 Appendix). The agreement between WWF ecoregions, bioclimatic definitions, and field plots were measured using the percentage of dry forest plots that have been classified as dry forest according to the WWF ecoregions and different bioclimatic definitions (i.e. the percent-age of true positives). However, we lack non-tropical dry forest plots such as tropical rain for-ests to calculate the percentage of false positives (i.e. non dry forest plots classified as dry forest) and true negative (i.e. non dry forest plots not classified as dry forest). Maximizing only the percentage of true positives might lead to selecting the best bioclimatic definition that pre-dicts the larger extent of dry forest. Thus, we examine the percentage of true positives as a function of the extent of dry forest predicted by the different bioclimatic definitions. Given that the percentage of true positives likely depends on our sample of field plots, we used boot-strapping to compute a 95% confidence interval (CI) around the estimated values. Bootstrap-ping was done using 1,000 iterations and the lower and upper bounds of the CI were estimated using the quantiles 0.025 and 0.975, respectively.
Tropical dry forest vegetation cover and change. We selected the bioclimatic definition that had the highest agreement with field plots at a global spatial extent and calculated forest cover in 2000 and gross loss from 2001–2020 based on the global forest change data set using a forest cover threshold of � 40% to define closed canopy forest [17,23,27]. We also calculated similar results for (i) all tropical forests, (ii) the WWF tropical and subtropical dry broadleaf forest ecoregions, and (iii) the consensus (overlap) of the four bioclimatic definitions (aridity index, Murphy and Lugo, FAO, DryFlor). We also estimate the extent of forest cover using thresholds of � 10% [17] and � 60% [51,52] for the bioclimatic definition that had the highest agreement with field plots at a global spatial for global comparisons (S3 Appendix).
Results
Comparisons of bioclimatic definitions of tropical dry forest biome
Estimates of tropical dry forest biome extent based on bioclimatic definitions varied (Table 2). The global extent estimated from the aridity index, Murphy and Lugo, and FAO climate
Table 2. Estimate of tropical dry forest biome area (km2), globally and in different regions, based on four bioclimatic definitions (Murphy and Lugo, Food and
Agriculture Organization of the United Nations [FAO], DryFlor, Aridity Index) using two projections.
Regions Murphy & Lugo FAO DryFlor Aridity Index
Global 15,300,143 15,514,946 10,370,038 15,777,797 16,123,939 15,177,193 10,820,627 14,376,146
Africa 6,825,248 7,480,815 5,005,193 8,000,948
7,237,338 7,700,711 5,243,736 7,420,821 North and Central America 590,609 689,325 284,154 1,166,918 652,516 811,289 326,525 1,028,800 South America 5,736,592 3,134,372 3,958,243 2,605,596 6,042,593 3,774,250 4,023,236 1,866,315
South Asia 437,803 1,261,394 112,170 1,983,914
481,186 1,230,178 153,111 1,417,872 South East Asia/Pacific 1,709,888 1,687,644 1,010,275 2,020,421 1,710,303 1,660,763 1,074,017 2,642,338 WorldClim data presented above CHELSA. Highest extents in bold.
definitions were relatively similar (~15,000,000 km2), while DryFlor covered the smallest area estimated ~10,000,000 km2(Table 2).
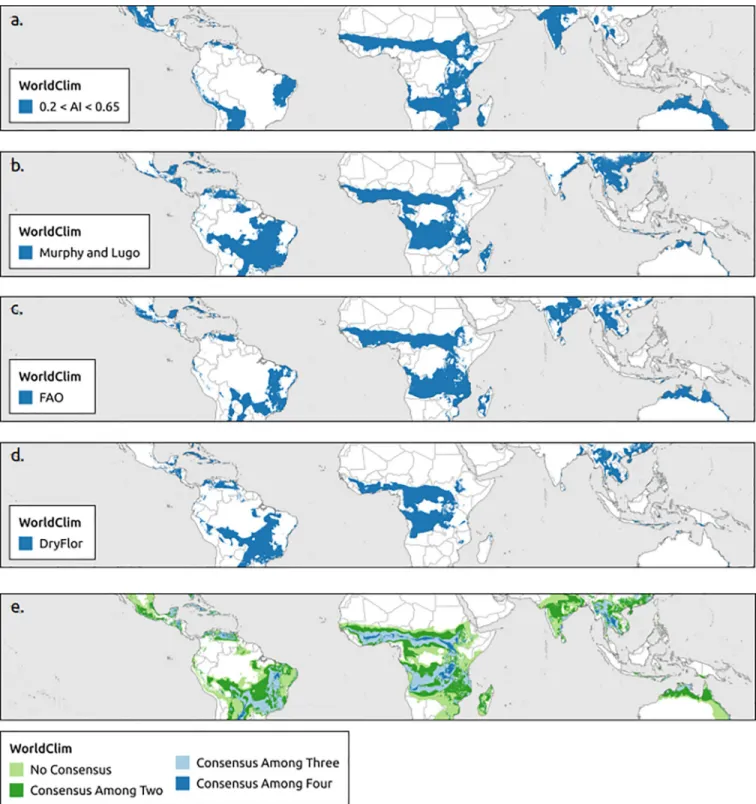
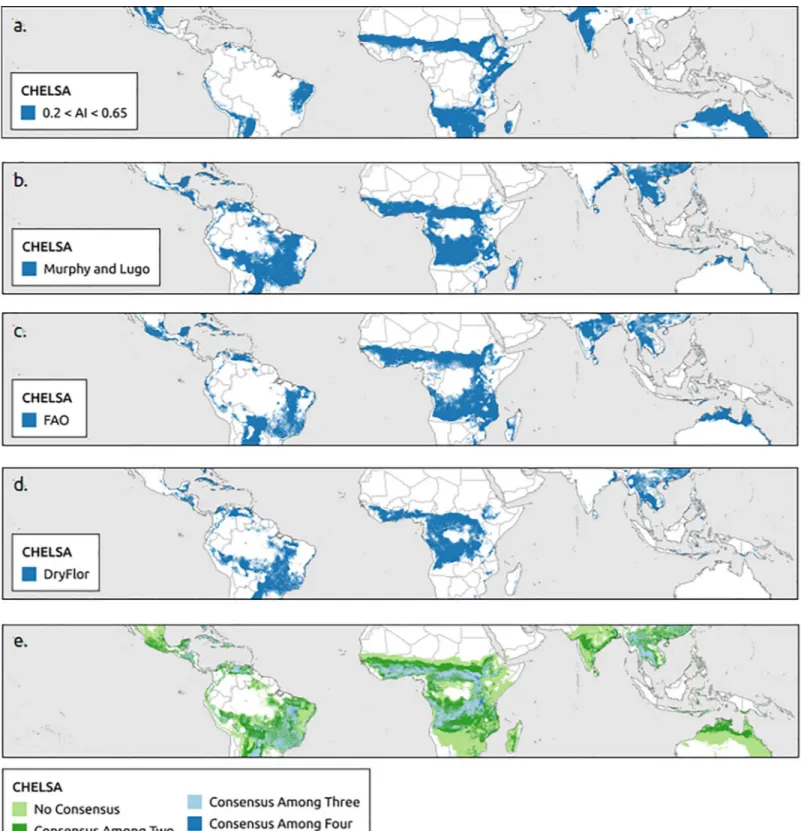
The aridity index using WorldClim and Murphy and Lugo using CHELSA estimated the largest extents of the tropical dry forest biome by region followed by the aridity index and FAO using CHELSA (Table 2). The boundaries of the tropical dry forest biome extent were more homogenous (smoother) for WorldClim than CHELSA data (Figs2and3). Consensus maps showed that the area predicted to support tropical dry forest biome based on all four bio-climatic definitions (aridity index, Murphy and Lugo, FAO, DryFlor) was smaller than the combined non-consensus areas predicted by at least one bioclimatic definition. WorldClim contained larger areas of a consensus for all four bioclimatic definitions than CHELSA (Figs
2Eand3E).
On a regional scale, there was no significant difference in areas estimated by climatic data sets used (Wilcoxon’s rank sum testsp > 0.05). Murphy and Lugo’s definition estimated the largest tropical dry forest biome extent within biodiversity hotspots and countries (S4andS5
Appendices). However, there was no significant difference between climatic data sets used in biodiversity hotspots (Wilcoxon’s rank sum testsp > 0.05). At the country level, there was a significant difference in climatic data set used for all four bioclimatic definitions (paired t-test: Murphy and Lugop = 0.004, FAO p = 0.012, DryFlor p = 0.018, aridity index p = 0.005).
Comparisons to WWF ecoregions
The 53 WWF Ecoregions defined as tropical and subtropical dry broadleaf forest extend over an area of 2,918,256 km2with South Asia having the largest extent and Africa the smallest extent (Table 3). Globally, the aridity index and FAO definitions using WorldClim had the highest overlap with WWF Ecoregions (57%) followed by FAO using CHELSA (56%), and Murphy and Lugo using CHELSA (44%) (Table 3). DryFlor had the lowest overlap. There was high variation among regions, however. Murphy and Lugo and the aridity index had the high-est overlaps within most WWF tropical and subtropical dry broadleaf forhigh-est ecoregions by region.
Validation using field plots
We identified 540 field plots that met our search criteria. Most plots were between 0.03 and 0.1 ha, with diameter at breast height ranging from 1 cm to 10 cm. Species lists were available for 525 sites, however, full species density data were only available at 487 sites (S2 Appendix). Mean canopy cover estimates (1 km) were available for 534 sites (no forest cover data was available for the Mariana or Marquesas islands) and averaged 37.8% canopy cover,± 25.9 in 2000 while max-imum canopy cover estimates averaged 48.1 canopy cover,± 30.1 (S2 Appendix).
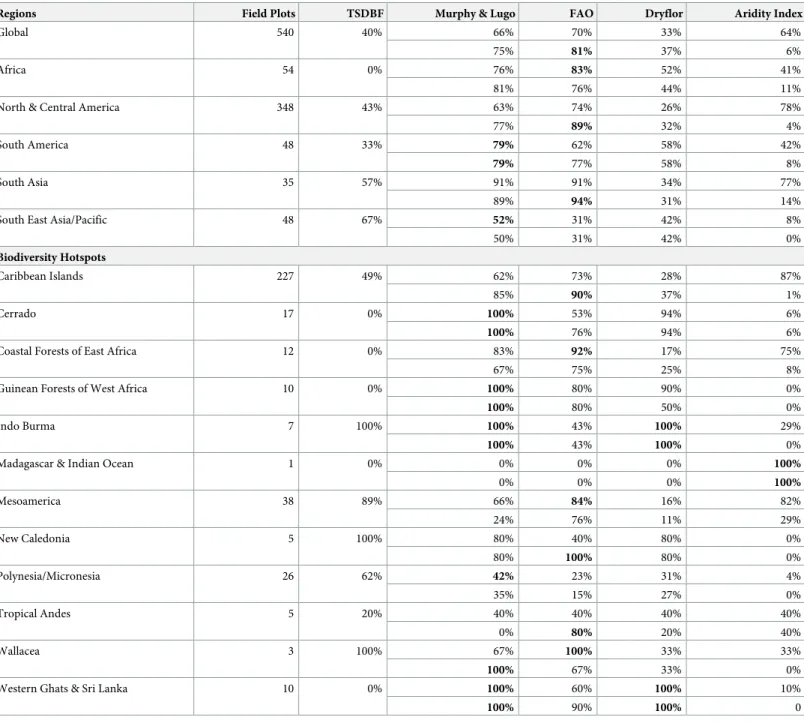
Only 40% of the tropical dry forest field plots fell within the WWF tropical and subtropical broadleaf forest ecoregion boundaries (Table 4). This ranged from a low of 0% overlap in Africa to a high of 67% in South East Asia/Pacific. At a global scale, FAO bioclimatic definition using CHELSA had the highest agreement (81%) with field plots followed by Murphy and Lugo using CHELSA (75%). FAO (70%), Murphy and Lugo (66%) and the aridity index (64%) using WorldClim accounted for the next three highest overlaps with field plots. DryFlor had the lowest overlap (33–37%).
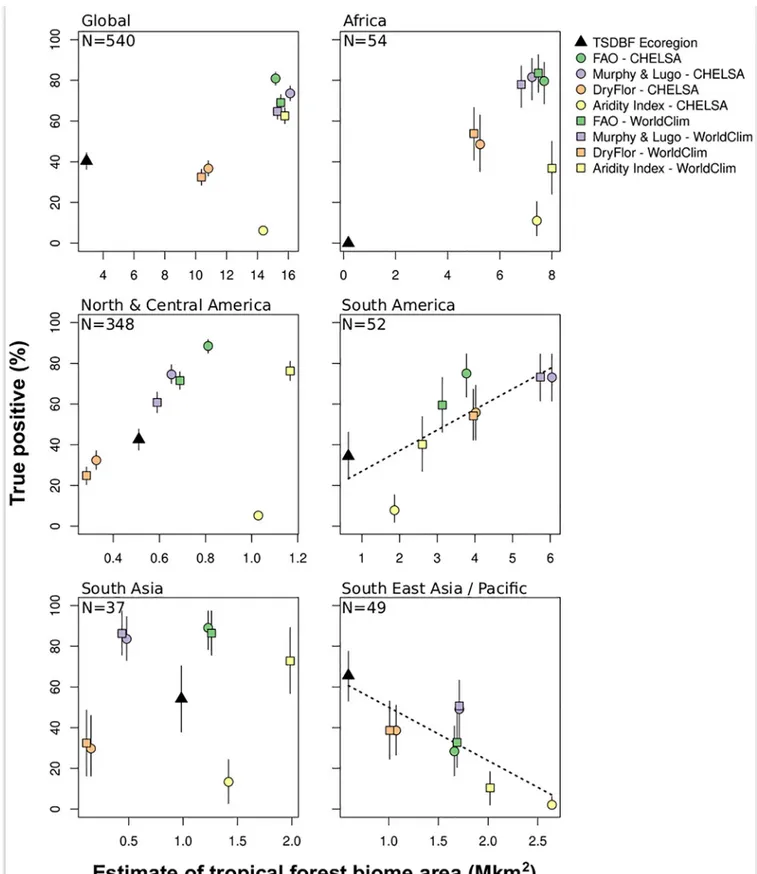
Most of the percentage of true positive were not correlated with the estimate of tropical dry forest biome extent (Fig 4). Thus, the better definition (e.g. the one which maximize the per-centage of true positives) was not necessarily the definition that predicted the larger extent of the tropical dry forest biome. Globally the FAO-CHELSA was the best bioclimatic definition (80.9%), however, best definitions differ between the different regions. FAO-CHELSA was the
best definition for North, Central (88.4%). There was no clear difference between FAO and Murphy and Lugo bioclimatic definitions in Africa, South America, and South Asia as evi-denced by overlaps between confidence intervals. The percentage of true positives for
Fig 2. Global distribution of tropical dry forest biome using WorldClim. Based on (a) aridity index, (b) Murphy and Lugo, (c) Food and Agriculture Organization of the United Nations (FAO), (d) DryFlor bioclimatic definitions using WorldClim and (e) overlap of all four bioclimatic definitions (aridity index, Murphy and Lugo, FAO, and DryFlor).
Fig 3. Global distribution of tropical dry forest biome using CHELSA. Based on (a) aridity index (b) Murphy and Lugo, (b) Food and Agriculture Organization of the United Nations (FAO), (c) DryFlor bioclimatic definitions using CHELSA and (e) overlap of all four bioclimatic definitions (aridity index, Murphy and Lugo, FAO, and DryFlor).
bioclimatic definitions were lower for South East Asia/Pacific where the TSDBF definition per-formed better (65.6%).
Estimates of tropical dry forest cover and change
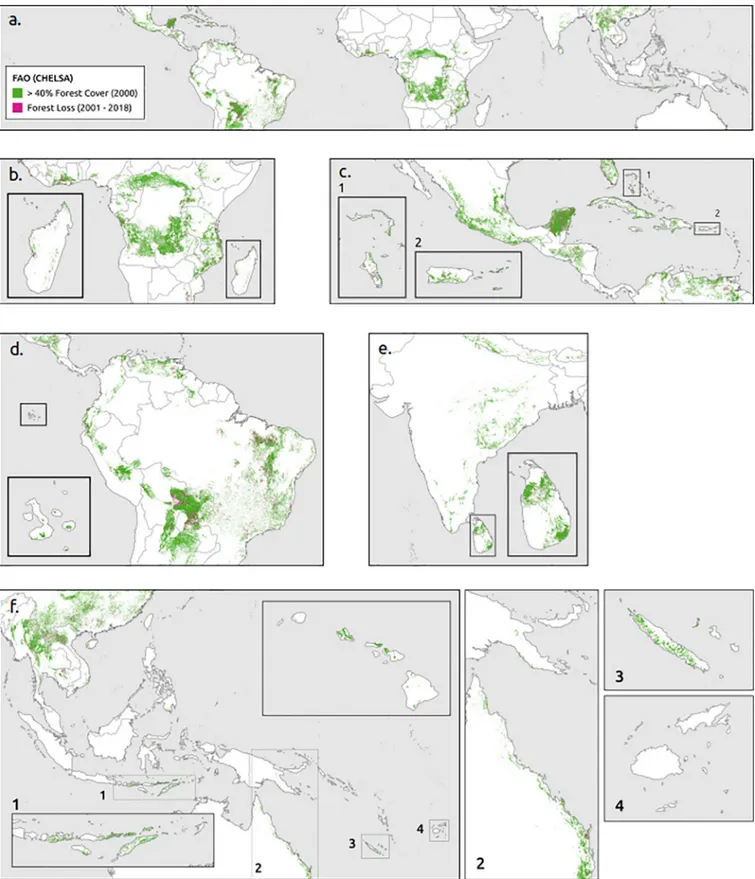
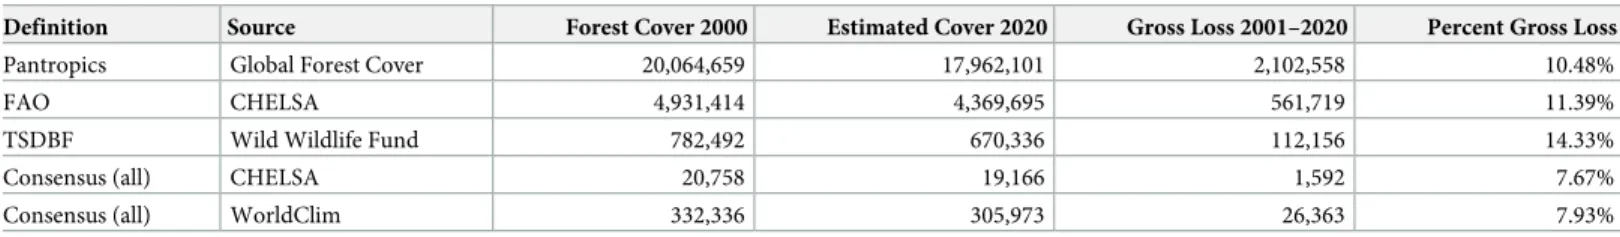
Using the FAO bioclimatic definition and CHELSA data set to estimate closed forest cover and change since 2000 (Fig 5), we estimated a total of 4,931,414 km2of closed canopy forest in 2000 and 4,369,695 km2of closed canopy forest in 2020. We estimate a potential gross loss of closed canopy tropical dry forest amounting to 561,719 km2(11%) between 2001 and 2020. Tropical dry forest was estimated to account for 25% of all closed canopy forest cover in the tropics in 2000 (Table 5), which is considerably larger than WWF tropical and subtropical dry broadleaf forest ecoregion estimates (782,492 km2or 4% of all tropical forests) and consensus maps based on all four definitions with either climatic dataset. Our estimates of tropical dry forest cover are greater than other global estimates that range from 1,048,700 km2of tropical dry forest (� 40% closed canopy) [23] to 3,380,000 km2[17].
Discussion
WWF ecoregions
There was low overlap between WWF tropical and subtropical dry broadleaf forest ecoregions and bioclimatic definitions of tropical dry forest biomes (<57%) and field plots (40%) at a global scale. Tropical dry forest field plots occurred in other WWF ecoregions, including tropi-cal and subtropitropi-cal moist broadleaf forests (14% of the plots), tropitropi-cal and subtropitropi-cal conifer-ous forests (11%), tropical and subtropical grassland, savanna and shrubland (10%), and deserts and xeric shrublands (9%). This is of concern because the WWF ecoregions are widely used standard for delineating global biomes and estimating forest cover, canopy height, bio-mass, stand density, and anthropogenic disturbance [3,23,29,31,32,53] (S1 Appendix).
We found that large areas of the tropical dry forest biome will be missed when using these WWF boundaries and that caution should be used when applying WWF boundaries for coun-try scale analyses. At the councoun-try scale, higher resolution vegetation maps that identify forests, woodlands, shrublands, and savannas should be used. While WWF ecoregions may be appro-priate for global or macro-scale analyses of tropical forests biomes, our results suggest that
Table 3. Extent of World Wildlife Fund’s Tropical and Subtropical Dry Broadleaf Forest (TSDBF) ecoregion (km2) and overlap (%) with bioclimatic definitions
(Murphy and Lugo, Food and Agriculture Organization of the United Nations [FAO], DryFlor, Aridity Index).
Regions TSDBF Ecoregion Murphy & Lugo FAO DryFlor Aridity Index
Global 2,918,256 43% 57% 22% 57%
44% 56% 22% 35%
Africa 185,624 70% 69% 3% 48%
60% 56% 1% 13%
North & Central America 511,057 45% 63% 23% 67%
46% 64% 24% 41%
South America 642,243 58% 47% 31% 43%
60% 51% 28% 32%
South Asia 983,944 9% 60% 2% 82%
11% 61% 2% 56%
South East Asia/Pacific 593,608 75% 53% 49% 24%
76% 49% 51% 4%
WorldClim data presented above CHELSA. Highest agreement with ecoregion in bold.
they may not be appropriate for analyzing tropical dry forest vegetation types or the impacts of climate change on tropical dry forests. Instead, the bioclimatic definitions of tropical dry forest from FAO with CHELSA datasets should be used.
Bioclimatic definitions of tropical dry forest
According to our comparison with field plots data, the FAO and Murphy and Lugo bioclimatic definitions of tropical dry forest extent performed best. There were 358 field plots (66%) that
Table 4. Number of field plots and percent agreement with field plots (%) and World Wildlife Fund’s Tropical and Subtropical Dry Broadleaf Forest (TSDBF) ecor-egions and four bioclimatic definitions (Murphy and Lugo, Food and Agriculture Organization of the United Nations [FAO], DryFlor, Aridity Index).
Regions Field Plots TSDBF Murphy & Lugo FAO Dryflor Aridity Index
Global 540 40% 66% 70% 33% 64%
75% 81% 37% 6%
Africa 54 0% 76% 83% 52% 41%
81% 76% 44% 11%
North & Central America 348 43% 63% 74% 26% 78%
77% 89% 32% 4%
South America 48 33% 79% 62% 58% 42%
79% 77% 58% 8%
South Asia 35 57% 91% 91% 34% 77%
89% 94% 31% 14%
South East Asia/Pacific 48 67% 52% 31% 42% 8%
50% 31% 42% 0% Biodiversity Hotspots Caribbean Islands 227 49% 62% 73% 28% 87% 85% 90% 37% 1% Cerrado 17 0% 100% 53% 94% 6% 100% 76% 94% 6%
Coastal Forests of East Africa 12 0% 83% 92% 17% 75%
67% 75% 25% 8%
Guinean Forests of West Africa 10 0% 100% 80% 90% 0%
100% 80% 50% 0%
Indo Burma 7 100% 100% 43% 100% 29%
100% 43% 100% 0%
Madagascar & Indian Ocean 1 0% 0% 0% 0% 100%
0% 0% 0% 100% Mesoamerica 38 89% 66% 84% 16% 82% 24% 76% 11% 29% New Caledonia 5 100% 80% 40% 80% 0% 80% 100% 80% 0% Polynesia/Micronesia 26 62% 42% 23% 31% 4% 35% 15% 27% 0% Tropical Andes 5 20% 40% 40% 40% 40% 0% 80% 20% 40% Wallacea 3 100% 67% 100% 33% 33% 100% 67% 33% 0%
Western Ghats & Sri Lanka 10 0% 100% 60% 100% 10%
100% 90% 100% 0
WorldClim data presented above CHELSA. Highest agreement with field plots in bold.
Fig 4. Estimates of the percentage of true positives and biome extent using bootstrapping with 95% confidence intervals. Points represent the average values and segments the lower and upper bounds of the intervals (i.e. the quantiles 0.025 and 0.975, respectively) using 1,000 iterations. Dotted black lines represent significant (p < = 0.05) linear relationships between the estimate of tropical dry forest biome area and the percentage of true positive.
Fig 5. Forest cover and change from FAO bioclimatic definition, CHELSA climate data set, and closed canopy cover. (a) Global, (b) Africa, (c) North and Central America, (d) South America, (e) South Asia, and (f) Southeast Asia & Asia Pacific.
overlapped with both the FAO and Murphy and Lugo bioclimatic definitions (80 plots FAO only, 47 plots Murphy and Lugo only) and 54 field plots (10%), primarily in regions with long dry seasons (dry season > 9 months) or regions with over 2000 mm of mean annual precipita-tion such as Pacific islands, that did not overlap with either definiprecipita-tion. The FAO definiprecipita-tions included drier regions with more seasonal forests while the Murphy and Lugo definition encompassed more moist regions with less seasonal forests. Thus, the FAO definitions appear to be best for identifying the core of tropical dry forest biome at a global spatial scale, while the Murphy and Lugo definition may perform best for identifying transitional areas between dry and moist or rain forest biomes. The DryFlor definitions worked well in the Neotropics but did not perform well at a global and regional spatial scales. The aridity index does not account for precipitation seasonality and appears to include the drier extremes of what would be con-sidered tropical dry forest. Indeed, although forests that occur within an area with aridity index < 0.65 can be considered “tropical dry forests” because they occur in the tropics and clearly occur in dry conditions, the absence of a minimum precipitation threshold and season-ality criteria clearly misses a number of well-known tropical dry forest sites such as tropical dry forests of Central America and the Caribbean [2]. Future studies and comparisons of tropi-cal dry forest biome should be undertaken using FAO bioclimatic definitions.
Climatic data sets
WorldClim and CHELSA climate data sets did not significantly change estimates of tropical dry for-est area based on all four bioclimatic definitions at the regional and biodiversity hotspot scales. However, using different climate data sets did identify different extents and areas at the country level (Figs2and3). As analyses proceed to smaller spatial extents from regions to countries, the cli-matic data set used results in significantly different estimates of area. Thus the data set used becomes more important at small spatial extent. The CHELSA dataset generally had higher mean annual pre-cipitation estimates than WorldClim but there was little difference in temperature estimates. The CHELSA data best matched field verified locations of tropical dry forest extent and offered some advantages over interpolated WorldClim data when assessing the future impacts of climate change. Since CHELSA is a downscaled global circulation models, it can easily be used to estimate the future climatic variables a 10 km and over last 4 million years at 10 km resolution [54]. The CHELSA data set also had the highest agreement with field plots and appears to be the most appropriate climate data set to use for studying tropical dry forests and possibly other tropical ecosystems.
Tropical dry forest cover and changes
Our estimate of closed canopy (� 40%) tropical dry forest in 2020 is 4.9 million km2, based on the best performing parameters (FAO bioclimatic definition using CHELSA) and this is larger
Table 5. Comparisons of best methods for estimating closed canopy (� 40% closed canopy) tropical dry forest extent and forest cover (km2) in 2000 and 2020
between 30˚N and 30˚S.
Definition Source Forest Cover 2000 Estimated Cover 2020 Gross Loss 2001–2020 Percent Gross Loss Pantropics Global Forest Cover 20,064,659 17,962,101 2,102,558 10.48%
FAO CHELSA 4,931,414 4,369,695 561,719 11.39%
TSDBF Wild Wildlife Fund 782,492 670,336 112,156 14.33%
Consensus (all) CHELSA 20,758 19,166 1,592 7.67%
Consensus (all) WorldClim 332,336 305,973 26,363 7.93% FAO, Food and Agriculture Organization of the United Nations; CHELSA, Climatologies at High-resolution for the Earth’s Land Surface Areas; TSDBF, tropical and subtropical dry broadleaf forest.
than previous estimates. Miles et al. (2006) estimated 1,048,700 km2of tropical dry forest (� 40% closed canopy) using MODIS imagery (500 m), while Bastin et al. (2017) estimated 3.38 million km2of closed canopy (� 40%) dry forest in the tropics. Miles et al. (2006) estimate thus appears very conservative and more in line with our estimates in WWF ecoregions, but well above estimates of closed canopy forest based on consensus of all four climatic definitions. Although global comparisons of studies are difficult, it is clear that tropical dry forest vegeta-tion types are experiencing a decline. Estimates based on all definivegeta-tions of tropical dry forest (Table 5) are between 7% and 15% from 2000 to 2020 with closed canopy tropical dry forests experiencing high rates of deforestation and gross forest cover loss (S3 Appendix).
Limitations
There is currently a lack of global comparative ground validation for our FAO CHELSA tropi-cal dry forest biome and vegetation maps and field validation or very high resolution remote sensing validation is needed in the future [17]. While a growing number of tropical dry forest plots have been established worldwide, there is also a great deal of spatial bias in the number, extent, and density of tropical dry forest field plots. Our data set of 540 tropical dry forest plots were biased towards North and Central America, which accounted for 64% of the plots. Among the North and Central American plots, 65% were located in the Caribbean [8,33]. There were relatively few comparative tropical dry forest plots from Madagascar (1 plot), east-ern India, Indonesia, and Australia. Furthermore, there are a number of countries such as Angola, China, and Zambia that appear to have tropical dry forest biome and vegetation type but no field plots (S5 Appendix). This may be due to our search criteria for tropical dry forest plots which may have missed local names of dry forest vegetation types (e.g. monsoon forest), however, these areas deserve a high priority for establishing standardized plots in the future.
Almost all global climate data sets contain inaccuracies especially on islands with few weather stations and high heterogeneity in the landscape [15,42]. Miranda et al. (2018) found that WorldClim data resulted in the misclassification of 15 to 20% of tropical dry forests in lowland South America while the addition of soil data improved classification by 3%. Delimit-ing the tropical dry forest biome is complex because tropical forest historically occurred across environmental and disturbance gradients, does not always have solid boundaries as depicted in GIS, and can be a continuum from drier to wetter areas. On the dry end of the spectrum, dry forests generally grade into savannas, shrublands, woodlands within the same climatic condition. The actual extent of vegetation within this region is highly impacted by substrate, soil moisture, and fire [19,33]. On the wetter end of the spectrum, tropical dry forest generally transitions into moister forests, a zonal riparian forests, or swamps with increased canopy heights and an increasing number of tree species that are less susceptible to seasonal drought or dry soil conditions. These gradients clearly existed in the past but have been significantly impacted by humans certainly over the last 100 years [3,4,55]. It should be remembered that we are currently examining a disturbed landscape in most dry forest regions. Many dry forest regions are deforested, fragmented, and degraded based on estimate of forest cover over plots at a landscape scale (1 km) and it is difficult to precisely identify and delineate their distribu-tion using global scale data (e.g. Hawaiian Islands).
Thus, climate definitions of tropical dry forest provide only a first order hypothesis and standard and repeatable method for identifying and estimating the spatial extent of tropical dry forest biome. Then analyses based on fine-scale features, such as forests (canopy
height � 3 m, � 40% canopy cover), woodlands (< 40% canopy cover), shrublands (stems < 3 m), and savannas (< 1 m, grasses) can be undertaken at a higher resolution such as 30 m from Landsat [27,56] or very high resolutions < 1 m in Google Earth [17,50].
Future research and applications
Our research focused on true positives (e.g. the percentage of dry forest plots that have been classified as tropical dry forest according to the different bioclimatic definitions) and false neg-atives (e.g. the percentage of dry forest plots that have not been classified as tropical dry forest according to the different bioclimatic definitions). However, future research at the biome level should include a confusion matrix with false positives (e.g. the percentage of non-dry forest plots, such as tropical rain forest, that have been classified as dry forest according to the differ-ent bioclimatic definitions), and the true negatives (e.g. the percdiffer-entage of non-dry forest plots that have not been classified as dry forest according to the different bioclimatic definitions). This can be done at the biome level using high resolution locations of tropical rain forest plots.
Comparative analyses of biogeography, threats, and conservation can be undertaken using FAO (CHELSA) or Murphy and Lugo (CHELSA) boundaries as a baseline. It is well-estab-lished that biodiversity is greatly threatened by human activity [49,57] and land cover changes such as those linked to human-induced forest loss, fragmentation, and degradation represent the largest current threat to biodiversity [57–59]. Miles et al. (2006) identified five global threat metrics for tropical dry forest including climate change (at a spatial resolution of 300 km), for-est fragmentation (500 m), fire (10 km), agrosuitability (10 km), and population (10 km). Since this seminal work, there has been a significant increase in the temporal and spatial reso-lution of GIS and remote sensing data for these threat metrics, such as predicted future climate change (10 km), forest fragmentation (� 30 m), fire and burned areas (375 m), agrosuitability and grazing (1 km), and population (1 km) [26,60–64]. Thus, there are currently a number of global threat metrics that can be analyzed with FAO and CHELSA that might significantly improve our understanding of the health of tropical dry forests.
Twenty-five of the 36 global biodiversity hotspots appear to contain tropical dry forest biome based on three climatic definitions of tropical dry forests (S4 Appendix), possibly highlighting the importance of this biome and vegetation type. Analyses of protected areas, old growth forest, and threatened and endangered species are also needed within tropical dry for-est biome and vegetation type. There has been a rapid increase in the number of protected areas and clearly there is a need to identify how well different regions are protected [23]. Using time series Landsat and fire data sets since 2000, it should be possible to identify stable closed canopy tropical dry forests that have not experienced fire or forest loss since 2000 [21,63]. These forest areas may be some of the best preserved or relictual forests and contain an increasing rare combination of dry forest species. This may be especially true for regions like Africa, Asia, and Australia where fires and grazing are common and closed canopy dry forests are isolated in natural refugia [55].
Conclusions
More precise knowledge of the extent and location of global tropical dry forest is needed to better understand forest cover dynamics, biodiversity threats and the conservation status of this vulnerable biome. We produced reliable data on tropical dry forest extent and overall for-est loss spanning the last 20 years. We also demonstrate that nearly half of all tropical dry forfor-est will be missed using the WWF ecoregion classification alone, with only 40% of our 540 tropical dry forest field plots falling within the WWF tropical and subtropical broadleaf forest ecore-gion. We found that using the FAO bioclimatic definition applied to the CHELSA climate data set is a promising approach to identify potential dry forest extent based on the high agreement with field data. Closed canopy tropical dry forest currently occurs in 25 of the world’s 36 biodi-versity hotspots, a majority of pantropical countries, and has been experiencing high rates of deforestation (11%) between 2000 and 2020. Identifying the extent and distribution of tropical
dry forest regions are important for future research on the impacts of climate change and understanding the status of the world’s tropical dry forest for conservation purposes.
Supporting information
S1 Appendix. Tropical and subtropical dry broadleaf forest defined by World Wildlife Fund. Name of ecoregion, extent, and forest cover.
(CSV)
S2 Appendix. Tropical dry forest field plots. Comprehensive list of the 540 verified tropical dry forest plots, their coordinates, references, and bioclimatic characteristics.
(CSV)
S3 Appendix. Forest cover and extent statistics. Forest cover statistics for 540 tropical dry forest plots using resampled Global Forest Watch tree canopy cover (1 km2) data for the year 2000 and a 1 km buffer around each plot. Total forest cover estimates and gross forest cover loss are also calculated for open canopy (� 10%) and closed canopy (� 40% and � 60%) for FAO CHELSA from 2000 to 2020.
(DOCX)
S4 Appendix. Biodiversity hotspots for mesoscale analyses of tropical dry forest. Extent and agreement of tropical dry forest area.
(CSV)
S5 Appendix. Tropical dry forest extent at country level. Summaries of tropical dry forest extent based on climatic definitions and datasets at the country level.
(CSV)
S6 Appendix. Computer code for global analysis of tropical dry forest. Code used to accom-plish a global analysis of tropical dry forest extent and cover based on a suite of remote sensing and modeled climate and forest data, as well as GIS layers of political and conservation bound-aries.
(PDF)
Acknowledgments
We gratefully acknowledgeDryFlor.org(Karina Banda, Kyle Dexter, Danilo Neves, and Toby Pennington) for sharing advice and insights on data collection and neotropical dry forest inventories. We also would like to thank Kyle Cavanaugh for comments and suggestions.
Author Contributions
Conceptualization: Jonathan Pando Oco´n, Thomas Welch Gillespie.
Data curation: Jonathan Pando Oco´n, Thomas Ibanez, Thomas Welch Gillespie.
Formal analysis: Jonathan Pando Oco´n, Thomas Ibanez, Janet Franklin, Stephanie Pau, Gun-nar Keppel, Gonzalo Rivas-Torres, Michael Edward Shin, Thomas Welch Gillespie. Funding acquisition: Jonathan Pando Oco´n.
Investigation: Jonathan Pando Oco´n, Thomas Ibanez, Janet Franklin, Stephanie Pau, Gunnar Keppel, Gonzalo Rivas-Torres, Thomas Welch Gillespie.
Methodology: Jonathan Pando Oco´n, Thomas Welch Gillespie. Project administration: Jonathan Pando Oco´n.
Software: Jonathan Pando Oco´n. Supervision: Jonathan Pando Oco´n.
Visualization: Jonathan Pando Oco´n, Thomas Ibanez, Gonzalo Rivas-Torres. Writing – original draft: Jonathan Pando Oco´n, Thomas Welch Gillespie.
Writing – review & editing: Jonathan Pando Oco´n, Thomas Ibanez, Janet Franklin, Stephanie Pau, Gunnar Keppel, Thomas Welch Gillespie.
References
1. Murphy PG, Lugo AE. Ecology of tropical dry forest. Annual Review of Ecology and Systematics. 1986 Nov; 17(1):67–88.
2. Janzen DH. Tropical dry forests. Biodiversity. 1988 Jan 15:130–7.
3. Riggio J, Baillie JE, Brumby S, Ellis E, Kennedy CM, Oakleaf JR, et al. Global human influence maps reveal clear opportunities in conserving Earth’s remaining intact terrestrial ecosystems. Global Change Biology. 2020 Jun 5.https://doi.org/10.1111/gcb.15109PMID:32500604
4. Blackie R, Baldauf C, Gautier D, Sunderland T. Tropical Dry Forests: The State of Global Knowledge and Recommendations for Future Research, vol. 2. CIFOR, Indonesia. 2014.
5. Siyum ZG. Tropical dry forest dynamics in the context of climate change: syntheses of drivers, gaps, and management perspectives. Ecological Processes. 2020 Dec; 9(1):1–6.
6. Bruegmann MM. Hawai’i’s dry forests. Endangered Species Bulletin. 1996 11:26–27.
7. Cabin RJ, Weller SG, Lorence DH, Flynn TW, Sakai AK, Sandquist D, et al. Effects of long-term ungu-late exclusion and recent alien species control on the preservation and restoration of a Hawaiian tropical dry forest. Conservation Biology. 2000 Apr; 14(2):439–53.
8. Banda K, Delgado-Salinas A, Dexter KG, Linares-Palomino R, Oliveira-Filho A, Prado D, et al. Plant diversity patterns in neotropical dry forests and their conservation implications. Science. 2016 Sep 23; 353(6306):1383–7.https://doi.org/10.1126/science.aaf5080PMID:27708031
9. Von Humboldt A. Aspects of Nature, in Different Lands and Different Climates: With Scientific Elucida-tions. in 2 Vols. Lea and Blanchard; 1849.
10. Schimper AF. Plant-geography Upon a Physiological Basis. Clarendon Press; 1903.
11. Box EE. Macroclimate and plant forms: an introduction to predictive modeling in phytogeography. Springer Science & Business Media; 2012 Dec 6.
12. Meentemeyer V, Box EO. Scale effects in landscape studies. In Landscape heterogeneity and distur-bance 1987 (pp. 15–34). Springer, New York, NY.
13. Ratnam J, Bond WJ, Fensham RJ, Hoffmann WA, Archibald S, Lehmann CE, et al. When is a ‘forest’ a savanna, and why does it matter?. Global Ecology and Biogeography. 2011 Sep; 20(5):653–60.
14. Pausas JG, Bond WJ. Humboldt and the reinvention of nature. Journal of Ecology. 2019 May; 107 (3):1031–7.
15. Fick SE, Hijmans RJ. WorldClim 2: new 1-km spatial resolution climate surfaces for global land areas. International Journal of Climatology. 2017 Oct; 37(12):4302–15.
16. Karger DN, Conrad O, Bo¨hner J, Kawohl T, Kreft H, Soria-Auza RW, et al. Climatologies at high resolu-tion for the earth’s land surface areas. Scientific Data. 2017 Sep 5; 4:170122.https://doi.org/10.1038/ sdata.2017.122PMID:28872642
17. Bastin JF, Berrahmouni N, Grainger A, Maniatis D, Mollicone D, Moore R, et al. The extent of forest in dryland biomes. Science. 2017 May 12; 356(6338):635–8.https://doi.org/10.1126/science.aam6527 PMID:28495750
18. Trabucco A, Zomer RJ. Global aridity index and potential evapotranspiration (ET0) climate database v2. CGIAR Consort Spat Inf. 2018.
19. Huang H, Xue Y, Li F, Liu Y. Modeling long-term fire impact on ecosystem characteristics and surface energy using a process-based vegetation–fire model SSiB4/TRIFFID-Fire v1.0. Geoscientific Model Development. 2020 Dec; 13(12):6029–6050.
20. Staver AC, Archibald S, Levin SA. The global extent and determinants of savanna and forest as alterna-tive biome states. Science. 2011 Oct 14; 334(6053):230–2.https://doi.org/10.1126/science.1210465 PMID:21998389
21. Dexter KG, Pennington RT, Oliveira-Filho AT, Bueno ML, Silva de Miranda PL, Neves DM. Inserting tropical dry forests into the discussion on biome transitions in the tropics. Frontiers in Ecology and Evo-lution. 2018 Jul 24; 6:104.
22. Silva AC, Souza AF (2018) Aridity drives plant biogeographical sub regions in the Caatinga, the largest tropical dry forest and woodland block in South America. PLoS ONE 13(4): e0196130.https://doi.org/ 10.1371/journal.pone.0196130PMID:29702668
23. Miles L, Newton AC, DeFries RS, Ravilious C, May I, Blyth S, et al. A global overview of the conserva-tion status of tropical dry forests. Journal of Biogeography. 2006 Mar; 33(3):491–505.
24. Fraser RH, Olthof I, Pouliot D. Monitoring land cover change and ecological integrity in Canada’s national parks. Remote Sensing of Environment. 2009 Jul 15; 113(7):1397–409.
25. Portillo-Quintero CA, Sa´nchez-Azofeifa GA. Extent and conservation of tropical dry forests in the Ameri-cas. Biological Conservation. 2010 Jan 1; 143(1):144–55.
26. Secades C, O’Connor B, Brown C, Walpole M. Earth observation for biodiversity monitoring: a review of current approaches and future opportunities for tracking progress towards the Aichi Biodiversity Tar-gets. CBD technical series. 2014(72).
27. Hansen MC, Potapov PV, Moore R, Hancher M, Turubanova SA, Tyukavina A, et al. High-resolution global maps of 21st-century forest cover change. Science. 2013 Nov 15; 342(6160):850–3.https://doi. org/10.1126/science.1244693PMID:24233722
28. Hansen AJ, Neilson RP, Dale VH, Flather CH, Iverson LR, Currie DJ, et al. Global change in forests: responses of species, communities, and biomes: interactions between climate change and land use are projected to cause large shifts in biodiversity. BioScience. 2001. Sept; 51(9):765–779.
29. Schmitt CB, Burgess ND, Coad L, Belokurov A, Besanc¸on C, Boisrobert L, et al. Global analysis of the protection status of the world’s forests. Biological Conservation. 2009 Oct 1; 142(10):2122–30.
30. Sunderland T, Apgaua D, Baldauf C, Blackie R, Colfer C, Cunningham AB, et al. Global dry forests: a prologue. International Forestry Review. 2015 Aug 1; 17(2):1–9.
31. Crowther TW, Glick HB, Covey KR, Bettigole C, Maynard DS, Thomas SM, et al. Mapping tree density at a global scale. Nature. 2015 Sep; 525(7568):201–5.https://doi.org/10.1038/nature14967PMID: 26331545
32. Newbold T, Hudson LN, Arnell AP, Contu S, De Palma A, Ferrier S, et al. Has land use pushed terres-trial biodiversity beyond the planetary boundary? A global assessment. Science. 2016 Jul 15; 353 (6296):288–91.https://doi.org/10.1126/science.aaf2201PMID:27418509
33. Silva de Miranda PL, Oliveira-Filho AT, Pennington RT, Neves DM, Baker TR, Dexter KG. Using tree species inventories to map biomes and assess their climatic overlaps in lowland tropical South America. Global Ecology and Biogeography. 2018 Aug; 27(8):899–912.
34. Holdridge LR. Life zone ecology. Life zone ecology. 1967(rev. ed.)).
35. Griffith DM, Lehmann CE, Stro¨mberg CA, Parr CL, Pennington RT, Sankaran M, et al. Comment on “The extent of forest in dryland biomes”. Science. 2017 Nov 17; 358(6365).
36. Sa¨rkinen T, Iganci JR, Linares-Palomino R, Simon MF, Prado DE. Forgotten forests-issues and pros-pects in biome mapping using Seasonally Dry Tropical Forests as a case study. BMC ecology. 2011 Dec 1; 11(1):27.
37. Ostertag R, Inman-Narahari F, Cordell S, Giardina CP, Sack L. Forest structure in low-diversity tropical forests: a study of Hawaiian wet and dry forests. PloS one. 2014 Aug 27; 9(8):e103268.https://doi.org/ 10.1371/journal.pone.0103268PMID:25162731
38. Slik JF, Franklin J, Arroyo-Rodrı´guez V, Field R, Aguilar S, Aguirre N, et al. Phylogenetic classification of the world’s tropical forests. Proceedings of the National Academy of Sciences. 2018 Feb 20; 115 (8):1837–42.
39. Title PO, Bemmels JB. ENVIREM: an expanded set of bioclimatic and topographic variables increases flexibility and improves performance of ecological niche modeling. Ecography. 2018 Feb; 41(2):291– 307.
40. Olson DM, Dinerstein E, Wikramanayake ED, Burgess ND, Powell GV, Underwood EC, et al. Terrestrial Ecoregions of the World: A New Map of Life on EarthA new global map of terrestrial ecoregions provides an innovative tool for conserving biodiversity. BioScience. 2001 Nov 1; 51(11):933–8.
41. Franklin J, Andrade R, Daniels ML, Fairbairn P, Fandino MC, Gillespie TW, et al. Geographical ecology of dry forest tree communities in the West Indies. Journal of Biogeography. 2018 May; 45(5):1168–81.
42. Ibanez T, Keppel G, Baider C, Birkinshaw C, Culmsee H, Cordell S, et al. Regional forcing explains local species diversity and turnover on tropical islands. Global Ecology and Biogeography. 2018 Apr; 27 (4):474–86.
43. Franklin J, Serra-Diaz JM, Syphard AD, Regan HM. Big data for forecasting the impacts of global change on plant communities. Global Ecology and Biogeography. 2017 Jan; 26(1):6–17.
44. Prado-Junior JA, Schiavini I, Vale VS, Arantes CS, van der Sande MT, Lohbeck M, et al. Conservative species drive biomass productivity in tropical dry forests. Journal of Ecology. 2016 May; 104(3):817–27.
45. Salas-Morales SH, Gonza´ lez EJ, Meave JA. Canopy height variation and environmental heterogeneity in the tropical dry forests of coastal Oaxaca, Mexico. Biotropica. 2018 Jan; 50(1):26–38.
46. Suazo-Ortuño I, Urbina-Cardona JN, Lara-Uribe N, Marroquı´n-Pa´ramo J, Soto-Sandoval Y, Rangel-Orozco J, et al. Impact of a hurricane on the herpetofaunal assemblages of a successional chronose-quence in a tropical dry forest. Biotropica. 2018 Jul; 50(4):649–63.
47. Myers N, Mittermeier RA, Mittermeier CG, Da Fonseca GA, Kent J. Biodiversity hotspots for conserva-tion priorities. Nature. 2000 Feb; 403(6772):853–8.https://doi.org/10.1038/35002501PMID:10706275 48. Hoffman M, Koenig K, Bunting G, Costanza J, Williams K. Biodiversity Hotspots; 2016 (Version 2016.1)
[Data set]. Available from:http://doi.org/10.5281/zenodo.3261807.
49. Earth Natural. 1:10m Cultural Vectors, Admin 0 –Countries; 2019 [Data set]. Available at:https://www. naturalearthdata.com/about/terms-of-use/.
50. Gorelick N, Hancher M, Dixon M, Ilyushchenko S, Thau D, Moore R. Google Earth Engine: Planetary-scale geospatial analysis for everyone. Remote sensing of Environment. 2017 Dec 1; 202:18–27.
51. Murphy BP, Bowman DM. What controls the distribution of tropical forest and savanna?. Ecology Let-ters. 2012. March; 15(7):748–758.https://doi.org/10.1111/j.1461-0248.2012.01771.xPMID:22452780 52. Ratnam J, Tomlinson KW, Rasquinha DN, Sankaran M. Savannahs of Asia: antiquity, biogeography,
and an uncertain future. Philosophical Transactions of the Royal Society B: Biological Sciences. 2016. Sept 19; 371(1703):20150305.
53. Gillespie TW, Lipkin B, Sullivan L, Benowitz DR, Pau S, Keppel G. The rarest and least protected for-ests in biodiversity hotspots. Biodiversity and Conservation. 2012 Dec 1; 21(14):3597–611.
54. Gamisch A. Oscillayers: A dataset for the study of climatic oscillations over Plio-Pleistocene time-scales at high spatial-temporal resolution. Global Ecology and Biogeography. 2019 Nov; 28(11):1552–60. https://doi.org/10.1111/geb.12979PMID:31762691
55. Lock JM. The seasonally dry vegetation of Africa: parallels and comparisons with the Neotropics. InNeotropical Savannas and Seasonally Dry Forests 2006 May 25 (pp. 449–467). CRC Press.
56. Alencar A, Shimbo JZ, Lenti F, Balzani Marques C, Zimbres B, Rosa M, et al. Mapping three decades of changes in the brazilian savanna native vegetation using landsat data processed in the google earth engine platform. Remote Sensing 2020 March; 12(6):924.
57. Gaston KJ. Biodiversity and extinction: species and people. Progress in Physical Geography. 2005 Jun; 29(2):239–47.
58. Chapin Iii FS, Zavaleta ES, Eviner VT, Naylor RL, Vitousek PM, Reynolds HL, et al. Consequences of changing biodiversity. Nature. 2000 May; 405(6783):234–42.https://doi.org/10.1038/35012241PMID: 10821284
59. Menon S, Pontius RG Jr, Rose J, Khan ML, Bawa KS. Identifying conservation-priority areas in the trop-ics: a land-use change modeling approach. Conservation Biology. 2001 Apr 8; 15(2):501–12.
60. Elmqvist T, Pyyko¨nen M, Tengo¨ M, Rakotondrasoa F, Rabakonandrianina E, et al (2007) Patterns of Loss and Regeneration of Tropical Dry Forest in Madagascar: The Social Institutional Context. PLoS ONE 2(5): e402.https://doi.org/10.1371/journal.pone.0000402PMID:17476324
61. Gallardo-Cruz JA, Meave JA, Gonza´ lez EJ, Lebrija-Trejos EE, Romero-Romero MA, et al. (2012) Pre-dicting Tropical Dry Forest Successional Attributes from Space: Is the Key Hidden in Image Texture? PLoS ONE 7(2): e30506.https://doi.org/10.1371/journal.pone.0030506PMID:22363443
62. Laurance WF, Useche DC, Rendeiro J, Kalka M, Bradshaw CJ, Sloan SP, et al. Averting biodiversity collapse in tropical forest protected areas. Nature. 2012 Sep; 489(7415):290–4.https://doi.org/10.1038/ nature11318PMID:22832582
63. Giglio L, Boschetti L, Roy DP, Humber ML, Justice CO. The Collection 6 MODIS burned area mapping algorithm and product. Remote Sensing of Environment. 2018 Nov 1; 217:72–85.https://doi.org/10. 1016/j.rse.2018.08.005PMID:30220740
64. Sun Q, Miao C, Duan Q, Ashouri H, Sorooshian S, Hsu KL. A review of global precipitation data sets: Data sources, estimation, and intercomparisons. Reviews of Geophysics. 2018 Mar; 56(1):79–10.
![Table 1. Overview of bioclimatic definitions (Murphy and Lugo, Food and Agriculture Organization of the United Nations [FAO], DryFlor, Aridity Index) of the tropical dry forest biome.](https://thumb-eu.123doks.com/thumbv2/123doknet/14071448.462449/4.918.295.869.912.1007/overview-bioclimatic-definitions-agriculture-organization-nations-dryflor-aridity.webp)
![Table 2. Estimate of tropical dry forest biome area (km 2 ), globally and in different regions, based on four bioclimatic definitions (Murphy and Lugo, Food and Agriculture Organization of the United Nations [FAO], DryFlor, Aridity Index) using two project](https://thumb-eu.123doks.com/thumbv2/123doknet/14071448.462449/7.918.51.870.762.1014/estimate-tropical-globally-different-bioclimatic-definitions-agriculture-organization.webp)
![Table 3. Extent of World Wildlife Fund’s Tropical and Subtropical Dry Broadleaf Forest (TSDBF) ecoregion (km 2 ) and overlap (%) with bioclimatic definitions (Murphy and Lugo, Food and Agriculture Organization of the United Nations [FAO], DryFlor, Aridity](https://thumb-eu.123doks.com/thumbv2/123doknet/14071448.462449/11.918.52.881.147.395/wildlife-tropical-subtropical-broadleaf-bioclimatic-definitions-agriculture-organization.webp)