HAL Id: hal-02644352
https://hal.inrae.fr/hal-02644352
Submitted on 15 Sep 2020
HAL is a multi-disciplinary open access archive for the deposit and dissemination of sci-entific research documents, whether they are pub-lished or not. The documents may come from teaching and research institutions in France or abroad, or from public or private research centers.
L’archive ouverte pluridisciplinaire HAL, est destinée au dépôt et à la diffusion de documents scientifiques de niveau recherche, publiés ou non, émanant des établissements d’enseignement et de recherche français ou étrangers, des laboratoires publics ou privés.
Distributed under a Creative Commons Attribution - NonCommercial - NoDerivatives| 4.0 International License
Inbreeding depression is purged in the invasive insect
Harmonia axyridis
Benoit Facon, Ruth A. Hufbauer, Ashraf Tayeh, Anne Loiseau, Eric Lombaert,
Renaud Vitalis, Thomas Guillemaud, Jonathan G. Lundgren, Arnaud Estoup
To cite this version:
Benoit Facon, Ruth A. Hufbauer, Ashraf Tayeh, Anne Loiseau, Eric Lombaert, et al.. Inbreeding depression is purged in the invasive insect Harmonia axyridis. Current Biology - CB, Elsevier, 2011, 21 (5), pp.424-427. �10.1016/j.cub.2011.01.068�. �hal-02644352�
Inbreeding
Depression Is Purged
in
the Invasive Insect Harmonia axyridis
Benoıˆt Facon,1,*Ruth A. Hufbauer,2Ashraf Tayeh,1
Anne Loiseau,1Eric Lombaert,3Renaud Vitalis,4
Thomas Guillemaud,3Jonathan G. Lundgren,5
and Arnaud Estoup1
1Institut National pour la Recherche Agronomique, UMR - Centre de Biologie pour la Gestion des Populations, Campus International de Baillarguet, CS 30 016, 34988 Montferrier/Lez cedex, France
2Department of Bioagricultural Sciences and Pest
Management, Graduate Degree Program in Ecology, Colorado State University, Fort Collins, CO 80523, USA
3Institut National pour la Recherche Agronomique,
UMR - Laboratoire Interactions Biotiques et Sante´ Ve´ge´tale Universite´ de Nice Sophia-Antipolis, Centre National de la Recherche Scientifique, 06903 Sophia-Antipolis, France 4Institut National pour la Recherche Agronomique, Centre National de la Recherche Scientifique, UMR Centre de Biologie pour la Gestion des Populations, Campus International de Baillarguet, CS 30 016, 34988 Montferrier/Lez cedex, France 5United States Department of Agriculture, Agricultural Research Service, North Central Agricultural Research Laboratory, Brookings, SD 57006, USA
Summary
Bottlenecks in population size reduce genetic diversity and increase inbreeding, which can lead to inbreeding depres-sion [1]. It is thus puzzling how introduced species, which typically pass through bottlenecks, become such success-ful invaders [2]. However, under certain theoretical condi-tions, bottlenecks of intermediate size can actually purge the alleles that cause inbreeding depression [3]. Although this process has been confirmed in model laboratory systems [4], it has yet to be observed in natural invasive populations. We evaluate whether such purging could facil-itate biological invasions by using the world-wide invasion of the ladybird (or ladybug) Harmonia axyridis. We first show that invasive populations endured a bottleneck of intermediate intensity. We then demonstrate that replicate introduced populations experience almost none of the inbreeding depression suffered by native populations. Thus, rather than posing a barrier to invasion as often assumed, bottlenecks, by purging deleterious alleles, can enable the evolution of invaders that maintain high fitness even when inbred.
Results and Discussion
Reductions in population size, or bottlenecks, decrease genetic variation and lead to inbreeding, which can cause inbreeding depression within introduced populations [1]. However, there is growing recognition that the consequences of bottlenecks
[5, 6]. We lack the ability to say whether positive effects of bottlenecks are theoretical curiosities or whether they truly influence the dynamics of natural populations [7]. One mecha-nism by which bottlenecks can have positive effects is through the purging of deleterious mutations that lead to inbreeding depression [8]. Theory states that for purging to occur, the reduction in population size should be of intermediate intensity (i.e., ranging from 40–300 individuals, depending upon intensity of selection) and the mutations leading to inbreeding depres-sion should be strongly deleterious and highly recessive [3, 7]. Such purging of deleterious mutations has been demonstrated empirically in artificially bottlenecked populations [4, 9, 10], but given the conditions imposed, high rates of extinction have been observed. This makes it difficult to directly extrapolate to natural populations [7]. To date, studies documenting a purge of deleterious mutations during bottlenecks are scarce and rely on indirect evidence [5].
The ability of invasive species to dominate novel ecosys-tems has been considered puzzling given that they typically pass through bottleneck in population size during introduc-tions ([2], although see [11]. Such bottlenecks have been seen as detrimental to invasion success; the implicit assump-tion is that they reduce genetic variaassump-tion, and thereby inhibit the ability of introduced species to adapt to their new environ-ments, and that they increase inbreeding and associated inbreeding depression [2]. However, it may be that rather than increasing inbreeding depression, bottlenecks that occur during invasions tend to be of the intensity that could enhance invasion ability via the purging of the deleterious alleles under-lying inbreeding depression.
Here, we use a world-wide invader, the harlequin ladybird Harmonia axyridis (HA), as a model system to examine whether bottlenecks might have led to reduced inbreeding depression in invasive populations relative to native ones. Native to Asia, HA was repeatedly introduced as a biological control agent into North America and Europe, but for decades it failed to establish itself. However, by 1988, it had not only established itself in North America but had also rapidly become an invasive pest on a world-wide scale. A recent study showed that inva-sions of HA followed a bridgehead scenario [12], in which the initial invasive population in eastern North America acted as the source of the invasions into the European, South American, and African continents (Figure 1). This result suggests that an evolutionary shift that triggered invasion probably occurred in the bridgehead population in eastern North America. With this background knowledge, we first use data from neutral genetic markers to test the hypothesis that the introduction of HA in eastern North America was associated with a population bottleneck, and we evaluate whether the size of this bottleneck was of the appropriate level for purging to occur. Then, we experimentally test the hypothesis that invasive populations have evolved reduced inbreeding depression with respect to life-history traits important for invasion success.
into the bridgehead population from eastern North America [12], and we estimated its intensity (seeSupplemental Experi-mental Procedures). Two sets of population samples were considered as representative of the native and introduced areas. In one, we used the same populations as those used for the present quantitative genetics studies, and in the other, we used the same populations as those analyzed in [12] to make inferences about introduction routes in H. axyridis (see
Supplemental Information). We found that a scenario including a bottleneck during the introduction was supported by very high probabilities in comparison to a scenario without a bottle-neck (seeSupplemental Experimental Procedures). The high-est joint posterior densities of the size and duration of the bottleneck corresponded to values around 150 individuals and 20 generations compared to an estimated stable effective population size of several thousand individuals in the native area (Figure 2). Similar results were obtained when we consid-ered other sets of priors and data sets (Figure S1). These results are well within the theoretical range that can lead to the purging of deleterious alleles [3]. However, it has to be noted that theoretical work is still needed to assess the range of magnitudes and durations of bottlenecks that make purging likely after introduction from a large equilibrium population. Indeed, up to now, theoretical studies investigating the purging of recessive mutations have mainly focused on muta-tion-selection-drift equilibrium populations.
To test the premise that purging might have occurred during the invasion of HA, we brought six natural field populations into the laboratory and compared their fitness (Figure 1and
Supplemental Experimental Procedures) under two contrast-ing levels of consanguinity (inbred versus outbred). By uscontrast-ing three replicate populations from both the native and the inva-sive ranges, we could evaluate differences between the ranges robustly, providing a potent test of how the response to inbreeding is affected by population status (native versus inva-sive; see Supplemental Experimental Procedures). We measured two traits clearly linked to fitness: generation time and lifetime performance. Generation time is an important trait to examine with respect to invasions because a shorter gener-ation time leads to faster populgener-ation growth [15]. Our measure of lifetime performance accounts for both survival through the life stages and subsequent reproduction. It thus represents individual fitness well, and it is independent of generation time (Supplemental Experimental Procedures).
1988 1991 2001 2004 2001 DAK SAF A B A A R F NOV KYO
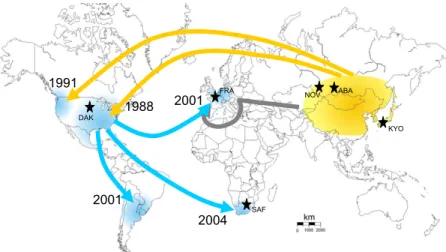
Figure 1. Worldwide Routes of Invasion of Harmonia axyridis
For each outbreak, the arrow indicates the most likely invasion pathway [12]. Yellow and blue indicate native and invasive areas, respectively. Years of first observa tion of invasive populations are indicated. Abbreviations correspond to the samples used in the experimental study (see Experimental Procedures for further explana tions).
We found that the generation time of inva-sive populations is on average 6.3 days shorter than that of native populations (p = 0.0005). Invasion status and level of consanguinity interact (p = 0.047; Figure 3 and Table S1) such that the difference is most apparent in inbred individuals. Native populations suffer strong inbreeding depression with respect to generation time (coefficient of inbreeding depression, d = 0.21, p = 0.03), whereas invasive populations suffer none (d = 20.05, p = 0.57) and are thus able to maintain the outbred phenotype. A significant population effect nested within the origin effect (Table S1) reveals that one native population (Abakan, Russia) exhibits a longer generation time in outbred treatment than the other native populations, implying no significant inbreeding depression for this trait in this population. As for generation time, invasive populations have higher average lifetime performance than native ones (p = 0.02), and there is a strong interaction between invasion status and level of consanguinity (p = 0.001; Figure 3 and
Table S1). In general, native populations suffer intense inbreeding depression (d = 0.59, p < 0.001), whereas invasive populations do not (d = 0.12, p = 0.16).
For both traits, invasive individuals exhibit a decline in inbreeding depression and are thus able to maintain the high performance of the outbred phenotype. Inbred invasive indi-viduals developed more quickly and attained a higher lifetime performance than native ones (p = 0.0005 and 0.0057, respec-tively), indicating that inbreeding depression decreased within invasive populations, which is consistent with the predicted purging of recessive deleterious mutations. Moreover, inbred lines from invasive populations developed just as quickly and attained just as high lifetime performance as outbred lines from both invasive and native populations (Figure 3). Purging leads to an overall increase in performance of the invasive populations for these two traits closely linked to fitness, and it might thus have boosted the invasiveness of HA. Indeed, by shortening average generation time and increasing average lifetime performance, the drop in inbreeding depression might increase the population growth rate of invasive populations. Our two main results, evidence of a type of bottleneck consis-tent with the purging of alleles that lead to inbreeding depres-sions (i.e., a bottleneck of intermediate intensity) and evidence of such purging in two fitness-related traits, together match the theoretical expectations well. Moreover, theory [3, 5] illus-trates that the greatest purging occurs when inbreeding depression is mainly due to mutations that are both strongly deleterious and highly recessive, suggesting that inbreeding depression in native populations of HA probably stems from highly recessive and strongly deleterious mutations.
Several theoretical [3, 16] and empirical [8, 17, 18] studies establish that consanguineous mating increases the efficiency of purging. Geographical spread during the invasion process
can promote consanguineous mating in the invasion front. Density in the front can be very low [19], setting up a situation in which individuals from the same clutch have only each other to mate with. In this scenario, purging could be further facili-tated in invasive populations and could occur for a broader range of population sizes and in populations with less strongly recessive deleterious mutations.
The invasive populations used in our study are connected by their recent history [12]: the eastern North American invasive population is the main source of the South African and Euro-pean invasive populations. It is hence probable that the reduc-tion in inbreeding depression evolved only once, in eastern North America, and was subsequently transmitted to the other invasive populations. This mechanism could be responsible for the North American’s status as an invasive bridgehead. Because we obviously could not sample all locations within the native range of HA, we cannot completely reject the hypothesis that purging of deleterious alleles occurred within the native range in an unknown way. The hypothesis that purging occurred in the introduced range during the bottle-neck period is nevertheless far more parsimonious.
without being slowed by inbreeding depression if recessive deleterious alleles have been purged. Second, our findings might explain the ‘‘lag time’’ of invasions: the period of time that is often observed between initial introductions and subse-quent invasions [20]. This lag time could be due to negative population growth and initially high rates of local extinction associated with the purging of the deleterious alleles. Once the recessive deleterious alleles are purged, explosive popula-tion growth would follow. In HA, it could be that a high rate of extinction of inbred populations contributed to the repeated failures of efforts to establish populations for biological control. Third, our results might explain the finding that invasive populations often have higher performance than native ones even when reared in a common environment. This has been attributed mainly to adaptation to the new range [21–23]. However, a purging of inbreeding depression could explain, at least partly, the increase in performance without invoking local adaptation. This mechanism could be particu-larly appropriate when there is no obvious adaptive challenge associated with the new introduced environment, as sus-pected for HA. Finally, a shift toward selfing has been observed in some invasive plants [24, 25]. Inbreeding depres-sion is considered to be one of the main forces opposing the evolution of self-fertilization [26]. A reduction in genetic load during invasions could thus promote a shift from outcrossing toward selfing in invasive plant populations.
Our results link, for the first time in natural populations, bottlenecks of intermediate size during invasion with purging of deleterious mutations. This purging results in the evolution of populations that experience no inbreeding depression in important fitness traits and leads to higher mean fitness rela-tive to narela-tive populations. Thus, not only might bottlenecks not pose the problems previously assumed for invasive species [27], but they might actually facilitate invasion. This kind of purging should be particularly important during the first stages of the invasion (when there is a small effective popula-tion size) and during the spatial expansion (at the front of inva-sion), i.e., when mating between relatives is likely to occur most frequently. After this stage, when invasive populations reach a large, stable effective population size, it might be that new deleterious mutations start to accumulate, and thus inbreeding depression might return to invasive populations.
Lifetime Perfor mance 5 10 15 20 25 30 35 40 Inbred Outbred Gen e ration time (day s)15 20 25 30 35 40 Inbred Outbred
Figure 3. Generation Time and Lifetime Performance of Native versus Inva sive Populations and Consanguinity of Inbred versus Outbred Populations Circles represent native populations, and squares represent invasive ones. Note that the y axis shows low values of generation time, which correspond to high fitness, at the top, and high values of generation time (low fitness) at the bottom. Mean values are61.96 standard error. See alsoTable S1.
0 50 100 150 200 250 300 0 5 10 15 20 25 30
Number of individuals during bottleneck
Bo tt e n e ck d u ra t o n 90% 90% 80% 70% 60% 50% 40% 30% 20% 10%
Figure 2. Intensity of the Bottleneck Event Following the Introduction of Harmonia axyridis in Eastern North America from Its Native Area The joint densities of posterior distributions for the correlated pair of demo graphic parameters number of individuals during bottleneck and bottleneck duration (in number of generations) were obtained via ABC analysis of mi crosatellite data under the introduction scenario 1 (Figure S1); prior set 1 was assumed (Table S1), and population samples were from Kyoto (Japan) and Brookings (South Dakota, USA), taken as representative of the native and introduced areas, respectively (i.e., the samples were from the same populations as those used for the experiment). SeeExperimental Proce duresfor justification of population sampling andFigure S2for complemen tary results obtained with different priors and sampling combinations. The black lines represent the 10% 90% highest density contours of the plot of joint densities. Median value of the stable effective population size before and after the bottleneck period was estimated at 2940 individuals (95% confidence interval: 1220 8930). See alsoFigure S1.
1. Nei, M., Maruyama, T., and Chakraborty, R. (1975). The bottleneck effect and genetic variability in populations. Evolution 29, 1 10.
2. Simberloff, D. (2009). The role of propagule pressure in biological inva sions. Annu. Rev. Ecol. Syst. 40, 81 102.
3. Gle´min, S. (2003). How are deleterious mutations purged? Drift versus nonrandom mating. Evolution 57, 2678 2687.
4. Swindell, W.R., and Bouzat, J.L. (2006). Reduced inbreeding depression due to historical inbreeding in Drosophila melanogaster: Evidence for purging. J. Evol. Biol. 19, 1257 1264.
5. Bouzat, J.L. (2010). Conservation genetics of population bottlenecks: The role of chance, selection, and history. Conserv. Genet. 11, 463 478.
6. Goodnight, C.J. (1988). Epistatic genetic variance and the effect of founder events on the additive genetic variance. Evolution 42, 441 454. 7. Boakes, E.H., Wang, J., and Amos, W. (2007). An investigation of inbreeding depression and purging in captive pedigreed populations. Heredity 98, 172 182.
8. Pujol, B., Zhou, S.R., Sanchez Vilas, J., and Pannell, J.R. (2009). Reduced inbreeding depression after species range expansion. Proc. Natl. Acad. Sci. USA 106, 15379 15383.
9. Crnokrak, P., and Barrett, S.C.H. (2002). Perspective: Purging the genetic load: A review of the experimental evidence. Evolution 56, 2347 2358.
10. Avila, V., Amador, C., and Garcı´a Dorado, A. (2010). The purge of genetic load through restricted panmixia in a Drosophila experiment. J. Evol. Biol. 23, 1937 1946.
11. Kolbe, J.J., Glor, R.E., Rodrı´guez Schettino, L., Lara, A.C., Larson, A., and Losos, J.B. (2004). Genetic variation increases during biological invasion by a Cuban lizard. Nature 431, 177 181.
12. Lombaert, E., Guillemaud, T., Cornuet, J.M., Malausa, T., Facon, B., and Estoup, A. (2010). Bridgehead effect in the worldwide invasion of the biocontrol harlequin ladybird. PLoS ONE 5, e9743.
13. Beaumont, M.A., Zhang, W.Y., and Balding, D.J. (2002). Approximate Bayesian computation in population genetics. Genetics 162, 2025 2035.
14. Cornuet, J.M., Santos, F., Beaumont, M.A., Robert, C.P., Marin, J.M., Balding, D.J., Guillemaud, T., and Estoup, A. (2008). Inferring population history with DIY ABC: A user friendly approach to approximate Bayesian computation. Bioinformatics 24, 2713 2719.
15. Cole, L.C. (1954). The population consequences of life history phenomena. Q. Rev. Biol. 29, 103 137.
16. Wang, J. (2000). Effects of population structures and selection strate gies on the purging of inbreeding depression due to deleterious muta tions. Genet. Res. 76, 75 86.
17. Barrett, S.C.H., and Charlesworth, D. (1991). Effects of a change in the level of inbreeding on the genetic load. Nature 352, 522 524. 18. Fox, C.W., Scheibly, K.L., and Reed, D.H. (2008). Experimental evolution
of the genetic load and its implications for the genetic basis of inbreeding depression. Evolution 62, 2236 2249.
19. Tobin, P.C., Whitmire, S.L., Johnson, D.M., Bjørnstad, O.N., and Liebhold, A.M. (2007). Invasion speed is affected by geographical vari ation in the strength of Allee effects. Ecol. Lett. 10, 36 43.
20. Crooks, J.A. (2005). Lag time and exotic species: The ecology and management of biological invasions in slow motion. Ecoscience 12, 316 329.
21. Lee, C.E. (2002). Evolutionary genetics of invasive species. Trends Ecol. Evol. 17, 386 391.
22. Facon, B., Genton, B.J., Shykoff, J., Jarne, P., Estoup, A., and David, P. (2006). A general eco evolutionary framework for understanding bioin vasions. Trends Ecol. Evol. (Amst.) 21, 130 135.
23. Blair, A.C., and Wolfe, L.M. (2004). The evolution of an invasive plant: An experimental study with Silene latifolia. Ecology 85, 3035 3042. 24. Barrett, S.C.H., Colautti, R.I., and Eckert, C.G. (2008). Plant reproductive
systems and evolution during biological invasion. Mol. Ecol. 17, 373 383.
25. Sloop, C.M., Ayres, D.R., and Strong, D.R. (2009). The rapid evolution of self fertility in Spartina hybrids (Spartina alterniflora x foliosa) invading San Francisco Bay, CA. Biological Invasions 11, 1131 1144.
26. Charlesworth, D., and Willis, J.H. (2009). The genetics of inbreeding depression. Nat. Rev. Genet. 10, 783 796.
27. Dlugosch, K.M., and Parker, I.M. (2008). Invading populations of an ornamental shrub show rapid life history evolution despite genetic bottlenecks. Ecol. Lett. 11, 701 709.
France, Brookings [DAK] in South Dakota USA, and Bethlehem [SAF] in South Africa) were sampled in the wild between 2007 and 2008. The loca tions were chosen because they cover major parts of the current native and introduced distribution of H. axyridis (Figure 1), and the native range populations are within the region likely to have been the source of the inva sion [12]. In each population, 80 100 adults were collected. See Supple mental Information for further details on sampled populations.
Inferences about the Bottleneck Event
Two field collected samples, Kyoto and Brookings, representing the native and bridgehead invasive populations, respectively, were genotyped at 18 microsatellite markers. Using approximate Bayesian computation (ABC), we analyzed two competing introduction scenarios that differed by the presence or absence of a bottleneck event after introduction. We assessed the robustness of our ABC inferences by considering two different sets of prior distributions and by processing our analyses on a second microsatellite data set that included other representative population samples (see Supplemental Experimental Procedures).
Quantitative Genetic Experiment
For each of the six populations sampled, 100 field collected (G0) individuals
initiated populations in the laboratory. We maintained these populations for two generations under strictly controlled conditions to minimize potential biases due to maternal effects (see Supplemental Information). We then created two types of crosses: inbred (between pairs of siblings) and outbred (between unrelated individuals of the same population). For the two types of G3 individuals produced, we measured hatching rate, larval
survival, development time, time to sexual maturity, and fecundity. Finally, we analyzed two combined traits linked to fitness: generation time and lifetime performance (see Supplemental Experimental Procedure). To calculate generation time, we added egg to adult development time and time to reach sexual maturity into a single cumulative measure. We obtained a measure of lifetime performance by multiplying hatching rate by larval survival by subsequent fecundity for each family and cross. We analyzed these data by using mixed model ANOVAs. Origin (invasive versus native), treatment (inbred versus outbred), population nested in origin, and their interactions were entered as fixed effects. Family nested within population was treated as a random effect.
Supplemental Information
Supplemental Information includes Supplemental Experimental Proce dures, one figure, and one table and can be found with this article online at
doi:10.1016/j.cub.2011.01.068.
Acknowledgments
We thank L. Wolfe and D. Bourguet for comments and discussion on an earlier draft. We thank I. Goryacheva, I. Zakharov, N. Osawa, R. Stals, and G. Prinsloo, who provided us with some of the HA samples used in this study. This work was supported by grants from the Agence Nationale de la Recherche (ANR 06 BDIV 008 01) and from the Agropolis Fondation (RTRA, Montpellier, BIOFIS project). R.A.H. received support from Fulbright France, INRA, NSF DEB 0541673 and the Colorado Agricultural Experiment Station during this work.
Table S1 (Related to Figure 3). Results of statistical analyses for lifetime performance and generation time. Population-level means for generation time are added due to the significance of the population effect for this trait.
Sources Test statistic P
(A) Lifetime Performance
Fixed effects F (df)
treatment 26,91 (1;45,3) <0,0001
origin 5,77 (1;47,4) 0,0203
population (origin) 0,24 (4;46,4) 0,9152
origin × treatment 11,97 (1;45,3) 0,0012
pop (origin) × treatment 1,91 (4;43,8) 0,1251
Random effect Wald test
fam(pop) 1.41 0.0789
(B) Generation time Population-level means
Fixed effects F (df) Inbred Outbred
treatment 1,72 (1;45,7) 0,1962
Invasive populations
origin 13,90 (1;46,1) 0,0005 CRO 20.55 23.76
population (origin) 2,60 (4;45) 0,0486 DAK 22.77 21.33
origin × treatment 4,15 (1;45,7) 0,0474 SAF 23.76 24.66
pop (origin) × treatment 0,56 (4;44,4) 0,6956
Native populations
Random effect Wald test ABA 34.01 32.28
fam(pop) 0.30 0.3817 KYO 26.91 21.53
3
Figure S1 (Related to Figure 2). Intensity of bottleneck event following the introduction of H. axyridis in eastern North America from its native area: robustness of results. The presented joint posterior densities of number of individuals during bottleneck and bottleneck
duration (in number of generations) were all obtained using ABC analysis of microsatellite data under the introduction scenario 1 (Figure S2). In (A), the analysis was achieved using the prior set 2 (Table S2) and data set 1 (Table S3). In (B) and (C), we used the prior set 1 and 2 (Table S2), respectively, and the data set 2 (Table S3). The black lines represent the 10 to 90% highest density contours of the plot of joint densities. Median values of the stable effective population size before and after the bottleneck period were 6090 individuals (95% confidence interval: 1220 – 8930) for (A), 7890 (95% CI: 4250 – 14460) for (B) and 11200 (95% CI: 5280 – 17600) for (C).
Supplemental Experimental Procedures
Biological material
Harmonia axyridis is native to Asia and invasive in North and South America, Europe, and Africa. It originally was introduced into North
America and Europe as a biological control agent against aphids [28]. Despite repeated introductions, initiated in 1916 in North America and in 1982 in Europe, it did not establish readily. Suddenly, it not only established, but became invasive in four different continents. The invasion of North America started first, in 1988 [29], Europe and South America were invaded in 2001 [30, 31] and Africa in 2004 [32]. It is now considered to be a pest, and a harmful predator of non-target arthropods, a household invader, and a pest of fruit production [28]. Lombaert et al. [12] used Approximate Bayesian Computation on microsatellite data to demonstrate that the invasion followed what has been called a bridgehead scenario, with the oldest invasive population in eastern North America acting as the source, or bridgehead, for the colonists that invaded Europe, South America and Africa with some admixture with a biological control strain in the case of Europe (Figure 1).
Population sampling
Three live native populations and three live invasive populations were sampled in the wild between 2007 and 2008. The locations were chosen to cover major parts of the current distribution of H. axyridis (Figure 1) and to encompass the native regions used for biological control sampling [12]. The native range samples were from Kyoto (Japan, KYO), Novosibirsk and Abakan (Russia, NOV and ABA respectively). The
5 invaded range samples included Croix (France, FRA), Brookings (South Dakota, USA, DAK) and Bethlehem (South Africa, SAF) (Figure 1). In each population around 100 adults were collected (with ~1:1 sex ratio). It could be argued that only representative native and introduced
populations have been sampled, and not necessarily the actual source and introduced HA populations. It is worth stressing, however, that we genotyped at 18 microsatellite markers [33] a large number of HA population samples collected within the eastern and western parts of the native range (9 locations) as well as within all invaded areas (more than 50 locations). Such analysis processed at selectively neutral markers confirms the genetic homogeneity of invasive populations within each area, except parts of Europe and to a lesser extent, South America (EL and AE, unpublished results). Therefore, the population samples used in this study, either for life history trait analysis or bottleneck analysis (see below), are likely to provide an appropriate representation of the main native and invasive populations over large geographic areas. Our sample size of three live populations per range (native and introduced) for life history trait analysis is, as required by logistical constraints, relatively low, While this lessens our statistical power to discern differences between the native and introduced range populations, differences we do find are likely to be ecologically significant.
Approximate Bayesian computation (ABC) to make inferences about the bottleneck event during introduction
Native populations of Harmonia axyridis in eastern Asia were genetically homogeneous over large geographic distances and introduced populations in eastern North America were homogeneous over large geographic distances (unpublished results, see also [12]). The bridgehead invasion scenario illustrated in Figure 1 brought us to focus our ABC estimations of the demographic parameters on the bottleneck event that
occurred during the introduction from the native range in eastern Asia into eastern North America. Two sets of population samples were considered. In a first sampling set, we used field-collected samples from the same populations than those used for the present quantitative genetics studies, i.e. Kyoto (Japan; n = 26) and Brookings (South Dakota, USA; n = 30), as representative of the native and introduced areas, respectively. In a second sampling set, we used field collected population samples similar to those analysed in [12] to make inferences about introduction routes in H. axyridis. More precisely, we used a pool of individuals collected in eastern Asia (Beijing - China, Shilin city - China and Fuchu – Japan; n = 99) and individuals collected in the first H. axyridis invasive foci observed in eastern North America (Joyce – Louisiana - USA; n = 34) as representative of the native and introduced areas, respectively. Details on this second set of population samples can be found in the Table S2 of [12]. We genotyped the two sets of population samples at the same 18 microsatellite markers [33].
Genetic variation within and between populations was summarized using a set of statistics traditionally employed in ABC [13, 34] (Table S3). We considered two competing introduction scenarios that differed by the presence or absence of a bottleneck event following introduction (Figure S2). The ABC analyses were performed using parameter values drawn from the prior distributions described in Table S2 and by simulating 2 x 10⁶ microsatellite data sets for each competing scenario. We estimated the posterior probabilities of the competing scenarios using a polychotomous logistic regression on the 1% of simulated data sets closest to the observed data set, as defined by Euclidian distances [14]. The selected scenario is that with the highest probability value with no overlapping of the 95% confidence interval. We then estimated the posterior distributions of demographic parameters under the selected scenario (i.e. the introduction scenario with a bottleneck event; see Figure S2) using a local linear regression on the 1% closest of 2 x 10⁶ simulated data sets [13]. The joint posterior densities of the demographic parameters of
7 interest, i.e. the effective number of individuals during bottleneck and the bottleneck duration (in number of generations), were estimated using the geneplotter R package [35]. The 10 to 90% highest density contours obtained using a personal R function based on the library locfit were then superimposed on the plot. The robustness of our ABC inferences were assessed considering two different sets of prior distributions and by processing our analyses on the two different data sets described above and in Table S2.
Table S2. Two sets of prior distributions of demographic, historical and mutation parameters used in ABC analyses
Notes: The time of first observation (To) was translated into generation numbers running back in time from sampling time in 2007 to first
observation in eastern North America in year 1988 by assuming 2.5 generations per year in prior set 1, and 3 generations per year in prior set 2.
Ns = stable effective population size (number of diploid individuals); Nb = effective number of individuals during the post-introduction bottleneck
period lasting Db generation(s). For microsatellite marker parameters, the loci were assumed to follow a generalized stepwise mutation model
[39] with two parameters: the mean mutation rate () and the mean parameter of the geometric distribution ( P ) of the length in number of repeats of mutation events. Each locus has a possible range of 40 contiguous allelic states and is characterized by individual µloc and Ploc values, with µloc and Ploc drawn from a Gamma (mean = and shape = 2) and a Gamma (mean = P and shape = 2) distribution, respectively [40]. Uneven insertion/deletion events that were detected for several of our microsatellite loci based on observed allele sizes (i.e. allele lengths were sometimes not multiple of the motif length implying that there has been insertion-deletion mutations [39, 41]) were also simulated with a mean mutation rate SNI (for single nucleotide instability) and SNIloc drawn for each locus from a Gamma (mean = SNI and shape = 2).
Boundaries of distributions are in brackets. Parameters of Normal and Gamma distributions are in parentheses. In prior set 2, Normal, Loguniform and Gamma distributions are truncated between the same boundaries as in prior set 1. All prior quantities presented were computed from 100,000 values. NA = not applicable.
Prior Set 1 Prior Set 2
parameters Distribution Mean Median Mode Quantile 2.5%
Quantile 97.5%
Distribution Mean Median Mode Quantile 2.5% Quantile 97.5% Ns Uniform [100 – 20,000] 10,056 10,040 NA 640 19,490 Normal (10,000 ; 5,000) 9,993 9,990 9,980 1,640 18,340 Nb Uniform [1 – 300] 151 151 NA 8 292 Uniform [1 – 300] 151 508 NA 8 292 Db Uniform [1 – 30] 15 15 NA 1 29 Uniform [1 – 30] 15 15 NA 1 29 T0 Fixed at 47 generations NA NA NA NA NA Fixed at 58 generations NA NA NA NA NA Uniform [10-5 – 10-3] 5.0x10⁻⁴ 5.0x10⁻⁴ NA 3.5x10⁻⁵ 9.8x10⁻⁴ Loguniform [10-5 – 10-3] 2.1x10⁻⁴ 1.0x10⁻⁴ 1.0x10⁻⁵ 1.1x10⁻⁵ 8.9x10⁻⁴ P Uniform [0.1 – 0.3] 0.2 0.2 NA 0.10 0.29 Gamma (30 ; 136) 0.22 0.22 0.21 0.15 0.29 SNI Uniform [10-8 – 10-4] 5.0x10⁻⁵ 5.0x10⁻⁵ NA 2.5x10⁻⁶ 9.7x10⁻⁵ Loguniform [10-8 – 10-4] 1.1x10⁻⁵ 1.0x10⁻⁶ 1.0x10⁻⁸ 1.3x10⁻⁸ 7.9x10⁻⁵
9
Table S3. Summary statistics of microsatellite data used for ABC analysis of bottleneck event with the corresponding observed values in the two sets of analyzed H. axyridis population samples.
Note: N = native population sample; I = introduced population sample. Data set 1 = we used population samples from Kyoto (Japan) and Brookings (South Dakota, USA) as representative of the native and introduced areas, respectively. Data set 2 = we used a pool of individuals collected in eastern Asia (Beijing - China, Shilin city - China and Fuchu - Japan) and individuals collected in the first H. axyridis invasive foci observed in USA (Louisiana) as representative of the native and introduced areas, respectively. NAL_i = mean number of alleles in the native (i = N) or introduced (i = I) population, HET_i = mean expected heterozygosity [42], VAR_i = mean allelic size variance, MGW_i = mean ratio of the number of alleles over the range of allele sizes [43], Fst = Fst value between the native and introduced populations [44], LIK_i_j = mean individual assignment likelihoods of population i assigned to population j [41], H2P = mean expected heterozygosity pooling samples from the native and introduced populations, V2P = mean expected heterozygosity pooling samples the native and introduced populations. Populations N and I correspond to the populations 1 and 2 in Figure S2 respectively.
Summary Observed value
statistics Data set 1
(nN = 26; nI = 30) Data set 2 (nN = 99; nI = 34) NAL_N 6.9444 10.3333 NAL_I 5.4444 5.8889 HET_N 0.5865 0.6007 HET_I 0.5674 0.5530 VAR_N 2.8448 2.7893 VAR_I 2.7469 2.5955 MGW_N 1.0176 0.9015 MGW_I 0.9577 0.9394 N2P 8.0556 10.8333 H2P 0.5810 0.5922 V2P 2.8085 2.7668 FST 0.0333 0.0170 LIK_N_I 1.3392 1.2088 LIK I N 1.2234 1.0408
11
Figure S2. Graphic representation of the two competing scenarios considered in ABC analysis of microsatellite data focusing on the
introduction of H. axyridis in eastern North America (Pop 2) from its native area (Pop 1).
Notes: To and Time 0 are the first observation year in eastern North America (1988) and the sampling year (2007), respectively. The scenarios 1 and 2 correspond to an introduction with and without a bottleneck event with Nb individuals during Db generations, respectively. All parameters with associated prior distributions are described in Table S2. Ns stands for the stable effective population size. The green line corresponds to the relative position of the bottleneck.
13
Quantitative genetic experiment
For each of the six populations sampled, we created families with inbred and outbred branches, and then compared their performance to evaluate whether introduced populations exhibit a different level of inbreeding depression than native populations (Figure S3). First, field sampled individuals (G0) were used to initiate populations in the laboratory that were maintained for two generations under strictly controlled conditions to minimize potential biases due to maternal effects (Figure S3). For these first generations and the rest of the experiment, individuals were fed with ionized Ephestia kuehniella (Lepidoptera: Pyralidae) eggs and maintained at 23 °C, 65% relative humidity, with a photoperiod of L:D 14:10. From the G0 individuals, we created around 50 pairs to produce the following generation by keeping one new male and female from each pair. We then randomly created 50 pairs of G1 individuals to produce the G2 individuals in the same way. During this step, males and females were separated immediately after emergence to prevent mating. They were then maintained in the same environmental conditions for two weeks to ensure that all individuals had reached reproductive maturity. All this procedure allowed us to minimize the risk of purging or fixation of deleterious alleles.
The experiment started with the creation of the third generation. Mature G2 adults were used to create two types of crosses: inbred and outbred. Inbred crosses were between pairs of siblings, and outbred were between unrelated individuals of the same population. At the end of the experiment, we genotyped all the parents at eighteen microsatellites [33] and confirmed the difference of kinship between the two types of crosses for both native and invasive populations using the software SPAGeDi [36] (average kinship: 0.21 and -0.08 for native inbred and outbred
crosses, respectively, and 0.18 and -0.02 for invasive inbred and outbred crosses, respectively). We employed this protocol for 10 families per population, where each family was initiated with two sisters: one mated with a brother and one mated with an unrelated male. We collected and isolated two clutches of G3 eggs with at least 20 eggs per clutch from each couple. At the day of hatching (the fourth day), 8 larvae were
randomly chosen and each isolated for individual monitoring in a small cylindrical box (height = 2 cm; diameter = 5 cm).
The following traits were measured on the eggs and larvae (Figure S3). (i) Hatching rate was determined by counting eggs from all clutches and recording the number of living larvae after four days divided by the number of eggs in the clutch. (ii) Larval survival was scored daily. (iii) Development time was recorded as the period it took for individuals to develop from an egg into an adult.
A subset of individuals reaching adulthood was used for two additional measurements (iv – v). Ten days after emergence, one female per family and per cross was presented with potential mates. Each female was presented with a single male for a period of 24 hrs, and this was repeated three times with three different males during the course of a week. This procedure minimized density effects (e.g., delayed growth or reduced fecundity in paired individuals due to competition) while leaving time for multiple copulations to occur. Males were randomly chosen from the stock colony obtained with different mixing of individuals from the six populations to minimize bias due to male identity. (iv) Time to sexual maturity was estimated for the mated females by scoring the day when each first laid a clutch of eggs. At a maximum, we followed females for 60 days, after which we noted a failure to reproduce at all. (v) Fecundity was estimated as the number of eggs laid during the first eight days after the start of oviposition.
15
Figure S3. The rearing of H. axyridis, creation of inbred and outbred lines, and performance measurements taken. G0 individuals
were collected from six field sites, and used to initiate G1 colonies reared in uniform conditions. Ten G2 families from each site were used to create inbred and outbred lineages of each family. Numbering of measured traits follows the description in Supplemental Experimental Procedures.
Field collections (80-100 ind.) per site
3 native sites
3 invasive sites
G0
G1
Creation of 10 families
per population
G2
Creation of inbred and outbred
branches of each family
G3
Rearing under uniform conditions
Field collections (80-100 ind.) per site
3 native sites
3 invasive sites
G0
G1
Creation of 10 families
per population
G2
Creation of inbred and outbred
branches of each family
G3
Data analysis
We analyzed two combined traits linked to fitness for the experimental G3 individuals: generation time and lifetime performance. To calculate generation time, we added egg-to-adult development time and time to reach sexual maturity into a single cumulative measure. Lifetime performance was obtained by multiplying hatching rate by larval survival by subsequent fecundity for each family and cross.
These data were analyzed using mixed-model ANOVAs (PROC MIXED, [37]). Origin (invasive vs. native), treatment (inbred vs. outbred), population nested in origin and their interactions were entered as fixed effects. Family nested within population was treated as random effect. A difference in the strength of inbreeding depression between native and invasive populations is revealed by the interaction term origin ×
i. Hatching rate (2 clutches)
ii. Larval survival (8 larvae)
eggs
larvae
adults
eggs
iii. Development time
v. Fecundity (1 female)
iv. Time to sexual maturity i. Hatching rate
(2 clutches)
ii. Larval survival (8 larvae)
eggs
larvae
adults
eggs
iii. Development time
v. Fecundity (1 female)
iv. Time to sexual maturity
17 treatment. We used linear estimates (ESTIMATE statement) to evaluate the direction and significance of differences between inbred and outbred within origins. Finally, for each trait, we calculated the proportional reduction in fitness due to inbreeding depression (δ) following Fox [38]. For generation time, δ = (Meaninbred – Meanoutbred)/Meanoutbred (the proportional increase of generation time), and for lifetime performance δ =
References
28. Koch, R. L. (2003) The multicolored Asian lady beetle, Harmonia axyridis: A review of its biology, uses in biological control, and non-target-impacts. J. Insect Sci. 3, 1-16.
29. Chapin, J. B., and Brou, V. A. (1991) Harmonia axyridis (Pallas). The third species of the genus to be found in the United States (Coleoptera: Coccinellidae). Proc. Entomol. Soc. Wash. 93, 630-635.
30. Adriaens, T., Branquart, E., and Maes, D. (2003) The multicoloured Asian Ladybird Harmonia axyridis Pallas (Coleoptera: Coccinellidae), a threat for native aphids predators in Belgium. Belg. J. Zool. 133, 195-196.
31. Saini, E. D. (2004) Presencia de Harmonia axyridis (Pallas) (Coleoptera: Coccinellidae) en la provincia de Buenos Aires. Aspectos biologicos y morfologicos. RIA 33, 151-160.
32. Stals, R., and Prinsloo, G. (2007) Discovery of an alien invasive, predatory insect in South Africa : the multicoloured Asian ladybird beetle,
Harmonia axyridis (Pallas) (Coleoptera: Coccinelidae). S. Afr. J. Sci. 103, 123-126.
33. Loiseau, A., Malausa, T., Lombaert, E., Martin, J. F., and Estoup, A. (2009) Isolation and characterisation of microsatellites in the harlequin ladybird, Harmonia axyridis (Coleoptera, Coccinellidae), and cross-species amplification within the family Coccinellidae. Mol. Ecol. Res. 9, 934-937 (2009).
19 approximate Bayesian computation on microsatellite data. Heredity 104, 88-99.
35. Ihaka, R., and Gentleman, R. (1996) R: a language for data analysis and graphics. J. Comput. Graph. Stat. 5, 299-314.
36. Hardy, O. J., and Vekemans, X. (2002) SPAGeDI: a versatile computer program to analyse spatial genetic structure at the individual or population levels. Mol. Ecol. Notes 2, 618-620.
37. The SAS System for Windows, release 9.1. (2003) SAS Institute, Cary, North Carolina, USA, SAS Institute.
38. Fox, C. W. (2005) Problems in measuring among-family variation in inbreeding depression. Am. J. Bot. 92, 1929-1932.
39. Estoup, A., Jarne, P., and Cornuet, J. M. (2002) Homoplasy and mutation model at microsatellite loci and their consequences for population genetics analysis. Mol. Ecol. 11, 1591-1604.
40. Verdu, P., Austerlitz, F., Estoup, A., Vitalis, R., Georges, M., Théry, S., Froment, A., Le Bomin, S., Gessain, A., Hombert, J. M., et al. (2009) Origins and genetic diversity of pygmy hunter-gatherers from Western Central Africa. Curr. Biol. 19, 312-318.
41. Pascual, M., Chapuis, M. P., Mestres, F., Balanya, J., Huey, R. B., Gilchrist, G. W., Serra, L., and Estoup, A. (2007) Introduction history of Drosophila subobscura in the New World : a microsatellite-based survey using ABC methods. Mol. Ecol. 16, 3069-3083.
42. Nei, M. (1987) Molecular Evolutionary Genetics. Columbia University Press, New York.
43. Excoffier, L., Estoup, A., and Cornuet, J. M. (2005) Bayesian analysis of an admixture model with mutations and arbitrarily linked markers. Genetics 169, 1727-1738.