HAL Id: hal-01544871
https://hal.archives-ouvertes.fr/hal-01544871
Submitted on 22 Jun 2017
HAL is a multi-disciplinary open access
archive for the deposit and dissemination of
sci-entific research documents, whether they are
pub-lished or not. The documents may come from
teaching and research institutions in France or
abroad, or from public or private research centers.
L’archive ouverte pluridisciplinaire HAL, est
destinée au dépôt et à la diffusion de documents
scientifiques de niveau recherche, publiés ou non,
émanant des établissements d’enseignement et de
recherche français ou étrangers, des laboratoires
publics ou privés.
M.P. Ferreira, M. Zortea, D.C. Zanotta, J.B. Feret, Y.E. Shimabukuro, C.R.
Filho
To cite this version:
M.P. Ferreira, M. Zortea, D.C. Zanotta, J.B. Feret, Y.E. Shimabukuro, et al.. On the use of shortwave
infrared for tree species discrimination in tropical semideciduous forest. ISPRS Geospatial Week
2015, Sep 2015, La Grande Motte, France. pp.473-476, �10.5194/isprsarchives-XL-3-W3-473-2015�.
�hal-01544871�
ON THE USE OF SHORTWAVE INFRARED FOR TREE SPECIES DISCRIMINATION
IN TROPICAL SEMIDECIDUOUS FOREST
M. P. Ferreira a*, M. Zorteab, D. C. Zanottac, J. B. Féretd, Y. E. Shimabukuroa, C. R. Souza Filhoe
a
National Institute for Space Research (INPE), São José dos Campos, Brazil - (mpf,yosio)@dsr.inpe.br
b
Institute of Informatics, Federal University of Rio Grande do Sul (UFRGS), Porto Alegre, Brazil - mzortea@gmail.com
c
Institute for Education, Science and Technology, Rio Grande, Brazil - daniel.zanotta@riogrande.ifrs.edu.br
d
Irstea, Land, environment, remote sensing and spatial information (TETIS), Montpellier, France, - jb.feret@teledetection.fr
e
Institute of Geosciences, University of Campinas, Campinas, Brazil - beto@ige.unicamp.br
WG VII-3 “INFORMATION EXTRACTED FROM HYPERSPECTRAL DATA”
KEY WORDS: Hyperspectral remote sensing, tropical forests, classification
ABSTRACT:
Tree species mapping in tropical forests provides valuable insights for forest managers. Keystone species can be located for collection of seeds for forest restoration, reducing fieldwork costs. However, mapping of tree species in tropical forests using remote sensing data is a challenge due to high floristic and spectral diversity. Little is known about the use of different spectral regions as most of studies performed so far used visible/near-infrared (390-1000 nm) features. In this paper we show the contribution of shortwave infrared (SWIR, 1045-2395 nm) for tree species discrimination in a tropical semideciduous forest. Using high-resolution hyperspectral data we also simulated WorldView-3 (WV-3) multispectral bands for classification purposes. Three machine learning methods were tested to discriminate species at the pixel-level: Linear Discriminant Analysis (LDA), Support Vector Machines with Linear (L-SVM) and Radial Basis Function (RBF-SVM) kernels, and Random Forest (RF). Experiments were performed using all and selected features from the VNIR individually and combined with SWIR. Feature selection was applied to evaluate the effects of dimensionality reduction and identify potential wavelengths that may optimize species discrimination. Using VNIR hyperspectral bands, RBF-SVM achieved the highest average accuracy (77.4%). Inclusion of the SWIR increased accuracy to 85% with LDA. The same pattern was also observed when WV-3 simulated channels were used to classify the species. The VNIR bands provided and accuracy of 64.2% for LDA, which was increased to 79.8 % using the new SWIR bands that are operationally available in this platform. Results show that incorporating SWIR bands increased significantly average accuracy for both the hyperspectral data and WorldView-3 simulated bands.
* Corresponding author
1. INTRODUCTION
Mapping tree species in tropical ecosystems provides valuable insights for ecologists and forest managers. Limitations on spectral and spatial resolution of satellite images acquired over large areas restrict its use for this purpose (Nagendra and Rocchini, 2008). Currently, high resolution (hyperspatial and hyperspectral) remote sensing has been hailed as a promising technology for individual tree crown (ITC) mapping (Féret and Asner, 2013). However, the optical remote sensing domain was not fully explored for this kind of application and little is known about the utility of the shortwave infrared region (SWIR, 1045-2395 nm). The main objectives of this study are the quantification of the benefit of using shortwave infrared SWIR features for tree species discrimination in tropical semideciduous forests. For this purpose, we assessed performance of classification methods using high spatial resolution hyperspectral imagery. We also simulate the bands of a state-of-art multispectral satellite.
2. MATERIALS 2.1 Study area
The study area is the Reserve of Santa Genebra (22º48’- 22°50’ S, 47º06’- 47°07’ W), located in the municipality of Campinas, in São Paulo State, southeast of Brazil. It comprises 251.8 ha of a well-preserved submontane semideciduous forest formation (Brazilian Atlantic Forest).
2.2 Hyperspectral data
Hyperspectral images were acquired on June 8, 2010 with the ProSpecTIR-VS (AISA Eagle and Hawk) sensor onboard an aircraft flying 1350 m above ground level, resulting in an instantaneous field of view (IFOV) of 1 m. 357 radiance bands were collected in the 400-2500 nm region of the visible/near-infrared (VNIR, 452-919 nm) and the short-wave visible/near-infrared (SWIR, 1045-2395 nm) wavelength range, with a spectral sampling distance of about 5 nm.
This contribution has been peer-reviewed.
Editors: X. Briottet, S. Chabrillat, C. Ong, E. Ben-Dor, V. Carrère, R. Marion, and S. Jacquemoud doi:10.5194/isprsarchives-XL-3-W3-473-2015
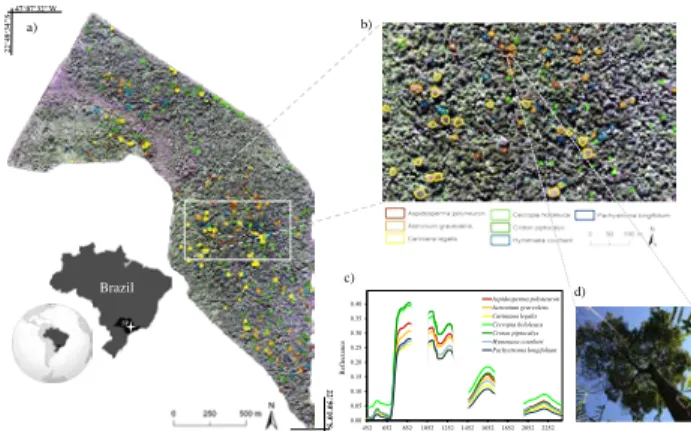
Ten flight lines cover all the study area. a) b) d) a) b) d) 47°06'18.0"W 22 °48‘ 34" S47°07'32"W Brazil SP c) 22 °50'10" S 0.00 0.05 0.10 0.15 0.20 0.25 0.30 0.35 0.40 4526528521052125214521652185220522252 R ef lecta n ce ProSpecTIR-VS Band (nm) Aspidosperma polyneuron Astronium graveolens Cariniana legalis Cecropia hololeuca Croton piptocalyx Hymenaea courbari Pachystroma longifolium
Figure 1. (a) Location of the study area in Brazil, detailing the St. Genebra Forest Reserve with a true color composite (R=639 nm;
G=548 nm; B=460 nm) yielded from hyperspectral data; (b) Tree crowns manually delineated and identified to the species level in the field; (c) Mean spectral response of the approached species; (d) Photograph taken on 28/May/2014 of the crown of
Aspidosperma polyneuron.
2.3 Field data
Initially, ITCs were manually delineated throughout the study area using the image in a scale of 1:1,500 (Fig. 1). Only crowns clearly seen with the naked eye were outlined, thus ensuring pure spectral response of species. In the field, with aid of a GPS device coupled with an external antenna, trees were visited and identified to the species level. A total of 310 ITCs were identified, corresponding to seven species. Table 2 summarizes the number of crowns and pixels per species as well as diameter at breast height (DBH).
Species Code Crowns Pixels DBH (cm)
Aspidosperma polyneuron AP 25 2,630 48-96 Astronium graveolens AG 59 5,914 26-57 Cariniana legalis CL 50 13,312 52-111 Cecropia hololeuca CH 60 2,234 13-25 Croton piptocalyx CP 83 6,375 25-71 Hymenaea courbari HC 18 3,663 61-95 Pachystroma longifolium PL 15 914 49-63 Total 310 35,042
Table 1. Species list, number of crowns, pixels and minimum and maximum Diameter at Breast Height (DBH)
3. METHODS 3.1 Hyperspectral data pre-processing
Atmospheric correction were applied using the Fast Line-of-Sight Atmospheric Analysis of Spectral Hypercubes (FLAASH) algorithm, a MODTRAN4-based approach available in the ENVI software (ITT Visual Information Solutions, 2009). Bands around 1,400 and 1,900 nm were removed, due to strong atmospheric water vapor absorption. Bands around 970 nm were discarded, as they are located in the transition zone between sensors and showed low signal-to-noise ratios (SNR). Noisy wavelengths below 400 and above 2,450 nm were also discarded. Finally, 260 narrow bands spanning 450-2,450 nm were retained for further use. After atmospheric correction, images of each flight line were geometrically rectified with their respective Geometric Look-up-Table (GLT).
3.2 Simulations of multispectral bands
Hyperspectral data provide the opportunity to simulate bands of multispectral sensors by spectral resampling. We used a simplified approach where narrow bands were aggregated to match the WorldView-3 (WV-3) satellite, with the spectral filter functions shown in Figure 1.
0 0.2 0.4 0.6 0.8 1 350 600 850 1100 1350 1600 1850 2100 2350 Rela tiv e Res po ns e Wavelength (nm) Blue Green Yellow Red Red Edge NIR-1 NIR-2 SWIR-1 SWIR-2 SWIR-3 SWIR-4 SWIR-5 SWIR-6 SWIR-7 SWIR-8
Figure 2. Spectral filter functions of WorldView-3 satellite
3.3 Feature selection
Classification of hyperspectral data frequently requires a preliminary dimensionality reduction step. This aims at avoiding the Hughes phenomenon (Hughes, 1968), i.e. loss of classifier performance with increasing data dimensionality, and reducing the computational cost. In this paper, we performed stepwise regression, using the stepwisefit function available in MATLAB® (MathWorks, Natick, Massachusetts, USA), to select bands in the VNIR and SWIR spectral ranges to classify species. The aim is to evaluate the effects of dimensionality reduction and identify potential spectral domains that may improve species discrimination. Here, we selected 30 bands in the VNIR and SWIR ranges.
3.4 Experimental setup
3.4.1 Selection of training and testing samples
Labelled pixels from the manually delineated ITCs were extracted from the image, resulting in a dataset with 260 bands, and 35,042 pixels distributed among 310 ITCs (Table 1). This dataset was randomly partitioned into 60% ITCs for training and 40% for testing. During this process, the ITC identity was respected, i.e. testing and training pixels of the same species came from different ITCs. Previous studies showed that violation of ITC identity could lead to unrealistic classification accuracy (Baldeck and Asner, 2014). We repeat the above splitting procedure 100 times, randomly choosing at each iteration the ITCs used to train and test the classifiers.
3.4.2 Pixel-level classification
We evaluated the performance of three supervised machine learning methods: Linear Discriminant Analysis (LDA), Support Vector Machines (SVM) with the linear and radial basis function (RBF) kernels and Random Forest (RF). These methods have been used in recent studies dealing with discrimination of tree species by remote sensing (Clark & Roberts, 2012; Féret & Asner, 2013; Dalponte et al., 2013). The free parameters of SVM and RF were estimated using a grid search strategy. For the experiments the methods were trained using the following
datasets: dataset I: 99 VNIR features; dataset II: 260 VNIR plus SWIR features.
4. RESULTS AND CONCLUSIONS
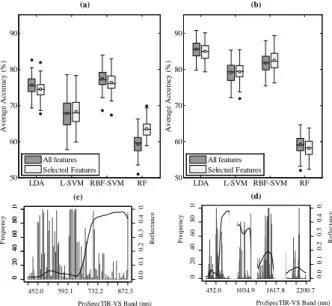
We found that the average accuracy is highly variable for all methods at the pixel-level, after repeating species classification 100 times, changing at each iteration ITCs used for training and testing, w (Figure 1). While accuracy of dataset I remained between 55% and 80% (Fig. 3a), the accuracy of dataset II (Fig. 3b) reached values between 55% and 90%. This difference is expressed most notably comparing results of LDA, L-SVM and RBF-SVM. It is worth noting that, for these methods, while average accuracy ranged from 58 % to 86% (Fig. 3a) using only VNIR, incorporating SWIR features increased performance, with average classification accuracy ranging from 72 % to 91%. Feature selection was performed on each of the 100 training datasets, enabling visualization of the most important wavelengths for species discrimination (Fig. 3c,d). The majority of the bands selected in the VNIR domain were in the visible region (452-653 nm), predominantly around the blue (452-516 nm) and red (620-691 nm) absorption features (Fig. 3c). Several wavelengths corresponding to the red region were selected at each of the 100 repetitions. This region also appears as very discriminative when SWIR bands are incorporated in the analysis (Fig. 3d). SWIR spectral bands located in the 1,529-1,660 nm spectral region, as well as in the vicinity of 2,383 nm also systematically appear as particularly important for species discrimination. (c) (d) 452.0 592.1 732.2 872.3 0 20 40 60 80 10 ProSpecTIR-VS Band (nm) Frequency 0 20 40 60 80 10 0.0 0.1 0.2 0.3 0.4 0. Reflectance 452.0 1034.9 1617.8 2200.7 0 20 40 60 80 10 ProSpecTIR-VS Band (nm) F requency 0.0 0.1 0.2 0.3 0.4 0. Reflectance LDA L-SVM RBF-SVM RF 50 60 70 80 90 A v er ag e A ccu racy ( % ) All features Selected Features LDA L-SVM RBF-SVM RF 50 60 70 80 90 A v er ag e A ccu racy ( % ) All features Selected Features (a) (b)
Figure 3. Average accuracy for tree species classification obtained at the pixel scale with different methods, using selected
features from either VNIR domain (a), or VNIR+SWIR domain (b). Frequency of selected bands obtained from VNIR data (c) and VNIR +SWIR data (d). The spectral response of a vegetated
pixel is plotted in (c) and (d) for clarity.
Incorporation of SWIR bands also increased significantly average accuracy when WorldView-3 simulated images were used to classify the species (Fig.5). While simulations in the VNIR, which actually corresponds to bands of the WorldView-2 satellite, yield results between 55 % and 75%, including eight SWIR bands (Fig.2) raised significantly the classification
accuracy between 60 % and 85%, for all classifiers tested. Specifically, the increase on the median was about 4.5% for RF, up to 15.1% for LDA. These results, together with those obtained with the hyperspectral data, confirm that spectral information from the SWIR region improves species discrimination in the tropical semideciduous forest studied.
VNIR VNIR+SWIR 50 60 70 80 90 A v e ra g e A c cu rac y ( % ) LDA L-SVM RBF-SVM RF
Figure 4. Variability of classification accuracy of the species using different methods with simulated WorldView-3 data based
on hyperspectral data.
Our results highlight the importance of SWIR information for tree species discrimination at the pixel scale. Further investigations need to be done in order to compare these results with alternative approaches which proved to outperform pixelwise classification. We expect object-oriented classification performed at the ITC scale and pixel filtering (shaded pixels masking) to improve classification accuracy.
The results obtained with feature selection also need to be further analyzed with a physically-based perspective in order to improve their interpretation and relate discriminative potential to chemical and structural properties of the vegetation. Leaf optical properties of the discriminated tree species have been collected during a field campaign. These data will be integrated into a virtual 3D scene in order to simulate hyperspectral images using the DART radiative transfer model (Gastellu-Etchegorry et al., 2015), to study the relative importance of tree structure and leaf chemistry, and to attempt a validation of the model for hyperspectral simulations of tropical forests.
REFERENCES
Baldeck, C. A., Asner, G.P., 2014. Improving Remote Species Identification through Efficient Training Data Collection. Remote Sens. 6, 2682-2698.
Clark, M. L., Roberts, D. A., Clark, D., 2005. Hyperspectral discrimination of tropical rain forest tree species at leaf to crown scales. Remote Sens. Environ. 96, 375-398.
Clark, M. L., Roberts, D. A., 2012. Species-level differences in hyperspectral metrics among tropical rainforest trees as determined by a tree-based classifier. Remote Sens. 4, 1820-1855.
Dalponte, M., Orka, H. O., Gobakken, T., Gianelle, D., & Næsset, E., 2013. Tree species classification in boreal forests with hyperspectral data. IEEE Trans. Geosci. Remote Sens. 51, 2632-2645.
This contribution has been peer-reviewed.
Editors: X. Briottet, S. Chabrillat, C. Ong, E. Ben-Dor, V. Carrère, R. Marion, and S. Jacquemoud doi:10.5194/isprsarchives-XL-3-W3-473-2015
Féret, J., Asner, G.P., 2013. Tree species discrimination in tropical forests using airborne imaging spectroscopy. IEEE Trans. Geosci. Remote Sens. 51, 73-84.
Gastellu-Etchegorry, J.-P., Yin, T., Lauret, N., Cajgfinger, T., Gregoire, T., Grau, E., Feret, J.-B., Lopes, M., Guilleux, J., Dedieu, G., Malenovský, Z., Cook, B.D., Morton, D., Rubio, J., Durrieu, S., Cazanave, G., Martin, E., Ristorcelli, T., 2015. Discrete Anisotropic Radiative Transfer (DART 5) for Modeling Airborne and Satellite Spectroradiometer and LIDAR Acquisitions of Natural and Urban Landscapes. Remote Sens. 7, 1667-1701.
Hughes, G.F., 1968. On the mean accuracy of statistical pattern recognizers. IEEE Trans. Inf. Theory, 14, 55–63.
ITT Visual Information Solutions, 2009. Atmospheric Correction Module: QUAC and FLAASH User’s Guide. Version 4.7. ITT Visual Information Solutions, Boulder, CO.
Nagendra, H., Rocchini, D., 2008. High resolution satellite imagery for tropical biodiversity studies: the devil is in the detail. Biodiversity and Conservation. 17, 3431-3442.
Zhang, J., Rivard, B., Sanchez-Azofeifa, G.A., Castro-Esau, K., 2006. Intra and interclass spectral variability of tropical tree species at La Selva, Costa Rica: Implications for species identification using HYDICE imagery. Remote Sens. Environ. 105, 129-141.