Emotions generated by meat and other food products in women
S. Rousset
1*, V. Deiss
2, E. Juillard
2, P. Schlich
3and S. Droit-Volet
41
Institut National de la Recherche Agronomique, Laboratoire de Nutrition Humaine, BP 321, 58 rue Montalembert, 63009 Clermont-Ferrand Cedex 1, France
2Institut National de la Recherche Agronomique, Station de Recherches sur la Viande, Theix, 63122 Saint Gene`s Champanelle, France
3
Centre Europe´en des Sciences du Gouˆt, 15 rue Hugues Picardet, 21000 Dijon, France 4
Laboratoire de Psychologie Sociale et Cognitive, UMR 6024 CNRS, 34 Avenue Carnot, 63000 Clermont-Ferrand, France (Received 2 November 2004 – Revised 3 June 2005 – Accepted 6 June 2005)
Eating behaviour depends partly on food preference, which is itself determined by different types of emotions. Among the emotions generated by food, disgust with red meat is common in women and can lead to reduced meat consumption. We tested the hypothesis that low meat intake is related to different negative emotions towards meat but does not affect the emotions expressed towards other food categories. Food intake of sixty women was followed throughout each day for 1 week and allowed us to assign women to two groups (low v. high meat-eating women). They were then invited to assess the intensity of twenty-six emotions described by words and induced by thirty food pictures. We determined the number of necessary dimensions to describe the space created by the twenty-six words. The results showed differences in emotions between the low and high meat-eating women. As expected, there were overall differences in the emotions generated by the thirty food pictures. Six clusters of emotions were necessary and sufficient to summarise the emotional space. These dimensions were described by ‘disappointment’, ‘satisfaction’, ‘guilt’, ‘doubt’, ‘amused’ and ‘indifference’. As expected, the low meat-eating women felt more ‘disappointment’, ‘indifference’ and less ‘satisfaction’ towards meat than did the high meat-eating women. However, the low meat-eating women also stated other negative emotions such as ‘doubt’ towards some starchy foods. The only foods that they liked more than high meat-eating women were pears and French beans. In conclusion, low meat consumption was associated with specific negative emotions regarding meat and other foods.
Emotion: Dietary surveys: Meat consumption: Women
A previous nutrition study showed that about 25 % of French women are Fe deficient (Galan et al. 1998). This deficiency is due to an Fe intake lower than the minimum requirement. Several studies have shown that women ingest smaller quantities of Fe than men (Ortega et al. 1998). This coincides with the fact that meat consump-tion also tends to be higher in men (Ortega et al. 1998; Rousset et al. 2003). Indeed, meat and meat products are important sources of Fe, especially haeme Fe, which is easier to absorb than non-haeme Fe found in plants (Hulten et al. 1995; Shaw et al. 1995). However, Mooney & Walbourn (2001) showed that meat was the most com-monly avoided food in female students. Thus, about half of the female students surveyed reported avoiding meat, and were four times more likely to avoid meat than vegetables. Even though women might have negative attitudes towards meat and red meat, in particular, and avoid consuming it, meat is well adapted for their needs because it is Fe-rich and they have high requirements in this micronutrient (16 mg/d).
The physical characteristics of food are important for determin-ing the hedonic response (Kubberod et al. 2002). In the case of meat, tenderness is the main sensory criterion of acceptance within a species such as beef (Chambers & Bowers, 1993). Conversely, beef toughness is well known to raise objections.
However, when comparing meat of different species, appearance and colour (white and red) become important factors in discrimi-nating consumer liking. Red meat colour, in particular, arouses strong emotion, depending on consumer gender. Men feel hedonic pleasure in seeing and eating red meat while women experience discomfort. The main reason reported by women for this is that the sight of blood is perceived as repulsive (Kenyon & Barker, 1998; Kubberod et al. 2002). Gregory (1997) and Guzman & Kjaernes (1998) have claimed that white meat such as chicken is less likely to be associated with blood or a living animal due to its white appearance and therefore is preferred to red meat.
Worsley & Skrzypiec (1998) and Lea & Worsley (2001, 2002) have shown not only the influence of pleasant feelings but also of beliefs on red meat consumption. Thus, the best predictor of the frequency of meat intake is the pleasant feelings experienced by young consumers. Conversely, negative beliefs towards meat decrease meat consumption. When red meat is thought to be fatty and unhealthy, consumers reduce or stop their meat con-sumption (Holm & Mohl, 2000; Lea & Worsley, 2001). Likewise, in the case of seafood, Olsen (1999) showed that attitudes towards eating this food, measured by endorsement of taste, explained the variation in the frequency of seafood consumption better than
* Corresponding author: Dr S. Rousset, fax þ 33 4 73 60 82 50, email [email protected]
Abbreviations:CVA, canonical variate analysis; MANOVA, multiple ANOVA; PCA, principal component analysis.
qThe Authors 2005
. IP address:
118.70.52.165
, on
24 Jun 2021 at 12:05:40
, subject to the Cambridge Core terms of use, available at
https://www.cambridge.org/core/terms
.
health considerations or perceived convenience. Finally, certain attitudes towards meat as well as other objects are important determinants of behaviour. Psychological studies have shown that the consistency between attitude and behaviour is stronger when the subject has had direct experience with the object of specific attitudes (Regan & Fazio, 1977; Fazio & Zanna, 1981). Furthermore, the affective more than the cognitive component of the attitude is related to hedonic behaviour (Millar & Tesser, 1986, 1992). For example, meat-liking influences eating beha-viour more than knowledge of meat-related nutritional and health characteristics.
The affective component of attitudes refers to emotions gener-ated by a specific object or event. Emotions involve a set of inter-acting components and are commonly treated as a multifaceted phenomenon consisting of components such as behavioural reac-tions (action tendency), expressive reacreac-tions (facial expressions), physiological reactions (pulse rate, blood pressure) and subjective feelings. Moreover, each emotion is characterised by its valence and intensity. The valence is the hedonic quality of experience and deals with positive or negative evaluations of the emotion. Intensity is the magnitude (weak v. strong) of emotional percep-tion. Because emotions are internal states that cannot be directly measured, many studies have used words that an individual uses to label his or her emotional states (Ekman et al. 1983; Russell, 1991; Baars, 1994; Scherer, 1998, 2005; Searle, 1998; Cabanac, 2002; Niedenthal et al. 2004).
The process consisting of labelling emotions is typical of man and exceeds physiological reaction. This process involves cogni-tion and represents an active rather than a reactive role of the indi-vidual concerned (Leyens et al. 2000). In fact, feelings are the subjective experience of present or remembered emotional exci-tation, often conscious and communicated by words or emotional expressions. Feelings are exclusively studied by verbal labels (Scherer, 1998). Recently, Niedenthal et al. (2004) developed a large database on the French emotion lexicon in order to facilitate future research. Thus, 237 words denoting emotional states were translated into French from an initial list of Italian words used by Zammuner (1998). In the present study, valence and intensity for each emotion were assessed. Subjects determined that ‘to like’ has a positive valence while ‘deception’ has a negative valence. Among words with a positive valence, ‘enchantment’ has a higher intensity than ‘interest’. In a previous study (Juillard, 2003; V Deiss, E Juillard, S Droit-Volet & S Rousset, unpub-lished results), twenty-six emotional words were selected from the 237-word list to describe women’s and men’s emotions towards thirty different pictures of foods including vegetables, cheese, fruits, cereals, red and white meat, seafood, eggs and snacks (SU.VI.MAX, 1994). The results showed that there were differences in emotional responses to foods; high disgust and uneasiness towards offal such as kidney, tongue, black pudding, and great pleasure towards fish, pasta, chocolate and tarts. Under-standing specific emotions towards nutrient-rich food in popu-lations at risk of nutrient deficiency should help nutritionists and food companies to create and/or to propose specific liked food products, or to inform the population about the beneficial effects of consuming certain foods to avoid deficiency.
The aim of the present study was first to determine emotions associated with food pictures in young women, to categorise their emotional words, and to link their level of meat consumption to emotions produced by thirty different food pictures. Positive emotions towards meat products were expected to be related to
higher meat consumption. Conversely, it was assumed that nega-tive emotions would be more closely associated with meat pro-ducts in low meat-eating women. Moreover, we hypothesised that low meat-eating women might transfer their positive emotions to other food products.
Methods Participants
In January 2003, a convenience sample was recruited in Clermont-Ferrand, France, using advertising in the press (the local newspaper, La Montagne, Info Magazine, FR3 TV) and dis-plays in stores (supermarkets). The advertisement invited women between 20 and 40 years of age to participate in a survey dealing with eating habits. Suitable subjects for age and availability were selected among the women who had replied by telephone; 86 % of them actually agreed to complete the dietary survey and to assess
food pictures. Sixty women with a mean age 29 (SD6) years
par-ticipated in the survey. They were not receiving medical treatment for any progressive illness.
Experimental design
Dietary survey. The consumption of foods at each meal was
assessed by a questionnaire during seven consecutive days in winter 2003. The questionnaire, which was accompanied by instructions for completing it, comprised six headings, subdivided into several sub-headings: breakfast (beverages, bread, dairy pro-ducts, jam or honey spread, sugar, other foods); a snack in the morning (beverage, sugar, biscuits or cakes, chocolate, other foods); lunch (aperitif, starter, sandwich, eggs, fish or sea food, meat, offal, ready-made meal, vegetable, pulses, starchy foods, potato, sauce, dairy products, dessert, bread, beverage, sugar, other foods); snack in the afternoon (same items as the morning snack); dinner (same as lunch); snack in the evening (same as the morning snack).
The quantities of each food were assessed by the subjects them-selves from photographic standards, specifically designed, vali-dated and used in a large French epidemiological study (Guinot et al. 2001). All participants were contacted after having received the questionnaire and before beginning the study to make sure that they did not encounter any difficulty in completing it. Fe intakes from meat were determined by using EPIBASE, ver-sion 1·1 H (1999). Participants were assigned to two groups on the basis of average meat consumption (1·6 mg meat Fe/d); low meat-eating and high meat-eating women.
Emotional assessment of food pictures. In our experiment,
thirty pictures (A5 standard) were used, all taken from a specific book (SU.VI.MAX, 1994). Pictures consisted of vegetables (salad, French beans, potatoes, cauliflower, spinach), cheeses (Camembert, Roquefort), fruits (pears, bananas), starchy foods (bread, rice, pasta, pizza), sweets (fruit tarts, chocolate, pound cake, cream cake, i.e. cake having layers held together by a sweet filling and covered with frosting), red meat (roast beef, minced meat), white meat (turkey, rabbit, pork chop), fish (fillet, sea food), offal (tongue, kidneys, black pudding), eggs (omelette), pro-cessed pork (dry sausage) and pan bagnat (sandwich with tomato, egg, lettuce and tuna fish, commonly eaten in France).
The twenty-six key words for emotions towards foods were selected from the database of Niedenthal et al. (2004) that
. IP address:
118.70.52.165
, on
24 Jun 2021 at 12:05:40
, subject to the Cambridge Core terms of use, available at
https://www.cambridge.org/core/terms
.
includes 237 emotional French words applied to any event that had been evaluated for its emotional prototypicality on the basis of different indicators including valence and intensity of emotional state (Juillard, 2003; V Deiss, E Juillard, S Droit-Volet & S Rousset, unpublished results). In a pre-test, partici-pants (different from the present study) were first asked to judge the relevance of each of the 237 emotional words to describe their emotions for food consumption, regardless of the food. Only words quoted by at least 50 % of the participants were selected. Seventy words met this criterion. Among those words, only twenty-six were statistically discriminant and not redundant (Juillard, 2003; V Deiss, E Juillard, S Droit-Volet & S Rousset, unpublished results). Among these words, there were thirteen words with a positive valence: ‘to like’; ‘content’; ‘vigilant’; ‘pleasure’; ‘thrilled’; ‘rejoicing’; ‘satisfaction’; ‘sur-prise’; ‘serene’; ‘amused’; ‘delight’; ‘pride’; ‘interest’. There were thirteen other words with a negative valence: ‘disgust’; ‘hesitation’; ‘indifference’; ‘guilt’; ‘uneasiness’; ‘nostalgia’; ‘impatience’; ‘doubt’; ‘frustration’; ‘embarrassment’; ‘disap-pointment’; ‘lassitude’; ‘regret’.
Each woman was presented with each of the thirty food pic-tures, in random order. Participants took part in two testing ses-sions at the laboratory, each between 11·00 hours and 14·00 hours or between 18·00 hours and 08·00 hours. Each woman assessed the intensity of twenty-six emotional words that were aroused by thirty food pictures at two different times, at a 1-week interval. Women were instructed to imagine actually having the food in front of them and being invited to consume it. This imagery task has been shown to successfully arouse emotions (Smith & Lazarus, 1993; Scherer, 1998). They then had to mark the intensity of each emotional word on a five-point scale (‘0’, I do not feel this emotion; ‘1’, I feel it a little; ‘2’, I feel it moderately; ‘3’, I feel it a lot; ‘4’, I feel it very strongly).
Statistical treatments
The present study generated 3600 observations (sixty participants; thirty pictures; two replicates). A multiple ANOVA (MANOVA) was first carried out on these observations to test the picture effect on all the participants. The MANOVA model was a two-way mixed model (picture and subject) in which the subject was declared as a random effect. A canonical variate analysis (CVA) showed the direction of emotional vectors, which contrib-ute to the construct of the two main discriminant axes and the location of food, limited by their 90 % confidence ellipse on a plot. A likelihood ratio test determined the number of necessary and significant dimensions to show the major part of this discrimi-nant emotional space. A clustering algorithm of variables was then used to classify the twenty-six emotional words into the number of clusters determined by the likelihood ratio test. For each cluster of words, a representative was chosen in order to maximise the correlation coefficient between itself and the aver-age of the words from that cluster. The means of emotional vari-ables within each cluster were then computed and identified by the variable which best represented the cluster as the ‘mean emotional variables’. A principal component analysis (PCA) com-puted on the covariance matrix was carried out with the differ-ences in the mean emotional variables between the low and high meat-eating women. This analysis showed the directions of emotional vectors which best discriminated the two types of
par-ticipants. Thus, the longer an arrow variable, the more discrimi-nant the word was. PCA also showed the location of food products in this emotional space. A virtual product identified by a diamond symbol on the map with null coordinates for each mean emotional variable was superimposed on the PCA plot to show the location for which no difference was detected between low and high meat-eating women. Thus, the orthogonal projection of this point on the emotional vector discriminated the food into two groups; foods arousing more emotion in low or in high meat-eating women. In other words, when the orthogonal projection of a food picture on an arrow variable was located in the vector direction and well in front of the diamond projection, low meat-eating women felt more emotion towards that food. Finally, for each food product, a t test was performed to determine the effect of the group (low v. high meat-eating women) on the mean emotional variables.
Computation was done with the SAS system (SAS Institute Inc., 1998). The MANOVA and CVA were obtained using the GLM procedure with the MANOVA statement and the CANO-NICAL option. The variable clustering algorithm used was given by the VARCLUS procedure with the CENTROID option. The PCA was computed using the PRINCOMP procedure. The graphs from the CVA and PCA were plotted using specific SAS macros developed at the Institut National de la Recherche Agronomique (Dijon, France).
Results
Diet and social characteristics
Participants consumed meat with a mean frequency of six times per week. The total Fe intake varied between 6·2 and 19·3 mg/d and the mean was 10·8 mg/d. Since the recommended allowance is 16 mg Fe/d, 96 % of the participants had a lower intake than the French recommendations. Moreover, Fe intake from meat varied from 0 to 9·6 mg/d. Thus, thirty women had an intake lower than 1·6 mg/d (low meat-eating group) and thirty women had an intake higher than 1·6 mg/d (high meat-eating group). The meat consumption frequency among women in the high eating group was double that of those in the low meat-eating group (7·2 v. 3·6; Table 1). However, Fe and energy intakes were similar in both groups (P¼ 0·25; P¼ 0·84). The energy intake was in accordance with the recommended allowances of 7530 kJ (1800 kcal)/d (Table 1). The low meat-eating women tended to have a higher energy intake from sweets (P¼ 0·06) and vegetables (P¼ 0·13) while the high meat-eating women consumed more energy from meat products (P, 0·0001) and processed pork (P¼ 0·002; Table 1).
The mean height of the subjects was 1·64 m. Their mean weight
was 57·0 kg. The BMI was 21·1 kg/m2. Of the young women, 8 %
were overweight (BMI . 25 kg/m2) while 13 % were
under-weight (BMI , 18·5 kg/m2). No differences in height, weight
and BMI distinguished the two groups of participants. Weight varied from 42 to 76 kg in low meat-eating women and from 40 to 70 kg in high meat-eating women. BMI ranged from 15·6 to
27·3 kg/m2in the low meat-eating group, and 17·0 to 26·2 kg/m2
in the high meat-eating group.
The participant sample was composed of students (37 %), business employees (20 %), office workers (18 %), managers (11 %), artisans (4 %), unemployed (4 %) and homemakers (6 %). There was no difference in the participants’ occupations between the two groups.
. IP address:
118.70.52.165
, on
24 Jun 2021 at 12:05:40
, subject to the Cambridge Core terms of use, available at
https://www.cambridge.org/core/terms
.
How food products were discriminated by emotions
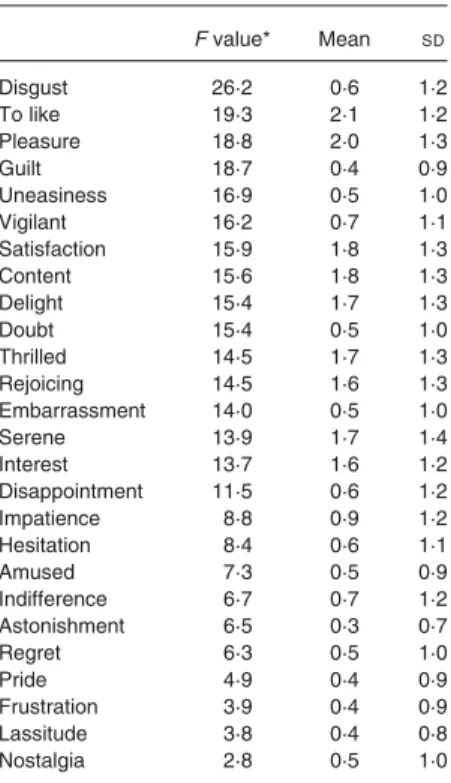
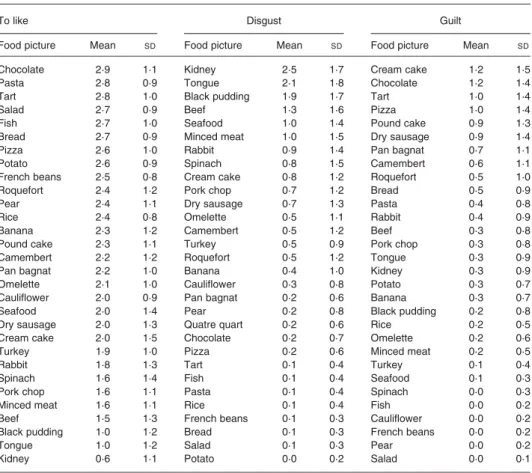
MANOVA showed that there were overall significant differences in the emotions generated by the thirty food pictures (P, 0·0001). The emotional terms that best discriminated the food pictures were: ‘disgust’; ‘to like’; ‘pleasure’; ‘guilt’; ‘uneasiness’; ‘vigi-lant’; ‘content’; ‘doubt’; ‘satisfaction’; ‘delight’. Nevertheless, all the terms were significant (P, 0·0001; Table 2). The emotions felt towards these food products with the greatest intensity were ‘to like’; ‘pleasure’; ‘content’; ‘serene’; ‘thrilled’; ‘satisfaction’; ‘delight’; ‘rejoicing’; ‘interest’. Thus, emotions towards food con-sumption were mainly positive. However, in the present study, the intensity of emotions was moderate since the mean score was never higher than ‘2’ except for the emotional word ‘to like’. However, as we can see in Table 3, differences in emotional intensity between food products were high, as shown by three examples: ‘to like’; ‘disgust’; ‘guilt’.
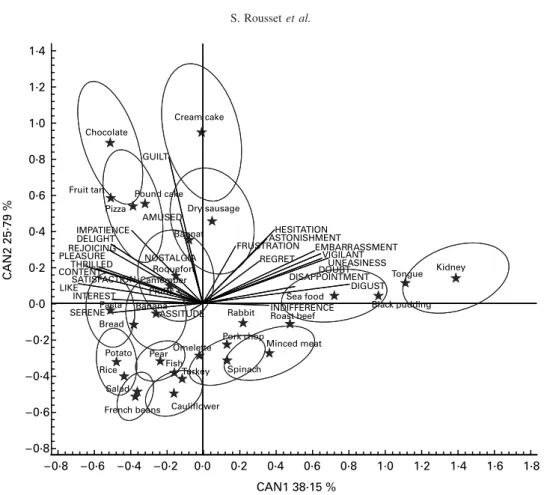
These differences in the emotions generated by the thirty food pictures were shown on the main plot of the CVA (Fig. 1). The first two axes explained 64 % of the variance. The first discrimi-nant axis shows a contrast between ‘disgust’, ‘disappointment’, ‘doubt’, ‘uneasiness’, ‘vigilant’, ‘embarrassment’ and ‘serene’, ‘interest’, ‘to like’, ‘satisfaction’, ‘content’, ‘thrilled’ and ‘plea-sure’. The second axis was mainly explained by ‘guilt’ and, to a lesser extent, by ‘amused’. The confidence ellipses around pic-ture means showed the variability of emotions reported by the participants. When the confidence ellipses did not overlap, emotions towards food pictures were different. The location of food on this mapping shows that participants were disgusted by offal such as kidneys, tongue and black pudding. Disgust was a strong negative emotion aroused first by kidneys (2·5) and second by tongue and black pudding (2·1 and 1·9; Table 3). Disgust for beef and other meats was low (1·3). Potato, salad, bread, French beans, rice, pasta and fish aroused the lowest level of intensity of disgust (0·1). Conversely, participants liked chocolate, pasta, tarts, salad, fish, bread, pizza and potatoes
(Fig. 1 and Table 3). Their mean scores of ‘to like’ were higher than 2·5. Obviously, the participants did not like offal very much. Thus, the scores for kidneys, tongue and black pudding were low (between 0·6 and 1·0; Table 3). The least liked foods after offal were red meats followed by white meats. Spinach,
Table 2. Rank of emotional words in decreas-ing order of picture discrimination
(Mean values and standard deviations)
F value* Mean SD Disgust 26·2 0·6 1·2 To like 19·3 2·1 1·2 Pleasure 18·8 2·0 1·3 Guilt 18·7 0·4 0·9 Uneasiness 16·9 0·5 1·0 Vigilant 16·2 0·7 1·1 Satisfaction 15·9 1·8 1·3 Content 15·6 1·8 1·3 Delight 15·4 1·7 1·3 Doubt 15·4 0·5 1·0 Thrilled 14·5 1·7 1·3 Rejoicing 14·5 1·6 1·3 Embarrassment 14·0 0·5 1·0 Serene 13·9 1·7 1·4 Interest 13·7 1·6 1·2 Disappointment 11·5 0·6 1·2 Impatience 8·8 0·9 1·2 Hesitation 8·4 0·6 1·1 Amused 7·3 0·5 0·9 Indifference 6·7 0·7 1·2 Astonishment 6·5 0·3 0·7 Regret 6·3 0·5 1·0 Pride 4·9 0·4 0·9 Frustration 3·9 0·4 0·9 Lassitude 3·8 0·4 0·8 Nostalgia 2·8 0·5 1·0
*All the F values of the Fisher test were significant (P, 0·0001).
Table 1. Characteristics of women and their food consumption in low and high meat-eating groups (Mean values and standard deviations)
Low* (n 30) High (n 30)
Mean SD Mean SD Statistical significance (P)
Age (years) 29·2 6·1 28·8 6·7 0·81
Height (m) 1·64 0·06 1·64 0·07 0·8
Weight (kg) 57·2 8·1 56·5 7·0 0·74
BMI (kg/m2) 21·3 3·1 20·9 2·2 0·56
Meat consumption (frequency/week) 3·6 2·0 7·2 2·6 ,0·0001
Total Fe intake (mg/d) 10·4 3·2 11·3 2·6 0·25
Meat Fe intake (mg/d) 0·9 0·5 3·0 1·5 ,0·0001
Energy intake (kJ/d) 7481·4 1661·5 7385·6 1948·1 0·84
Meat products (kJ/d) 186·6 166·1 605·2 300·5 ,0·0001
Processed pork (kJ/d) 144·3 162·3 354·2 324·5 0·002
Fish and seafood (kJ/d) 164·4 198·3 158·1 156·3 0·89
Fruit (kJ/d) 1080·3 741·5 892·8 573·0 0·27 Vegetables (kJ/d) 318·8 263·2 231·4 168·8 0·13 Sweets (kJ/d) 398·3 390·4 241·0 276·2 0·06 Pastries (kJ/d) 1425·9 1040·2 1205·9 941·5 0·39 Dairy products (kJ/d) 1192·4 642·7 1024·8 545·2 0·28 Eggs (kJ/d) 148·8 126·6 198·7 233·8 0·30 Ready-made meals (kJ/d) 752·4 557·2 648·4 496·3 0·45 Starchy foods (kJ/d) 1540·1 706·7 1664·9 723·7 0·5 Alcohol (kJ/d) 123·8 143·9 160·2 216·5 0·45 . IP address: 118.70.52.165 , on 24 Jun 2021 at 12:05:40
, subject to the Cambridge Core terms of use, available at
https://www.cambridge.org/core/terms
.
the least popular vegetable, was ranked near meat products. Other vegetables, both cheeses, both fruits, eggs, both cakes, rice, dry sausage and seafood obtained intermediate scores.
Guilt was the second most important category of negative emotion, independent of ‘disgust’. However, its mean score was low; 0·4 (Table 2). First, cream cake and chocolate followed by fruit tart, pound cake, dry sausage and pizza evoked guilt (Table 3). Conversely, participants felt relatively little guilt about eating meat. Finally, salad, pears, French beans, cauli-flower, fish and spinach caused no guilt. These food products were perceived with neutral or positive emotions such as ‘to like’.
Discriminant power of the emotional words and dimensionality of the emotional space
The likelihood ratio test determined that a six-dimension emotion-al space was sufficient to differentiate between these pictures. The dimensions necessary to discriminate between the food pictures were described by ‘disappointment’, ‘satisfaction’, ‘nostalgia’, ‘doubt’, ‘amused’ and ‘indifference’. Each of these words were best correlated with the average of the words from clusters 1, 2, 3, 4, 5 and 6 (Table 4). However, in the case of ‘nostalgia’, we preferred ‘guilt’ as representative of this dimension because this word was seven times more discriminant than ‘nostalgia’ (Table 2) and because the correlation coefficients between those words and the average of those two words were similar (0·76 and 0·80, respectively).
The negative emotions were scattered into four different clusters while positive emotions were found in only two clusters. Thus, negative emotional words were more variable than positive emotions because they expressed emotions as different as ‘disap-pointment’, ‘guilt’, ‘doubt’ and ‘indifference’. In regards to nega-tive emotions, the first cluster, ‘disappointment’, was composed of five words with ‘disgust’ being the most discriminant word (Table 2). The second negative cluster, ‘guilt’, contained ‘nostalgia’ and ‘guilt’. The last word dealt with a strong negative emotion. The third one, ‘doubt’, contained four words, and ‘uneasiness’ was the strongest negative word among them. ‘Indifference’ and ‘lassitude’ composed the last cluster of negative emotions. Those last two words were less discriminant than most of the others. In regards to positive emotions, ‘satisfaction’ was the first representative of posi-tive emotions and was expressed by ‘to like’, ‘pleasure’, ‘content’ and ‘delight’. Among those words, ‘to like’ best discriminated food pictures (Table 2). The second positive representative was ‘amused’ that means ‘to have fun’ with a touch of ‘astonishment’ and ‘pride’. However, this last cluster was less discriminating than that of ‘satisfaction’.
Difference in disgust and liking between low and high meat-eating women
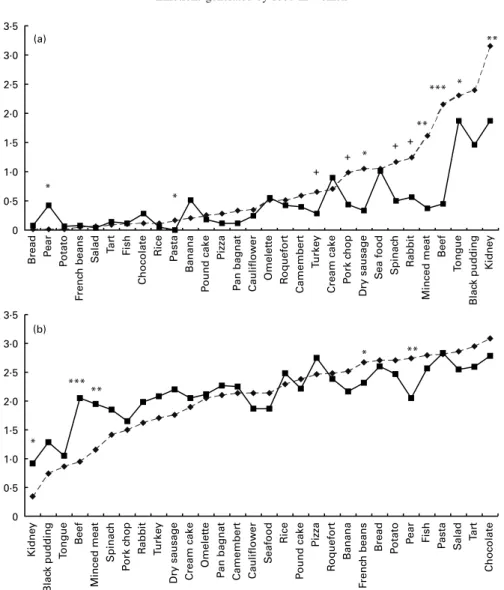
Fig. 2 showed the most significant differences in scores of disgust and ‘to like’ towards the thirty food pictures given by low and high meat-eating women. Differences in disgust between low Table 3. Three examples of emotion towards the thirty food pictures
(Mean values and standard deviations)
To like Disgust Guilt
Food picture Mean SD Food picture Mean SD Food picture Mean SD
Chocolate 2·9 1·1 Kidney 2·5 1·7 Cream cake 1·2 1·5
Pasta 2·8 0·9 Tongue 2·1 1·8 Chocolate 1·2 1·4
Tart 2·8 1·0 Black pudding 1·9 1·7 Tart 1·0 1·4
Salad 2·7 0·9 Beef 1·3 1·6 Pizza 1·0 1·4
Fish 2·7 1·0 Seafood 1·0 1·4 Pound cake 0·9 1·3
Bread 2·7 0·9 Minced meat 1·0 1·5 Dry sausage 0·9 1·4
Pizza 2·6 1·0 Rabbit 0·9 1·4 Pan bagnat 0·7 1·1
Potato 2·6 0·9 Spinach 0·8 1·5 Camembert 0·6 1·1
French beans 2·5 0·8 Cream cake 0·8 1·2 Roquefort 0·5 1·0
Roquefort 2·4 1·2 Pork chop 0·7 1·2 Bread 0·5 0·9
Pear 2·4 1·1 Dry sausage 0·7 1·3 Pasta 0·4 0·8
Rice 2·4 0·8 Omelette 0·5 1·1 Rabbit 0·4 0·9
Banana 2·3 1·2 Camembert 0·5 1·2 Beef 0·3 0·8
Pound cake 2·3 1·1 Turkey 0·5 0·9 Pork chop 0·3 0·8
Camembert 2·2 1·2 Roquefort 0·5 1·2 Tongue 0·3 0·9
Pan bagnat 2·2 1·0 Banana 0·4 1·0 Kidney 0·3 0·9
Omelette 2·1 1·0 Cauliflower 0·3 0·8 Potato 0·3 0·7
Cauliflower 2·0 0·9 Pan bagnat 0·2 0·6 Banana 0·3 0·7
Seafood 2·0 1·4 Pear 0·2 0·8 Black pudding 0·2 0·8
Dry sausage 2·0 1·3 Quatre quart 0·2 0·6 Rice 0·2 0·5
Cream cake 2·0 1·5 Chocolate 0·2 0·7 Omelette 0·2 0·6
Turkey 1·9 1·0 Pizza 0·2 0·6 Minced meat 0·2 0·5
Rabbit 1·8 1·3 Tart 0·1 0·4 Turkey 0·1 0·4
Spinach 1·6 1·4 Fish 0·1 0·4 Seafood 0·1 0·3
Pork chop 1·6 1·1 Pasta 0·1 0·4 Spinach 0·0 0·3
Minced meat 1·6 1·1 Rice 0·1 0·4 Fish 0·0 0·2
Beef 1·5 1·3 French beans 0·1 0·3 Cauliflower 0·0 0·2
Black pudding 1·0 1·2 Bread 0·1 0·3 French beans 0·0 0·2
Tongue 1·0 1·2 Salad 0·1 0·3 Pear 0·0 0·2
Kidney 0·6 1·1 Potato 0·0 0·2 Salad 0·0 0·1
. IP address:
118.70.52.165
, on
24 Jun 2021 at 12:05:40
, subject to the Cambridge Core terms of use, available at
https://www.cambridge.org/core/terms
.
and high meat-eating women were evident for the offal, red and white meats, dry sausage, spinach and pasta that were more unpopular for the low meat-eating women. Only pears aroused less disgust in low as compared with high meat-eating women. As regards positive emotions, high meat-eating women liked kid-neys and red meats more than the other women (Fig. 2), whereas low meat-eating women significantly preferred pears and French beans. Participants in both groups expressed a similar degree of liking for the other foods such as cheese, vegetables, fish, eggs, pastries or starchy foods. Differences in the other emotional words between both groups are described earlier.
Difference in mean emotional variables between low and high meat-eating women
The overall disagreements between both groups were shown on the PCA plot carried out with the mean differences of the six mean emotional variables between the low and high meat-eating women (Fig. 3). The first axis accounts for 81 % of the var-iance and shows the main source of disagreement between the two groups. On this axis, ‘indifference’ and ‘disappointment’ were opposed to ‘satisfaction’. The second axis accounts for a lower percentage of variance (7 %) than the first axis and is mainly explained by ‘guilt’ and ‘doubt’. Red meats, roast beef and minced meat located on the right-hand side aroused much more ‘disappointment’ in low than in high meat-eating women (Fig. 3 and Table 5). Conversely, pears, banana, fruit tart and French beans on the left-hand side aroused less ‘disappointment’ in low than in high meat-eating women. ‘Indifference’ was also Fig. 1. Emotional discrimination of thirty food pictures by canonical (CAN) variate analysis. For legibility reasons, only fifteen out of thirty ellipses are shown. When two means (*) are very close together, their ellipses are partially superimposed.
Table 4. Cluster of emotional variables
Emotional cluster Emotional words
Correlation with the average variable 1 Disgust 0·79 Embarrassment 0·76 Disappointment* 0·85 Regret 0·76 Frustration 0·67 2 To like 0·91 Pleasure 0·92 Content 0·92 Satisfaction* 0·93 Delight 0·87 Thrilled 0·92 Rejoicing 0·90 Serene 0·63 Interest 0·80 Impatience 0·71 3 Guilt* 0·76 Nostalgia* 0·80 4 Uneasiness 0·85 Vigilant 0·85 Doubt* 0·86 Hesitation 0·76 5 Amused* 0·83 Astonishment 0·63 Pride 0·75 6 Indifference* 0·88 Lassitude 0·73
*Emotional word that best correlated with the average of the words from the cluster.
. IP address:
118.70.52.165
, on
24 Jun 2021 at 12:05:40
, subject to the Cambridge Core terms of use, available at
https://www.cambridge.org/core/terms
.
Fig. 2. Differences in disgust (a) and liking (b) between low ( – V–) and high (–B–) meat-eating women.
Fig. 3. Differences in mean (DIM) emotional variables between low and high meat-eating women. A virtual product identified by a symbol (V) on the map with null coordinates for each mean emotional variable was superimposed on the principal component analysis plot to show the location for which no difference was detected between low and high meat-eating women. Thus, the orthogonal projection of this point on the emotional vector discriminated the food into two groups. In other words, when the orthogonal projection of a food picture on an arrow variable is located in the vector direction and well in front of the diamond projection, low meat-eating women felt more emotion towards that food.
. IP address:
118.70.52.165
, on
24 Jun 2021 at 12:05:40
, subject to the Cambridge Core terms of use, available at
https://www.cambridge.org/core/terms
.
Table 5 . Significant differences in mean emotion v ariables felt by the low and high meat-eating women towards food products Satisfaction Amused Disappointment Doubt Indifference Guilt Low High P Low High P Low High P Low High P Low H igh P Low High P Roast beef 0·69 1 ·69 , 0 ·001 0 ·23 0 ·44 NS 1 ·28 0 ·47 0 ·001 1 ·47 0·49 0 ·01 1 ·03 0·39 0 ·01 0 ·29 0 ·37 NS Minced meat 0·83 1 ·56 0 ·00 0 ·23 0 ·29 NS 0 ·96 0 ·37 0 ·01 1 ·09 0·61 0 ·08 1 ·00 0·48 0 ·01 0 ·27 0 ·24 NS Kidney 0·30 0 ·75 0 ·04 0 ·30 0 ·36 NS 1 ·75 1 ·42 NS 1 ·45 1·37 NS 1 ·03 0·74 NS 0 ·30 0 ·22 NS Dry s ausage 1·31 1 ·42 0 ·08 0 ·39 0 ·33 NS 0 ·77 0 ·56 NS 0 ·92 0·63 NS 0 ·72 0·47 NS 0 ·58 0 ·80 NS Black pudding 0·59 1 ·03 0 ·09 0 ·34 0 ·45 NS 1 ·39 0 ·99 NS 1 ·20 0·89 NS 0 ·95 0·65 NS 0 ·36 0 ·22 NS Tongue 0·66 0 ·82 NS 0 ·35 0 ·37 NS 1 ·25 1 ·33 NS 1 ·22 1·25 NS 0 ·92 0·58 0 ·08 0 ·37 0 ·31 NS Pork chop 1·04 1 ·30 NS 0 ·32 0 ·22 NS 0 ·69 0 ·52 NS 0 ·94 0·48 0 ·04 1 ·03 0·81 NS 0 ·38 0 ·20 NS Rabbit 1 ·22 1 ·57 NS 0 ·39 0 ·39 NS 0 ·81 0 ·59 NS 0 ·76 0·41 0 ·10 0 ·69 0·36 0 ·08 0 ·46 0 ·61 NS Turkey 1 ·28 1 ·57 NS 0 ·24 0 ·18 NS 0 ·49 0 ·37 NS 0 ·70 0·25 0 ·01 0 ·81 0·81 NS 0 ·27 0 ·15 NS Pear 2·11 1 ·70 0 ·07 0 ·54 0 ·38 NS 0 ·11 0 ·39 0 ·03 0 ·22 0·27 NS 0 ·34 0·56 NS 0 ·25 0 ·10 NS Banana 2·00 1 ·85 NS 0 ·65 0 ·43 NS 0 ·17 0 ·42 0 ·06 0 ·26 0·20 NS 0 ·35 0·47 NS 0 ·27 0 ·35 NS Fruit tart 2 ·39 2 ·23 NS 0 ·64 0 ·41 NS 0 ·23 0 ·46 0 ·06 0 ·30 0·36 NS 0 ·23 0·29 NS 0 ·84 0 ·93 NS Pound cake 1·90 1 ·79 NS 0 ·58 0 ·34 NS 0 ·44 0 ·38 NS 0 ·56 0·37 NS 0 ·43 0·49 NS 0 ·90 0 ·68 NS French beans 2·08 1 ·82 NS 0 ·43 0 ·37 NS 0 ·12 0 ·27 0 ·08 0 ·23 0·19 NS 0 ·32 0·48 NS 0 ·21 0 ·26 NS Cauliflower 1·66 1 ·46 NS 0 ·45 0 ·31 NS 0 ·31 0 ·39 NS 0 ·37 0·23 NS 0 ·42 0·71 0 ·10 0 ·23 0 ·22 NS Potato 2·10 1 ·95 NS 0 ·43 0 ·20 0 ·08 0 ·13 0 ·27 NS 0 ·23 0·11 NS 0 ·37 0·66 0 ·10 0 ·46 0 ·41 NS Pizza 1·90 2 ·16 NS 0 ·50 0 ·41 NS 0 ·43 0 ·33 NS 0 ·70 0·31 0 ·03 0 ·61 0·43 NS 0 ·65 0 ·83 NS Pasta 2 ·15 2 ·33 NS 0 ·39 0 ·48 NS 0 ·30 0 ·13 NS 0 ·30 0·09 0 ·10 0 ·52 0·44 NS 0 ·54 0 ·54 NS Pan b agnat 1·76 1 ·76 NS 0 ·61 0 ·49 NS 0 ·46 0 ·28 NS 0 ·90 0·53 NS 0 ·45 0·49 NS 0 ·66 0 ·49 NS Camembert 1 ·73 1 ·79 NS 0 ·40 0 ·18 0 ·09 0 ·43 0 ·49 NS 0 ·51 0·37 NS 0 ·50 0·50 NS 0 ·46 0 ·63 NS *P values are shown when P # 0· 1 0 (t test). . IP address: 118.70.52.165 , on 24 Jun 2021 at 12:05:40
, subject to the Cambridge Core terms of use, available at
https://www.cambridge.org/core/terms
.
strongly felt for red meats, tongue and rabbit, but weakly for cauliflower and potato in low meat-eating women (Fig. 3 and Table 5). Not only red meats (roast beef, minced meat and pork chop) and white meats (turkey and rabbit) but also pizza and pasta aroused more doubt in this last group. However, some food products aroused more positive emotions in low than in high meat-eating women. Thus, pears and French beans gave more satisfaction, and potatoes and Camembert amused the low more than the high meat-eating women. Red meats, kidney, dry sausage and black pudding mainly gave more satisfaction to the high meat-eating women (Table 5).
Discussion
The present study showed that, first, women generally felt more positive than negative emotions towards foods. Second, negative emotions were represented by more different words than positive ones since four and two dimensions sustained them, respectively. Third, the low meat-eating women generally felt more ‘disap-pointment’, ‘indifference’ and ‘doubt’ towards not only red meats but other food products as well such as white meats, dry sausage, tongue, pan bagnat, pasta, potatoes and pizza, suggesting a negative attitude towards meat products and some starchy foods. Emotion has often been considered as a physiological reaction to a specific stimulus. However, emotion cannot be confined to the consequences of physiological reactions, as suggested by recent cognitive theories. As stated by Schachter & Singer (1962) and Cacioppo et al. (1993), physiological changes are not differentiated enough to account for variation in emotional states that can be labelled by verbal expressions. In the present study, analysis of emotional words associated with food products showed that not only ‘disgust’ or ‘liking’ are key words but more complex emotions such as ‘uneasiness’, ‘guilt’, ‘doubt’, ‘embar-rassment’, ‘disappointment’, ‘vigilant’, ‘satisfaction’, ‘delight’, ‘serene’, ‘interest’, ‘content’ and ‘lassitude’, as well. These words, used to express subjective states, revealed that emotion linked to food intake was not just aroused by physiological reac-tions but also by cognireac-tions. These cognireac-tions are the result of the subjects’ previous experience with objects or situations. In the present study, that previous experience probably played an important part since we asked participants to imagine eating the food shown on a picture.
Furthermore, emotion depends on the meaning given to an event or a stimulus by an evaluation process. The emotional evaluation is either positive (pleasant) or negative (unpleasant) and with a low or high intensity (Lazarus, 1991; Scherer, 1998). The results of the present study reveal the importance of these subjective states linked to the evaluation of food products. In general, the participants expressed positive emotions towards food except offal and, to a lesser extent, red meats. Positive emotions towards foods were associated with the pleasure of eating which was elicited by foods such as chocolate, pasta, tarts, salad, fish, bread, pizza and potatoes. The present study showed that although less strong, negative emotions towards food were more diversified than positive emotions. Among the twenty-six words related to emotions elicited by food, the partici-pants used ‘disappointment’ (associated with disgust,
embarrass-ment, regret and frustration), ‘doubt’ (associated with
uneasiness, vigilant and hesitation), ‘guilt’ (associated with nos-talgia) and ‘indifference’ (associated with lassitude) to character-ise the negative features of food. In contrast, the positive words
were only ‘satisfaction’ and ‘amused’. These negative concepts might help to explain food choice in terms of avoidance in women. Thus, ‘disappointment’ and ‘guilt’ differentiated well between food pictures, as well as between low and high meat-eating women, as we discuss later. As expected, offal and red meats were the most unpopular food products and aroused the most disappointment among the participants. Different causes of ‘disappointment’ for food should be advanced. As suggested ear-lier, not just appearance but other sensory components of food as well such as taste, texture or odour play an important part in pre-ference. Kenyon & Barker (1998) and Kubberod et al. (2002) showed that the sight of blood or the red colour of meat products evokes images of animal death and induces disgust in women. Consequently, disgust should be related to cruelty refusal. It is also caused by a variety of political concerns and moral beliefs that constitute the basis of moral vegetarianism. This type of belief often induces strict avoidance of all meats (Rozin et al. 1997). Because meat is often considered as unhealthy, meat avoidance for health reasons should be the second ground for rejection (health vegetarianism). Moreover, Fessler et al. (2003) determined a third ground for meat avoidance that is induced by meat taste. Meat consumption was higher in meat-taste avoi-ders than in meat-health avoiavoi-ders. The lowest intake was associ-ated with the ethical and environmental meat avoiders. These three categories of meat avoiders did not differ from one another on overall disgust sensitivity. Unlike the results of the study by Fessler et al. (2003) there was an overall difference in disgust towards meat products between high and low meat-eating women in the present study. High meat-eating women were gen-erally less disgusted by meats than low meat-eating women. This difference in results could be explained either by the difference in meat consumption frequency in both studies or by the test differ-ences between the two studies. Meat consumption in the strongest meat-avoider group was 6·6 servings per week in the former study whereas it was 3·6 in the latter study. Meat consumption in the weakest meat-avoider group was 11·8 servings per week in the first study and 7·2 in the second study. Meat avoidance might not be strong enough (6·6 servings/d) in the participants in the Fessler et al. (2003) study to be related to real meat disgust. Another hypothesis is that the emotional test in the present study should be more directly linked to meat consumption than to the general disgust sensitivity test (Haidt et al. 1994).
The present study also showed that ‘disappointment’ and ‘dis-gust’ for red meats was higher than that for white meats, and higher in low meat than in high meat-eating women. Thus, the low meat-eating women liked meat less in general. Furthermore and surprisingly enough, negative emotions were not limited to meat products in the low meat-eating women. They were also ‘disappointed’ by and had ‘doubts’ about other food products such as pasta and pizza. Surprisingly, low meat-eating women liked only two more foods; pears and French beans. Thus, overall eating pleasure might have been lower in women who consumed few meat products, since negative emotions were strongly felt, not only for meat products but also for other food products. Contrary to our expectations, the low meat-eating women did not compen-sate for their ‘disappointment’ with meat products by a stronger liking for other food products except pears and French beans.
The ‘doubt’ for foods such as pasta or pizza could be explained by their reputation for making individuals gain weight. Knowl-edge of food nutrient content, even if it is false, can alter emotions towards food. Macht et al. (2003) observed that negative
. IP address:
118.70.52.165
, on
24 Jun 2021 at 12:05:40
, subject to the Cambridge Core terms of use, available at
https://www.cambridge.org/core/terms
.
emotions occurred more frequently when the energy content of the foods increased. The higher the energy content of the food, the more ‘unhealthy’ and ‘dangerous’ it was perceived. The ten-dency of individuals to view meat products as being high in energy and fat explains their rejection of these foods (Holm & Mohl, 2000; Lea & Worsley, 2001). Moreover, these overall negative attitudes towards foods might be caused by the multitude and extensiveness of health promotion programmes that highlight slimness. The consequences of these programmes are that food and eating have become a source of stress and substantial worry among women (Stein & Nemeroff, 1995). The pleasure of eating might be viewed as a ‘vice’ instead of being seen as one of life’s harmless enjoyments. Moreover, women who were characterised by a high concern for controlling weight and dieting (restraint) showed higher emotional reactions to foods (Macht et al. 2003). In the case of pathological eating disorders, volun-teers reported higher levels of disgust toward foodstuffs of animal origin, as well as towards the human body. Eating dis-orders are associated with increased disgust specific to food and the body (Troop et al. 2002).
Since meat is generally considered fatty and because it was consumed less by low meat-eating women, we initially assumed that their energy intake might be lower than that of other partici-pants. However, in the present study, the energy intakes were similar in low and high meat-eating women. Since the energy intake was similar between the low and high meat-eating women in the present study, it is likely that the low meat-eating women compensated for their low meat consumption with a higher consumption of other foods. The low meat-eating women tended to have a higher energy intake from sweets and vegetables. In the present study, they showed a preference for some of these foods (fruit tart, chocolate, pound cake, pears, banana, potatoes, cauliflower, French beans). The reason for this consumption pre-ference for fruit and vegetables might be found in the healthy image of those foods and in the association with weight loss (Oakes, 2003). Sweets are liked for the pleasure they bring, but they also generate guilt as well as conflicts between sensory appeal for good taste and expected implication for health or body image (Olsen, 1999). Thus, emotion towards foods is com-plex because some foods can be evaluated both positively and negatively at the same time. The negativity is less related to basic emotions such as pleasure or disgust than ‘self-conscious’ emotions such as guilt. The specificity of meat may be to arouse guilt for both its animal origin and its supposedly fatty content. However, in the present study, less guilt was felt towards meats than towards the other fatty food products; chocolate, cream cake, fruit tart, pizza and pound cake. Disgust, disappoint-ment, doubt and indifference, more than guilt, could explain low meat consumption; the consequences of the consumption of fatty food on body weight could be the grounds for feelings of guilt.
In conclusion, the low meat-eating women, although belonging to a non-clinical population, generally felt more negative emotions towards meat products, and other food products as well, than their counterparts. This might be indicative of a proble-matic relationship with food and not only with meat products, although their energy intake was similar to that of high meat-eating women. The consequences of this general emotional state towards food are twofold. First, low meat-eating women more than high meat-eating women are at risk of Fe deficiency because of their lower consumption of haeme Fe-containing foods. Second, since women play a determinant part in food education,
there is a risk that they might pass their negative emotions towards foods on to their children. From the perspective of health education, it is crucial to continue research into the emotions elicited by food and their influence on eating behaviours.
Acknowledgements
We are grateful to Daniel Effron for his valuable advice, and to L. Debarge and C. Ferreira for their technical assistance.
References
Baars BJ (1994) A global workspace theory of conscious experience. In
Consciousness in Philosophy and Cognitive Neuroscience, pp.
149 – 171 [A Revonsuo and M Kamppinen, editors]. Hillsdale, NJ: Lawrence Earlbaum Associates.
Cabanac M (2002) What is emotion? Behav Processes 60, 69 – 83. Cacioppo J, Klein D, Berntson G & Hatfield E (1993) The
psychophysiol-ogy of emotion. In Handbook of Emotion, pp. 119 – 142 [M Lewis and JM Harviland, editors]. New York: Guilford Press.
Chambers E IV & Bowers JR (1993) Consumer perception of sensory qualities in muscle foods. J Food Sci 46, 1902 – 1906.
Ekman P, Levenson RW & Friesen WV (1983) Autonomic nervous
system activity distinguishes among emotions. Science 221,
1208 – 1210.
EPIBASE (1999) Une Base de Donne´es Biome´dicales, version 1·1H. Dijon, France: INRA Editions.
Fazio RH & Zanna MP (1981) Direct experience and attitude-behavior consistency. In Advances in Experimental Social Psychology, pp. 162 – 202 [L Berkowitz, editor]. New York: Academic Press. Fessler DMT, Arguello AP, Mekdara JM & Macias R (2003) Disgust
sen-sitivity and meat consumption: a test of an emotivist account of moral vegetarianism. Appetite 41, 31 – 41.
Galan P, Yoon HC, Preziosi P, et al. (1998) Determining factors in the iron status of adult women in the SU.VI.MAX study. Eur J Clin Nutr 52, 383 – 388.
Gregory NG (1997) Meat, meat eating and vegetarianism. A review of the facts. In Proceedings of the 43rd International Congress of Meat Science and Technology, pp. 68 – 85 [J Bass, editor]. Auckland, New Zealand: ICOMST.
Guinot C, Latreille J, Malvy D, Preziosi P, Galan P, Hercberg S, Tenenhaus D (2001) Use of multiple correspondence analysis and clus-ter analysis to study dietary behaviour: food consumption questionnaire in the SU.VI.MAX. cohort. Eur J Epidemiol 17, 505 – 516.
Guzman MA & Kjaernes U (1998) Humans and Animals – a Qualitative Study. SIFO Report no. 6. Lysaker, Norway: The National Institute for Consumer Research.
Haidt J, McCauley CR & Rozin (1994) A scale to measure disgust sensi-tivity. Pers Individ Dif 16, 701 – 713.
Holm L & Mohl M (2000) The role of meat in everyday food culture: an analysis of an interview study in Copenhagen. Appetite 34, 277 – 283. Hulten L, Gramatovski E, Gleerup A & Hallberg L (1995) Iron-absorption
from the whole diet – relation to meal composition, iron requirements and iron stores. Eur J Clin Nutr 49, 794 – 808.
Juillard E (2003) Lexique e´motionnel et consommation alimentaire: le cas plus spe´cifique des produits carne´s aupre`s de la population fe´mi-nine (Emotional lexicon and food consumption: the specific case of meat products in women). MSc Thesis, University of Psychology, Clermont-Ferrand.
Kenyon PM & Barker ME (1998) Attitudes towards meat-eating in veg-etarian and non-vegveg-etarian teenage girls in England – an ethnographic approach. Appetite 30, 185 – 198.
. IP address:
118.70.52.165
, on
24 Jun 2021 at 12:05:40
, subject to the Cambridge Core terms of use, available at
https://www.cambridge.org/core/terms
.
Kubberod E, Ueland O, Roodbotten M, Westad F & Risvik E (2002) Gender specific preferences and attitudes towards meat. Food Qual Pref 13, 285 – 294.
Lazarus RS (1991) Emotion and Adaptation. Oxford: Oxford University Press.
Lea E & Worsley A (2001) Influences on meat consumption in Australia. Appetite 36, 127 – 136.
Lea E & Worsley A (2002) The cognitive contexts of beliefs about healthiness of meat. Public Health Nutr 5, 37 – 45.
Leyens JP, Paladino PM, Rodriguez-Torres R, Vaes J, Demoulin S, Rodri-guez-Perez A & Gaunt R (2000) The emotional side of prejudice: the attribution of secondary emotions to ingroups and outgroups. Pers Soc Psychol Rev 4, 186 – 197.
Macht M, Gerer J & Ellgring H (2003) Emotions in overweight and normal-weight women immediately after eating foods differing in energy. Physiol Behav 80, 367 – 374.
Millar MG & Tesser A (1986) Effects of affective and cognitive focus on the attitude-behavior relation. J Pers and Soc Psychol 51, 270 – 276. Millar MG & Tesser A (1992) The role of beliefs and feelings in guiding behavior: the mismatch model. In The Construction of Social Judgements, pp. 277 – 300 [LL Martin and A Tesser, editors]. Hillsdale, NJ: Erlbaum. Mooney KM & Walbourn L (2001) When college students reject food: not
just a matter of taste. Appetite 36, 41 – 50.
Niedenthal P, Auxiette C, Nugier A, Dalle N, Bonin P & Fayol M (2004) A prototype analysis of the French category ‘emotion’. Emot Cogn 18, 289 – 312.
Oakes ME (2003) Differences in judgments of food healthfulness by young and elderly women. Food Qual Pref 14, 227 – 236.
Olsen SO (1999) Stength and conflicting valence in measurement of food attitudes and preferences. Food Qual Pref 10, 483 – 494.
Ortega RM, Lopez-Sobaler AM, Requejo AM, Quintas ME, Gaspar MJ, Andres P & Navia B (1998) The influence of meat consumption on dietary data, iron status and serum lipid parameters in young women. Int Vitam Nutr Res 68, 255 – 262.
Regan DT & Fazio RH (1977) On the consistency between attitudes and behavior: look to the method of attitude formation. J Exp Soc Psychol 13, 38 – 45.
Rousset S, Patureau Mirand P, Brandolini M, Martin JF & Boirie Y (2003) Daily protein intakes and eating patterns in young and elderly French. Br J Nutr 90, 1107 – 1115.
Rozin P, Markwith M & Stoess C (1997) Moralization and becoming a vegetarian: the transformation of preferences into values and the recruitment of disgust. Psychol Sci 8, 67 – 73.
Russell JA (1991) Culture and the categorization of emotions. Psychol Bull 110, 426 – 450.
SAS Institute Inc. (1998) SAS/STAT User’s Guide, release 8·01. Cary, NC: SAS Institute Inc.
Schachter S & Singer JE (1962) Cognitive, social, and physiological deter-minants of emotional state. Psychol Rev 69, 379 – 399.
Scherer K (1998) Appraisal theories. In Handbook of Cognition and Emotion, pp. 637 – 663 [T Dalgleish and M Power, editors]. Chichester: Wiley.
Scherer KR (2005) Emotion. In Introduction to Social Psychology, 3rd ed., pp. 1 – 46 [M Hewstone and W Stroebe, editors]. Oxford: Blackwell.
Searle JR (1998) How to study consciousness scientifically. Philos Trans R Soc Lond Biol Sci 353, 1935 – 1942.
Shaw NS, Chin CJ & Pan WH (1995) A vegetarian diet rich in soybean pro-ducts compromises iron status in young students. J Nutr 125, 212 – 219. Smith CA & Lazarus RS (1993) Appraisal components, core relational
themes, and the emotions. Cogn Emot 7, 233 – 269.
Stein RI & Nemeroff CJ (1995) Moral overtones of food: judgments of others based on what they eat. Pers Soc Psychol 21B, 480 – 490. SU.VI.MAX (1994) Portions Alimentaires: Manuel Photos pour
l’Esti-mation des Quantite´s (Food Portions: Photographic Manual for Estimat-ing Quantity). [S Hercberg, M Deheeger and P Preziosi, editors]. Paris: Polytechnica.
Troop NA, Treasure JL & Serpell L (2002) A further exploration of dis-gust in eating disorders. Eur Eat Disord Rev 10, 218 – 226.
Worsley A & Skrzypiec G (1998) Do attitudes predict red meat consump-tion among young people? Ecol Food Nutr 37, 163 – 195.
Zammuner VL (1998) Concepts of emotions: ‘emotionness’ and dimensional ratings of Italian emotion words. Cogn Emot 12, 243 – 272.
. IP address:
118.70.52.165
, on
24 Jun 2021 at 12:05:40
, subject to the Cambridge Core terms of use, available at
https://www.cambridge.org/core/terms
.