Changes in Basal and Insulin and Amino Acid
Response of Whole Body and Skeletal Muscle Proteins
in Obese Men
Christelle Guillet, Ingrid Delcourt, Melanie Rance, Christophe Giraudet, Stephane Walrand, Mario Bedu,* Pascale Duche, and Yves Boirie
Universite´ Clermont 1 (C.Gu., Y.B.), Unite´ de Formation et de Recherche Me´decine, Unite´ Mixte de Recherche (UMR) 1019, Centre de Recherche en Nutrition Humaine-Auvergne, Clermont-Ferrand, F-63009 France; Centre Hospitalier Universitaire Clermont-Ferrand (I.D., Y.B.), Hospital Gabriel Montpied, Clinical Nutrition Unit, Clermont-Ferrand, F-63001 France; Laboratory of Exercise Biology (M.R., M.B., P.D.), Auvergne and Blaise-Pascal University, Clermont-Ferrand, F-63000 France; and Institut National de la Recherche Agronomique, UMR 1019 (C.Gi., S.W., Y.B.), Clermont-Ferrand, F-63009 France
Context: Obesity-related insulin resistance of glucose and lipid metabolism may also affect protein
kinetics, notably at the muscle level.
Objective: We hypothesized that muscle protein response to insulin and amino acid is blunted
during obesity.
Research Design and Methods: Total (Tot) and mitochondrial (Mit) muscle proteins fractional
synthesis rates (FSR) together with whole-body protein kinetics (WB) have been determined in postabsorptive state (PA) and during a hyperinsulinemic, hyperaminoacidemic, euglycemic clamp
by using a continuous infusion of13C-leucine in six obese and eight nonobese subjects.
Results: Responses of WB glucose disposal rate and protein breakdown to insulin and amino acid
infusion were significantly lower in obese than in nonobese subjects (P⬍ 0.05). In PA, Tot and Mit FSR were significantly lower (P⬍ 0.05) in obese (Tot, 0.044 ⫾ 0.005% 䡠 h⫺1; Mit, 0.064⫾ 0.008% 䡠 h⫺1) in comparison with nonobese subjects (Tot, 0.082⫾ 0.010% 䡠 h⫺1; Mit, 0.140⫾ 0.006% 䡠 h⫺1). Tot FSR
was similarly stimulated by insulin and amino acid in both groups (0.094 ⫾ 0.013 vs. 0.117 ⫾
0.006%䡠 h⫺1, obese vs. nonobese; P⬍ 0.05). Mit FSR was increased in nonobese subjects (0.179 ⫾
0.007%䡠 h⫺1; P⬍ 0.05) but not in obese subjects (0.078 ⫾ 0.012% 䡠 h⫺1; P⫽ not significant).
Conclusions: The obesity-related impairment of protein metabolism is characterized by 1) a
re-duced turnover rate of skeletal muscle proteins in PA; 2) a lack of stimulation of mitochondrial protein synthesis by insulin and amino acid; and 3) a lower inhibition of WB proteolysis by insulin and amino acid. Alterations of selective muscle protein kinetics may predispose obese subjects to muscle metabolic dysfunction leading to type 2 diabetes. (J Clin Endocrinol Metab 94: 3044 –3050,
2009)
I
n obesity, insulin resistance is characterized by impairments in glucose and lipid metabolism (1). However, insulin is also an important regulator of protein metabolism because this hor-mone and amino acids (AA) are key factors for the regulation of body protein mass (2). The main in vivo effect of insulin and AAon whole-body and skeletal muscle protein metabolism is to in-hibit protein breakdown and to stimulate protein synthesis (3– 5). In obesity, the control of protein metabolism by these factors might be impaired as in other situations of insulin resistance (type 2 diabetes, aging) (6 – 8).
ISSN Print 0021-972X ISSN Online 1945-7197 Printed in U.S.A.
Copyright © 2009 by The Endocrine Society
doi: 10.1210/jc.2008-2216 Received October 10, 2008. Accepted May 15, 2009. First Published Online May 26, 2009
* Deceased, February 2006
Abbreviations: AA, Amino acid(s); BMI, body mass index; Endo Leu Ra, endogenous leucine Ra; FFM, fat free mass; FSR, fractional synthesis rate; KIC, ketoisocaproate; NS, not sig-nificant; PA, postabsorptive (state); Ra, rate of appearance; Tot, total muscle; VO2max,
maximal oxygen consumption.
E n d o c r i n e R e s e a r c h
3044 jcem.endojournals.org J Clin Endocrinol Metab, August 2009, 94(8):3044 –3050
More precisely, some authors have observed in obese subjects an impairment of insulin ability to reduce whole-body protein breakdown (9, 10), whereas other reports have challenged this conclusion (11, 12). In these studies, the effect of insulin alone has been investigated on whole-body protein metabolism. How-ever, hyperinsulinemia is associated with a decrease in plasma AA concentration leading to changes in the regulation of protein metabolism (4). Luzi et al. (10) found a normal stimulation of protein synthesis in obese persons during hyperaminoacidemia with basal insulinemia, suggesting that whole-body protein syn-thesis is still responsive to infusion of AA alone during obesity. A recent study has considered the role of insulin in discarding any specific AA effect by clamping plasma AA at their postabsorptive state (PA) concentrations during a hyperinsulinemic clamp (13). In these conditions in obese women, the blunted whole-body protein anabolic response to the action of insulin results mainly from an impaired stimulation of protein synthesis. All these stud-ies have been performed at the whole-body level, but this alter-ation may likely occur in muscle tissue because skeletal muscle is one of the main sites of insulin resistance (14). In obesity, the regulation of skeletal muscle protein turnover by hormones and nutrients is still unknown, although some alterations in skeletal muscle have been reported. For instance, obese Zucker rats are characterized by a lower amount of skeletal muscle mass (15). Skeletal muscle in obese subjects contains less oxidative type I fibers and more glycolytic type II fibers (16, 17), and it is char-acterized by a decrease in oxidative capacities, associated with insulin resistance (18). These changes imply that the ability of mitochondria to oxidize substrates, notably fatty acids, in obese subjects is altered (19 –21), leading to the accumulation of lipids within skeletal muscle (22). Regarding all these modifications, we hypothesized that the turnover rate of specific muscle pro-teins in obese subjects might be affected and could contribute to changes in obesity-related muscle characteristics. In addition, because insulin stimulates mitochondrial protein turnover in healthy individuals (23, 24), the response of mitochondrial pro-tein synthesis to insulin and AA might also be affected during obesity. Therefore, to address these issues, we investigated mus-cle protein metabolism in the PA and in response to insulin and AA in nonobese and obese subjects.
Subjects and Methods
SubjectsThe study has included six obese and eight nonobese men with a body mass index (BMI) between 30 and 35 kg/m2for obese subjects and
be-tween 18.5 and 30 kg/m2for nonobese subjects. Physical characteristics
of the subjects are indicated in Table 1. Body composition was assessed by dual-energy x-ray absorptiometry (Hologic QDR-4500A; Hologic, Waltham, MA). All volunteers had normal physical examinations with-out any diagnosed or previous disorders such as cardiovascular, kidney, digestive, endocrine, or chronic diseases and did not take any medication. All subjects consumed a weight-maintaining diet for 4 d before the study and were asked not to change their physical activity. Maximal oxygen consumption (VO2max) (liters䡠 min⫺1) was measured during cycling
er-gometry (Ergomeca Sorem, Toulon, France) by direct gas analysis from a maximal test. Individuals were asked not to perform any intense ex-ercise for several hours before the testing session. To consider the
dif-ference in body composition, VO2maxwas expressed by fat free mass
(ml/min/kg FFM). The purpose and potential risks of the study were explained to all subjects, and their voluntary written consent was ob-tained before their participation. The experimental protocol was con-ducted in accordance with the guidelines in the Declaration of Helsinki and was approved by the Ethical Committee of the Auvergne region (agreement no. AU 415; September 2001).
Experimental protocol
Subjects were studied after a 10-h overnight fast. On the day of the experiment, a first catheter was retrogradely inserted into a vein of the left arm and used for blood sampling. The hand of the subject was in-troduced into a ventilated box heated to 60 C to obtain arterialized blood. A second catheter was inserted into the contralateral arm for tracers, insulin, or AA infusions. A third catheter was inserted into the same arm for the administration of 20% glucose solution at rates ad-justed for periodic plasma glucose measurements. After a prime dose of [13C]bicarbonate (6 mg/5 ml within 1 min), a primed (8.4mol/kg FFM)
continuous (0.14mol 䡠 min⫺1䡠 kg FFM⫺1) infusion of L-[1-13C]leucine in
combination with a primed (3 mg/kg) continuous (0.05 mg䡠 min⫺1䡠 kg⫺1)
infusion of D-[6,6-2H
2]glucose was performed during 8 h (Fig. 1). The
L-[1-13C]leucine infusion rate was increased (0.21mol/kg FFM 䡠 min)
during the hyperaminoacidemic insulinemic clamp to account for the higher dilution rate of the tracer by exogenous AA. At the end of the 4-h basal period, insulin and a 10% Primene AA solution (Clintec Parenteral S.A., Montargis, France) were continuously administered for 4 h at rates of 0.7 mIU䡠 min⫺1䡠 kg FFM⫺1and of 0.028 ml䡠 min⫺1䡠 kg FFM⫺1,
respectively (Fig. 1). Plasma glucose concentration was determined every 5 min using a glucose oxidase method (glucose analyzer 2; Beckman, Fullerton, CA) and was maintained constantly at 90 –92 mg/dl by a periodic adjustment of the 20% glucose infusion according to the neg-ative feedback principle. Blood samples were taken at baseline, then at 20-min intervals during the last hour of each period. Plasma supernatant was separated, an internal standard was added, and the sample was kept at⫺20 C until additional analysis. Breath samples were taken before any infusion and then at 20-min intervals during the last hour of each period in 10-ml Vacutainers (BD Biosciences, Grenoble, France) to evaluate
13CO
2enrichment. Total carbon dioxide production rates were
mea-sured by open circuit indirect calorimetry (Deltatrac; Datex, Geneva, Switzerland) to determine leucine oxidation. Muscle biopsies were taken TABLE 1. Physical characteristics of subjects
Nonobese (nⴝ 8) Obese (nⴝ 6) Age (yr) 26.1⫾ 3.9 24.4⫾ 4.0 Body weight (kg) 79.3⫾ 6.5 101.1⫾ 8.0a BMI (kg/m²) 24.7⫾ 2.2 32.5⫾ 1.9a FFM (kg) 64.9⫾ 4.5 71.5⫾ 6.7a FFM (%) 82.7⫾ 5.9 70.7⫾ 4.5a Fat mass (%) 17.3⫾ 6.0 29.3⫾ 4.5a VO2max(ml/min䡠 kg FFM) 45.0⫾ 4.2 38.4⫾ 2.7 Glycemia (mg/dl) 88⫾ 1 87⫾ 1
Plasma insulin (U/ml)
PA 9.8⫾ 0.6 8.8⫾ 1.4
Ins 45.8⫾ 14.4b
77.0⫾ 2.1a,b
Plasma leucine (mol/liter)
PA 143.0⫾ 17.7 158.2⫾ 15.2
Ins 291.2⫾ 41.7b
332.1⫾ 27.1b
Plasma amino acid (mol/liter)
PA 2634.2⫾ 107.0 2504.4⫾ 118.8
Ins 4002.9⫾ 221.0b
4036.2⫾ 106.6b
Values are expressed as mean⫾SEM. Ins, Insulin and amino acid clamp.
aP⬍ 0.05, obese vs. nonobese subjects.
bP⬍ 0.05, insulin and amino acid clamp vs. basal.
at 4 and 8 h from different legs as described (6) and were immediately frozen in liquid nitrogen and stored at⫺80 C until analysis.
Isolation of muscle proteins
A 150-mg piece of muscle biopsy was used for isolation of total and mitochondrial muscle proteins as previously described (6, 23). Muscle samples were homogenized in a 5% ice-cold buffer containing 0.25M
sucrose, 2 mMEDTA, and 10 mMTris-HCl (pH 7.4) using a Potter-Elvehjem homogenizer and spun at 700⫻ g at 4 C. Supernatant was spun at 10,000⫻ g. The resulting pellet was washed in 100 mMKCl, 5 mM
EGTA, 5 mMMgSO4, and 50 mMTris (pH 7.4) and centrifuged at
10,000⫻ g. This procedure was done twice. The mitochondrial pellet was finally suspended in the 5% ice-cold buffer. Muscle proteins were hydrolyzed using 6MHCl (110 C for 24 h), and the protein-derived AA were purified by cation exchange chromatography (Dowex 50W 8X; Bio-Rad Laboratories, Hercules, CA). AA were eluted in 4 ml of 4M
NH4OH and dried down in SpeedVac (Savant Instruments Inc.,
Hol-brook, NY). AA were derivatized as their N-acetyl-propyl and measure-ments of [13C]leucine enrichment in muscle proteins were performed
using a gas chromatography-isotope ratio mass spectrometer (Gas Sys-tem; Fisons Instruments, VG Isotech, Middlewich, UK) as previously described (6).
Isotopic enrichment of [13C]leucine in tissue fluid was used as precursor
pool enrichment (25) to calculate fractional synthesis rate (FSR). Tissue fluid AA were extracted from muscle tissue using perchloric acid as described (6) and analyzed as their t-butyldimethylsilyl ester derivative.
Analytical methods Plasma [2H
2]glucose, [13C]leucine, and ketoisocaproate (KIC)
en-richments and concentrations were measured by gas chromatography-mass spectrometry (Hewlett-Packard 5971A; Hewlett-Packard Co., Palo Alto, CA).13CO
2isotopic enrichments were measured with a gas
isotope ratio-mass spectrometer (Gas System, Fisons Instruments, VG Isotech). Plasma insulin concentrations were measured by ELISA test (BioSource Europe SA, Nivelles, Belgium).
Materials
L-[1-13C]leucine (99 molar percent excess) and D-[6,6-2H 2]glucose
(96 molar percent excess) were purchased from Euriso-top (Gif-sur-Yvette, France). Tracer solutions were tested for sterility and pyrogenic-ity before use and prepared in sterile apyrogen water. Throughout each experiment, tracers were membrane filtered through 0.22-m pore size filters. Tracer isotopic and chemical purity were checked by gas chro-matography mass spectrometry.
Human insulin (Actrapid; Novo Nordisk Pharmaceutique SA, Paris, France) used for the clamp was diluted in sterile saline just before the
infusion. A 20% glucose solution (Braun Medical S.A., Boulogne, France) was used to maintain blood glucose at baseline level. AA mixture (10% Primene) was purchased from Clintec, Parenteral S.A.
Calculations
Endogenous glucose production and glucose disposal rates were cal-culated from the dilution of labeled glucose in plasma using a mono-compartment model and Steele’s equations (26). Glucose disposal rate was obtained by calculating total glucose flux considering the time changes in glucose concentrations and enrichment of plasma glucose. Glucose production was estimated by subtracting the unlabeled glucose infusion rate from the total glucose rate of appearance (Ra).
Leucine kinetics were calculated according to the reciprocal pool model using KIC as an indicator of intracellular leucine enrichment (27). Those parameters were normalized for FFM to consider the differences in body composition between nonobese and obese subjects. The total leucine Ra was calculated from plasma isotopic dilution of [13C]leucine.
This flux includes the tracer infusion and unlabeled leucine infused with other AA to elevate AA concentrations 2- to 3-fold above the basal level. From this equation, endogenous leucine Ra (Endo Leu Ra), an indicator of whole-body protein breakdown, was calculated by subtracting the infused labeled leucine and the leucine administered with the AA solution during the clamp from the total leucine Ra. Nonoxidative leucine dis-posal, an index of whole-body protein synthesis, is calculated as the difference between total leucine Ra and leucine oxidation. Leucine oxidation was then calculated by measuring13CO
2production as the
product of CO2 production and 13CO2 enrichment divided by
[13C]KIC enrichment, because KIC is the immediate precursor of
ir-reversible leucine decarboxylation in cells. Finally, leucine balance is the difference between total leucine intake (tracer and AA infusions) and leucine oxidation.
Total muscle (Tot) and mitochondrial protein FSR (%䡠 h⫺1) was
cal-culated by measuring the time-related changes in protein-bound13C-leucine
enrichments, divided by the enrichment in the precursor pool (25). Insulin sensitivity of each subject was assessed on the basis of a clas-sical index of clamp-derived insulin sensitivity (28).
Statistical analysis
Values are presented as means⫾SEM. Body composition and bio-logical data between nonobese and obese subjects were compared using a Student’s t test. Metabolic parameters were compared between both groups by two-way ANOVA for repeated measurements, with obesity and insulin clamp being the classifying factors. To consider the different insulin concentrations between groups, changes in glucose utilization and Endo Leu Ra were also analyzed by an analysis of covariance. When a significant effect was detected, differences among individual means were assessed with Fisher’s protected least significant difference post hoc test to determine pair-wise differences. The level of significant difference was set at P⬍ 0.05 for all statistical tests.
Results
Body composition
Body weight and BMI (Table 1) were higher in obese subjects than in nonobese subjects (P⬍ 0.05). This latter group included two overweight subjects with a BMI greater than 27 kg/m2
. However, we observed no major changes in the results after excluding these overweight subjects. Thus, the metabolic dis-crepancies obtained in this study are really the fact of obesity. FFM expressed in kilograms was significantly higher in obese subjects (P⬍ 0.05). However, when FFM was expressed as a percentage of body weight, it was significantly lower (P⬍ 0.05) in obese subjects compared with nonobese subjects (Table 1).
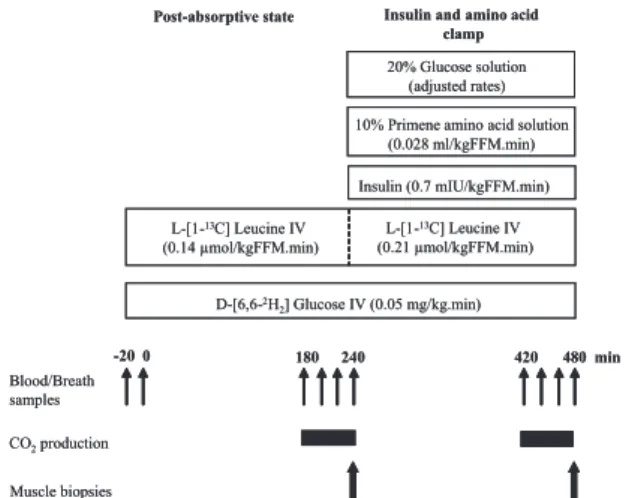
Post-absorptive state Insulin and amino acid clamp D-[6,6-2H 2] Glucose IV (0.05 mg/kg.min) L-[1-13C] Leucine IV (0.14 µmol/kgFFM.min) Insulin (0.7 mIU/kgFFM.min) 10% Primene amino acid solution
(0.028 ml/kgFFM.min) Blood/Breath samples CO2production -20 0 180 240 420 480 min 20% Glucose solution (adjusted rates) Muscle biopsies L-[1-13C] Leucine IV (0.21 µmol/kgFFM.min)
FIG. 1. Protocol design for the measurements of whole-body glucose and
protein metabolism in nonobese and obese subjects during hyperinsulinemic, hyperaminoacidemic euglycemic clamp.
The contribution of fat mass to body weight was greater in obese subjects (P⬍ 0.05). No difference was reported for VO2max. Plasma insulin, leucine, and AA concentrations
PA plasma insulin and leucine concentrations (Table 1) were not statistically different between both groups. After the clamp, a significant increase in plasma insulin was observed in both groups (P⬍ 0.05), this increase being greater in obese subjects (P⬍ 0.05). Plasma leucine concentrations (Table 1) were in-creased significantly during the clamp (P⬍ 0.05). There was no statistical difference in plasma AA concentrations (Table 1) be-tween the two groups in PA and after the clamp period. However, there was a significant increase of plasma AA during the insulin clamp (P⬍ 0.0001).
Glucose metabolism
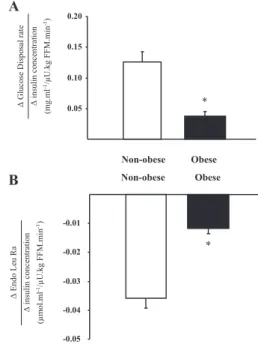
In PA, none of the parameters of glucose metabolism (Table 2) were different between the two groups of subjects (P⬍ 0.05). Glycemia during fasting state was normal and not different be-tween both groups of subjects. During the clamp, the glucose disposal rate increased significantly in obese and nonobese sub-jects. However, the insulin-mediated increase in glucose dis-posal, represented by the ratio between the change over PA glu-cose disposal rate and the change over PA plasma insulin concentration (7), was lower in obese subjects (0.04⫾ 0.01 vs. 0.13⫾ 0.02 mg 䡠 ml⫺1/U 䡠 kg FFM⫺1䡠 min⫺1, obese vs. nono-bese; P⬍ 0.05) (Fig. 2A). Endogenous glucose production was reduced by insulin similarly in nonobese and obese subjects [P⫽
not significant (NS)]. Insulin sensitivity index was significantly lower in obese subjects (0.06⫾ 0.01) than in nonobese subjects (0.19⫾ 0.03). According to the previous insulin sensitivity cutoff value (0.15) that we used to define insulin resistance (7), we considered the obese subjects as insulin resistant.
Leucine metabolism
After the clamp, the value of Endo Leu Ra (Table 2) was lower than in PA and was not different between both groups. However, when the differences in insulin concentration between the groups were considered, the ratio between the change over PA Endo Leu Ra and the change over PA insulin concentration was signifi-cantly lower in obese subjects (⫺0.012 ⫾ 0.002 vs. ⫺0.036 ⫾ 0.003mol 䡠 ml⫺1/U 䡠 kg FFM⫺1䡠 min⫺1, obese vs. nonobese;
P⬍ 0.05) (Fig. 2B). Nonoxidative leucine disposal (Table 2) was
lower in PA in obese subjects (P ⬍ 0.05). This parameter is stimulated by insulin and AA infusion in both groups (P⬍ 0.05).
Muscle protein FSR
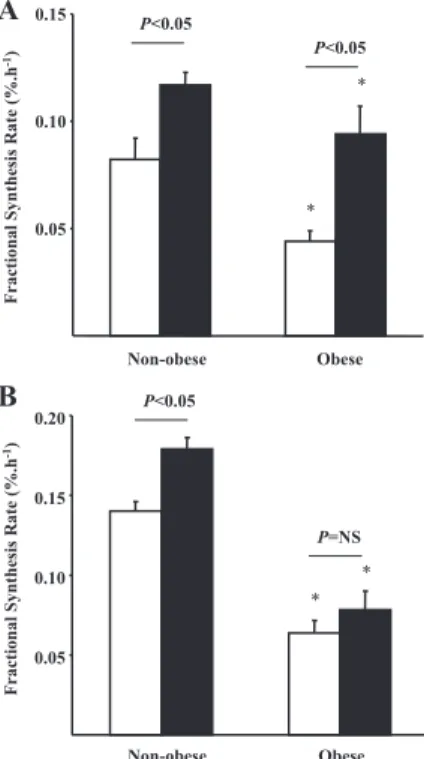
In PA, Tot and mitochondrial protein FSRs (Fig. 3) were sig-nificantly lower in obese subjects (Tot, 0.044⫾ 0.005% 䡠 h⫺1; mitochondrial, 0.064 ⫾ 0.008% 䡠 h⫺1) in comparison with nonobese subjects (Tot, 0.082 ⫾ 0.010% 䡠 h⫺1; mitochon-drial, 0.140⫾ 0.006% 䡠 h⫺1). In addition, basal muscle pro-tein synthesis rate is negatively related to fat mass (r2⫽ 0.42;
P⬍ 0.05) (Fig. 4). After insulin clamp, Tot FSR (Fig. 3A) was
stimulated in both groups (0.094 ⫾ 0.013 vs. 0.117 ⫾ 0.006%䡠 h⫺1, obese vs. nonobese; P⬍ 0.05). Mitochondrial FSR (Fig. 3B) was increased during insulin and AA infusion in nonobese subjects (0.179⫾ 0.007 vs. 0.140 ⫾ 0.006% 䡠 h⫺1, insulin clamp vs. basal; P⬍ 0.05) but not in obese subjects (0.078⫾ 0.012 vs. 0.064 ⫾ 0.008% 䡠 h⫺1, insulin clamp vs. basal; P⫽ NS).
TABLE 2. Whole-body glucose and leucine kinetics during
basal state and insulin clamp in nonobese and obese subjects Nonobese
(nⴝ 8)
Obese
(nⴝ 6)
Glucose disposal (mg/kg FFM䡠 min)
PA 2.98⫾ 0.16 3.21⫾ 0.24 Ins 7.12⫾ 0.31b 5.73⫾ 0.47b Glucose production (mg/kg FFM䡠 min) PA 2.95⫾ 0.42 3.29⫾ 0.54 Ins 0.34⫾ 1.02b 1.06⫾ 1.29b
Glucose infusion rates (mg/kg FFM䡠 min)
6.50⫾ 0.44 4.77⫾ 0.48a
Total leucine Ra (mol/kg FFM䡠 min)
PA 2.30⫾ 0.08 1.96⫾ 0.12
Ins 3.51⫾ 0.10b 3.41⫾ 0.09b
Endo Leu Ra (mol/kg FFM 䡠 min)
PA 2.16⫾ 0.07 1.83⫾ 0.12
Ins 0.95⫾ 0.05b 1.02⫾ 0.13b
NOLD (mol/kg FFM 䡠 min)
PA 1.83⫾ 0.07 1.38⫾ 0.10a
Ins 2.25⫾ 0.14b 1.69⫾ 0.07a,b
Leucine balance (mol/kg FFM䡠 min)
PA ⫺0.34 ⫾ 0.02 ⫺0.44 ⫾ 0.05
Ins 1.29⫾ 0.16b 0.67⫾ 0.11a,b
Values are expressed as mean⫾SEM. NOLD, Nonoxidative leucine disposal; Ins,
insulin and amino acid clamp.
aP⬍ 0.05, obese vs. nonobese subjects.
bP⬍ 0.05, insulin and amino acid clamp vs. basal.
-0.05 -0.04 -0.03 -0.02 -0.01 Obese Non-obese Δ Endo L eu Ra Δ insulin concentration (µm o l.ml -1/µ U.kg F F M.mi n -1) * 0.05 0.10 0.15 0.20 Obese Non-obese Δ Glucose Disposal rat e Δ insulin concentration (m g .m l -1/µU.kg FF M.m in -1) *
A
B
FIG. 2. Responses of glucose disposal (A) and protein breakdown (B) in
nonobese (white bars) and obese (black bars) subjects according to plasma insulin concentration obtained during a hyperinsulinemic, euglycemic,
hyperaminoacidemic clamp. *, P⬍ 0.05, obese vs. nonobese subjects.
Discussion
This study revealed impairments in protein metabolism in rela-tion to obesity-induced insulin resistance characterized by a lower inhibition of protein breakdown by insulin and AA. It was also demonstrated that skeletal muscle protein turnover was re-duced in the PA in nondiabetic obese subjects and that the an-abolic response of mitochondrial muscle proteins was blunted in this group. These results are in accordance with previous data by Luzi et al. (10) showing that the defect in protein metabolism during obesity results in an impairment in insulin to inhibit whole-body proteolysis. Other authors failed to observe any dif-ference in suppression of protein breakdown by insulin between obese and nonobese subjects (9, 11, 12). In those studies,
whole-body protein breakdown was determined during a hyperinsu-linemic, euglycemic clamp. However, to assess the selective ac-tion of insulin on protein metabolism, it is necessary to avoid the decline in plasma AA due to the inhibition of proteolysis by insulin (4). During a hyperinsulinemic, euglycemic, isoamino-acidemic clamp, net leucine balance was much lower in obese women than in lean women as a result of a reduced stimulation of protein synthesis by insulin (13). However, the conditions applied in the protocol design did not really match a physiolog-ical postprandial state when both insulin and AA are elevated in plasma to fully promote protein anabolism. Therefore, in the present work, we aimed to be closer to physiological conditions by performing a hyperinsulinemic, hyperaminoacidemic clamp to simulate as much as possible the fed state. Even with higher plasma insulin concentrations, glucose utilization and proteol-ysis inhibition were lower in obese subjects than in nonobese. Thus, there is a resistance to the action of insulin on glucose and protein metabolism during obesity despite hyperinsulinemia. In addition, we determined specific metabolic changes in skeletal muscle of obese men. A lower muscle mass has been character-ized in obese Zucker rats in association with a significant de-crease in muscle protein synthesis (15). We showed in obese subjects a reduction in basal muscle protein turnover rate to-gether with a lower stimulation of mitochondrial protein syn-thesis by insulin and AA, whereas response of Tot protein to these factors was maintained. It is likely that the lower muscle protein turnover rate is contributing to the decreased whole-body protein synthesis that was also depicted in the present study. With stable isotope methodology, we could measure only muscle protein synthesis, but we can speculate that muscle pro-teolysis was modified as well. Indeed, Patterson et al. (29) ob-served a decreased rate of AA release, which is an index of protein breakdown, from skeletal muscle of obese subjects.
To our knowledge, the present study is the first to have in-vestigated the regulation of muscle protein metabolism by ana-bolic factors in human obesity. In insulin-resistant type 2 diabetic patients, insulin seemed to have lost its specific effect on mito-chondrial protein synthesis (8) and on ATP production (24). Our study, in agreement with these previous studies, shows for the first time that, even before diabetes onset and despite higher insulin concentrations, the effect of insulin on mitochondrial protein synthesis is impaired in obese subjects. In skeletal muscle of obese patients, an altered muscle fiber composition is char-acterized by a reduction in type I fiber content and an increased percentage of type II fibers (17). Type I fibers contain numerous mitochondria because they are predominantly oxidative and are more sensitive to insulin. These features might explain the lower synthesis rate of mitochondria protein in obese subjects and the reduced response of these proteins to the stimulation by insulin and AA. In obesity (18, 19) and type 2 diabetes (20), insulin resistance is associated with decreased muscle oxidative capac-ities resulting in accumulation of fat within the muscle, which may lead in return to the development of insulin resistance (30, 31). These findings raise the possibility of impaired mitochon-drial function and protein synthesis as a factor but also as a consequence of insulin resistance (32). Smaller skeletal muscle mitochondria and reduced activity of respiratory chain was
re-10 20 30 40 50 0.02 0.04 0.06 0.08 0.10 0.12 0.14
Muscle protein fractional synthesis rate (%.h-1)
Fat mass (kg)
FIG. 4. Relationship between fat mass (kilograms) and Tot protein FSR (%䡠 h⫺1)
in PA; r2⫽ 0.42; P ⬍ 0.05. 0.05 0.10 0.15 Non-obese Obese Fractional Synthesis R ate ( % .h -1) * * P<0.05 P<0.05 0.05 0.10 0.15 0.20 Non-obese Obese * * P<0.05 P=NS Fractional Synthesis R ate ( % .h -1)
A
B
FIG. 3. FSR of total (A) and mitochondrial (B) muscle proteins in nonobese and
obese subjects post-absorptive state (white bars) and during a hyperinsulinemic,
euglycemic, hyperaminoacidemic clamp (black bars). *, P⬍ 0.05, obese vs.
nonobese subjects.
ported in type 2 diabetes (33). Moreover, proteome analysis has revealed posttranslational modifications of ATP synthase -sub-unit in type 2 diabetes (34), suggesting an alteration of the reg-ulation of ATP synthesis in these patients. Some proteins in-volved in mitochondria biogenesis and activity could be affected with insulin resistance. For instance, type 2 diabetes was asso-ciated with a reduced expression of nuclear respiratory factor 1-dependent genes encoding key enzymes in mitochondrial func-tion (35). Another parameter to be involved in the obesity-re-lated impairment of mitochondrial content and function is the physical activity level of the subjects. In this study, the two groups of subjects were well-matched for VO2max because
VO2maxwas not different between nonobese and obese subjects,
considering the difference in body composition, notably the amount of free fat mass. This parameter is, however, acknowl-edged as an important mediator of muscle function.
The discrepancy in body composition between the two groups is characterized mainly by a higher amount of fat mass in obese subjects. This feature can have metabolic consequences in obe-sity as reflected here by a negative relationship between fat mass and muscle protein synthesis rate. Excessive visceral adipose tis-sue is associated with increased delivery of FFA leading thus to elevated plasma levels (33). FFAs released from visceral fat have the potential to induce insulin resistance in skeletal muscle (34). The most plausible mechanisms to explain how FFA could con-tribute to muscle insulin resistance are both a substrate compe-tition between glucose and FFA for entry into the glucose-fatty acid cycle leading to muscle fat deposition (35) and a direct in-teraction of fatty acid derivatives with insulin-signaling path-ways (36). This aspect can partly explain the reduction of skeletal muscle and mitochondria protein synthesis in PA in obese sub-jects because insulin signaling for maintaining synthetic machin-ery is less effective. A direct effect of lipids on protein metabolism could also affect the regulation of muscle protein metabolism in obesity. Indeed, the potential effect of FFA on muscle protein synthesis has been recently investigated (37). A short-term ele-vation of plasma FFA is able to impair basal muscle protein synthesis by altering the activation of factors involved in the translational control of protein synthesis. Moreover, when FFA release is controlled, protein catabolism is significantly stimu-lated (38), suggesting an inhibition of proteolysis by FFA. Thus, the increase in fat mass observed in obesity, and mostly the in-crease in FFA concentration, could contribute to muscle protein turnover decline.
In conclusion, the present study has revealed that obesity is associated with disturbances of muscle protein metabolism, no-tably a reduced basal skeletal muscle and mitochondria protein turnover and a limited stimulatory action of insulin upon mito-chondrial protein synthesis. This defect is a fundamental meta-bolic alteration leading to mitochondria dysfunction and thus to the appearance of insulin resistance, both contributing to an impairment in overall muscle function with potential metabolic and contractile consequences in obese people. Thus, lifestyle or drug-mediated improvement in insulin sensitivity in obesity is a major goal not only to restore glucose metabolism but also to preserve muscle metabolic capacity during obesity and type 2 diabetes.
Acknowledgments
Address all correspondence and requests for reprints to: Christelle Guillet, Ph.D., Univ Clermont 1, Unite´ de Formation et de Recherche Me´decine, Unite´ Mixte de Recherche 1019, Laboratoire de Nutrition Humaine, BP 321, 58 rue Montalembert, 63009 Clermont-Ferrand cedex 1, France. E-mail: cguillet@clermont.inra.fr.
Disclosure Summary: The authors have nothing to disclose.
References
1. Kahn BB, Flier JS 2000 Obesity and insulin resistance. J Clin Invest 106:473– 481
2. Biolo G, Wolfe RR 1993 Insulin action on protein metabolism. Baillieres Clin Endocrinol Metab 7:989 –1005
3. Biolo G, Declan Fleming RY, Wolfe RR 1995 Physiologic hyperinsulinemia stimulates protein synthesis and enhances transport of selected amino acids in human skeletal muscle. J Clin Invest 95:811– 819
4. Castellino P, Luzi L, Simonson DC, Haymond M, DeFronzo RA 1987 Effect of insulin and plasma amino acid concentrations on leucine metabolism in man. Role of substrate availability on estimates of whole body protein syn-thesis. J Clin Invest 80:1784 –1793
5. Meek SE, Persson M, Ford GC, Nair KS 1998 Differential regulation of amino acid exchange and protein dynamics across splanchnic and skeletal muscle beds by insulin in healthy human subjects. Diabetes 47:1824 –1835
6. Guillet C, Prod’homme M, Balage M, Gachon P, Giraudet C, Morin L, Grizard
J, Boirie Y 2004 Impaired anabolic response of muscle protein synthesis is
associated with S6K1 dysregulation in elderly humans. FASEB J 18:1586 – 1587
7. Guillet C, Zangarelli A, Gachon P, Morio B, Giraudet C, Rousset P, Boirie Y 2004 Whole body protein breakdown is less inhibited by insulin, but still responsive to amino acid, in nondiabetic elderly subjects. J Clin Endocrinol Metab 89:6017– 6024
8. Halvatsiotis PG, Turk D, Alzaid A, Dinneen S, Rizza RA, Nair KS 2002 Insulin effect on leucine kinetics in type 2 diabetes mellitus. Diabetes Nutr Metab 15:136 –142
9. Jensen MD, Haymond MW 1991 Protein metabolism in obesity: effects of body fat distribution and hyperinsulinemia on leucine turnover. Am J Clin Nutr 53:172–176
10. Luzi L, Castellino P, DeFronzo RA 1996 Insulin and hyperaminoacidemia regulate by a different mechanism leucine turnover and oxidation in obesity. Am J Physiol 270:E273–E281
11. Caballero B, Wurtman RJ 1991 Differential effects of insulin resistance on leucine and glucose kinetics in obesity. Metabolism 40:51–58
12. Welle S, Statt M, Barnard R, Amatruda J 1994 Differential effect of insulin on whole-body proteolysis and glucose metabolism in normal-weight, obese, and reduced-obese women. Metabolism 43:441– 445
13. Chevalier S, Marliss EB, Morais JA, Lamarche M, Gougeon R 2005 Whole-body protein anabolic response is resistant to the action of insulin in obese women. Am J Clin Nutr 82:355–365
14. Pe´rez-Martin A, Raynaud E, Mercier J 2001 Insulin resistance and associated metabolic abnormalities in muscle: effects of exercise. Obes Rev 2:47–59 15. Durschlag RP, Layman DK 1983 Skeletal muscle growth in lean and obese
Zucker rats. Growth 47:282–291
16. Lillioja S, Young AA, Culter CL, Ivy JL, Abbott WG, Zawadzki JK,
Yki-Ja¨rvinen H, Christin L, Secomb TW, Bogardus C 1987 Skeletal muscle
capillary density and fiber type are possible determinants of in vivo insulin resistance in man. J Clin Invest 80:415– 424
17. Tanner CJ, Barakat HA, Dohm GL, Pories WJ, MacDonald KG, Cunningham
PR, Swanson MS, Houmard JA 2002 Muscle fiber type is associated with
obesity and weight loss. Am J Physiol Endocrinol Metab 282:E1191–E1196 18. Simoneau JA, Colberg SR, Thaete FL, Kelley DE 1995 Skeletal muscle glyco-lytic and oxidative enzyme capacities are determinants of insulin sensitivity and muscle composition in obese women. FASEB J 9:273–278
19. He J, Watkins S, Kelley DE 2001 Skeletal muscle lipid content and oxidative enzyme activity in relation to muscle fiber type in type 2 diabetes and obesity. Diabetes 50:817– 823
20. Kelley DE 2002 Skeletal muscle triglycerides: an aspect of regional adiposity and insulin resistance. Ann NY Acad Sci 967:135–145
21. Simoneau JA, Veerkamp JH, Turcotte LP, Kelley DE 1999 Markers of capacity to utilize fatty acids in human skeletal muscle: relation to insulin resistance and obesity and effects of weight loss. FASEB J 13:2051–2060
22. Goodpaster BH, Theriault R, Watkins SC, Kelley DE 2000 Intramuscular lipid content is increased in obesity and decreased by weight loss. Metabolism 49: 467– 472
23. Boirie Y, Short KR, Ahlman B, Charlton M, Nair KS 2001 Tissue-specific regulation of mitochondrial and cytoplasmic protein synthesis rates by insulin. Diabetes 50:2652–2658
24. Stump CS, Short KR, Bigelow ML, Schimke JM, Nair KS 2003 Effect of insulin on human skeletal muscle mitochondrial ATP production, protein synthesis, and mRNA transcripts. Proc Natl Acad Sci USA 100:7996 – 8001 25. Ljungqvist OH, Persson M, Ford GC, Nair KS 1997 Functional heterogeneity
of leucine pools in human skeletal muscle. Am J Physiol 273:E564 –E570 26. Jacquez JA 1992 Theory of production rate calculations in steady and
non-steady states and its application to glucose metabolism. Am J Physiol 262: E779 –E790
27. Schwenk WF, Beaufrere B, Haymond MW 1985 Use of reciprocal pool specific activities to model leucine metabolism in humans. Am J Physiol 249:E646 – E650
28. Katz A, Nambi SS, Mather K, Baron AD, Follmann DA, Sullivan G, Quon MJ 2000 Quantitative insulin sensitivity check index: a simple, accurate method for assessing insulin sensitivity in humans. J Clin Endocrinol Metab 85:2402– 2410
29. Patterson BW, Horowitz JF, Wu G, Watford M, Coppack SW, Klein S 2002 Regional muscle and adipose tissue amino acid metabolism in lean and obese women. Am J Physiol Endocrinol Metab 282:E931–E936
30. Kelley DE, Goodpaster B, Wing RR, Simoneau JA 1999 Skeletal muscle fatty acid metabolism in association with insulin resistance, obesity, and weight loss. Am J Physiol 277:E1130 –E1141
31. Petersen KF, Befroy D, Dufour S, Dziura J, Ariyan C, Rothman DL, DiPietro
L, Cline GW, Shulman GI 2003 Mitochondrial dysfunction in the elderly:
possible role in insulin resistance. Science 300:1140 –1142
32. Holloszy JO 2009 Skeletal muscle “mitochondrial deficiency” does not me-diate insulin resistance. Am J Clin Nutr 89:463S– 466S
33. Jensen MD 2006 Is visceral fat involved in the pathogenesis of the metabolic syndrome? Human model. Obesity (Silver Spring) 14(Suppl 1):20S–24S 34. Boden G, Chen X, Ruiz J, White JV, Rossetti L 1994 Mechanisms of fatty
acid-induced inhibition of glucose uptake. J Clin Invest 93:2438 –2446 35. Kelley DE, Mandarino LJ 2000 Fuel selection in human skeletal muscle in
insulin resistance: a reexamination. Diabetes 49:677– 683
36. Fong Y, Moldawer LL, Marano M, Wei H, Barber A, Manogue K, Tracey KJ,
Kuo G, Fischman DA, Cerami A, Lowry SF 1989 Cachectin/TNF or IL-1␣
induces cachexia with redistribution of body proteins. Am J Physiol 256: R659 –R665
37. Lang CH 2006 Elevated plasma free fatty acids decrease basal protein syn-thesis, but not the anabolic effect of leucine, in skeletal muscle. Am J Physiol Endocrinol Metab 291:E666 –E674
38. Fery F, Plat L, Baleriaux M, Balasse EO 1997 Inhibition of lipolysis stimulates whole body glucose production and disposal in normal postabsorptive sub-jects. J Clin Endocrinol Metab 82:825– 830