HAL Id: hal-02624914
https://hal.inrae.fr/hal-02624914
Submitted on 26 May 2020
HAL is a multi-disciplinary open access
archive for the deposit and dissemination of
sci-entific research documents, whether they are
pub-lished or not. The documents may come from
teaching and research institutions in France or
abroad, or from public or private research centers.
L’archive ouverte pluridisciplinaire HAL, est
destinée au dépôt et à la diffusion de documents
scientifiques de niveau recherche, publiés ou non,
émanant des établissements d’enseignement et de
recherche français ou étrangers, des laboratoires
publics ou privés.
transmission and implications for risk-based surveillance
on the island of Mayotte
Younjung Kim, Laure Dommergues, Ali Ben M’Sa, Philippe Mérot, Eric
Cardinale, John Edmunds, Dirk Pfeiffer, Guillaume Fournié, Raphaëlle Métras
To cite this version:
Younjung Kim, Laure Dommergues, Ali Ben M’Sa, Philippe Mérot, Eric Cardinale, et al.. Livestock
trade network: potential for disease transmission and implications for risk-based surveillance on the
island of Mayotte. Scientific Reports, Nature Publishing Group, 2018, 8,
�10.1038/s41598-018-29999-y�. �hal-02624914�
www.nature.com/scientificreports
Livestock trade network: potential
for disease transmission and
implications for risk-based
surveillance on the island of
Mayotte
Younjung Kim
1,2, Laure Dommergues
3, Ali Ben M’sa
3, Philippe Mérot
4, Eric Cardinale
5,6,
John Edmunds
7, Dirk Pfeiffer
1,2, Guillaume Fournié
1& Raphaëlle Métras
6,7,8The island of Mayotte is a department of France, an outermost region of the European Union located in the Indian Ocean between Madagascar and the coast of Eastern Africa. Due to its close connection to the African mainland and neighbouring islands, the island is under constant threat of introduction of infectious diseases of both human and animal origin. Here, using social network analysis and mathematical modelling, we assessed potential implications of livestock movements between communes in Mayotte for risk-based surveillance. Our analyses showed that communes in the central region of Mayotte acted as a hub in the livestock movement network. The majority of livestock movements occurred between communes in the central region and from communes in the central region to those in the outer region. Also, communes in the central region were more likely to be infected earlier than those in the outer region when the spread of an exotic infectious disease was simulated on the livestock movement network. The findings of this study, therefore, suggest that communes in the central region would play a major role in the spread of infectious diseases via livestock movements, which needs to be considered in the design of risk-based surveillance systems in Mayotte.
The South Western Indian Ocean islands, including the Comoros, La Reunion, Madagascar, Mayotte and Seychelles, are connected to each other and to the African mainland by the movement of people and animals1.
Among these islands, Mayotte, located in the Northern Mozambique Channel, is highly connected to its neigh-bouring territories. In particular, illegal import of livestock from the Comoros is not uncommon2, making the
island vulnerable to the introduction of infectious diseases affecting animals and/or humans. Mayotte has recently suffered from the introductions of Dengue, Chikungunya, and Rift Valley fever (RVF) viruses, the latter proba-bly resulting from the introduction of a lineage from the African continent via illegally imported animals from the Comoros1–3. Moreover, its livestock population is under constant threat from recent outbreaks of Peste des
Petits Ruminants (PPR) in the Comoros and high endemicity of Foot-and-Mouth disease (FMD) and lumpy skin
1Veterinary Epidemiology, Economics and Public Health group, Department of Pathobiology and Population
Sciences, The Royal Veterinary College, Hatfield, UK. 2Centre for Applied One Health Research and Policy Advice,
College of Veterinary Medicine and Life Sciences, City University of Hong Kong, Kowloon, Hong Kong SAR, China.
3GDS Mayotte-Coopérative Agricole des Eleveurs Mahorais, Coconi, Mayotte, France. 4Direction de l’Alimentation,
de l’Agriculture et de la Forêt de Mayotte, Mamoudzou, France. 5Centre de Coopération Internationale en Recherche
agronomique pour le Développement (CIRAD), UMR ASTRE, Cyroi platform, Sainte Clotilde, La Réunion, France.
6Centre de Coopération Internationale en Recherche Agronomique pour le Développement (CIRAD), UMR ASTRE
“Animals, Health, Territories, Risks, and Ecosystems”, Montpellier, France. 7Centre for the Mathematical Modelling of
Infectious Diseases, Department of Infectious Disease Epidemiology, London School of Hygiene & Tropical Medicine, London, UK. 8ASTRE, Université de Montpellier (I-MUSE), CIRAD, Institut National de la Recherche Agronomique,
Montpellier, France. Guillaume Fournié and Raphaëlle Métras jointly supervised this work. Correspondence and requests for materials should be addressed to Y.K. (email: younjung.kim@my.cityu.edu.hk)
Received: 26 March 2018 Accepted: 18 July 2018 Published: xx xx xxxx
disease in Eastern Africa4–6, increasing the potential for Mayotte to serve as an entry point of these diseases into
Europe, as an outermost region of the European Union.
The livestock population in Mayotte was estimated to be approximately 20,000 for cattle and 13,000 for small ruminants7. In addition to the national surveillance programmes for brucellosis and bovine tuberculosis, an
animal disease surveillance system (SESAM, Système d’Epidémiosurveillance Animale à Mayotte) has been in operation in Mayotte since 2009. Although it depends on both active (e.g. RVF serosurveys) and passive (e.g. abortion and mortality reports by farmers) surveillance components, the detection of exotic livestock disease heavily relies on active surveillance since reporting livestock disease by Mayotte farmers may not always be sys-tematic (Dommergues, personal communication). Given this situation, the effective and efficient allocation of limited resources has particular importance since active surveillance requires considerable resources. Risk-based surveillance could achieve this by incorporating prior information about its target population, derived from epi-demiological studies, into the design of traditional surveillance8.
The contact network can be used to infer the underlying transmission network since it influences how dis-ease transmits among the population combined with host infection status9. Among different types of contacts,
livestock movements constitute major routes for the spread of infectious livestock disease10. For example, the
long-range movement of sheep in combination with local transmission resulted in the FMD epidemic in the UK in 200110,11. Livestock movements could, therefore, provide insight into the structure of the underlying
transmis-sion network and thus allow early detection and more effective management of infectious disease12. To do this,
social network analysis and mathematical modelling have been employed widely to describe contact patterns of livestock movements and analyse their potential use for designing disease control strategies12.
This study aimed at identifying the network characteristics of livestock movements in Mayotte and assessing their potential implications for risk-based surveillance. First, these data were presented as a network of admin-istrative communes connected by livestock movements and characterised by social network analysis at both the global and commune levels. Second, we assessed the time from the introduction of an exotic livestock disease into the island to the infection of individual communes by stochastic simulations. Finally, to assess the validity of the inferences from our analyses, we compared RVF IgG seroprevalence between clusters of communes that were classified based on their similarity in the network position (i.e. structural equivalence) over the study years, using longitudinal RVF IgG seroprevalence data2.
Methods
Data.
Data on livestock movements that occurred from 2007–2014 were collected from two sources: the offi-cial farm registry of the Chambre de l’Agriculture, de la Pêche et de l’Aquaculture de Mayotte (CAPAM), and the records of livestock moved by truck by the Coopérative des Eleveurs de Mayotte. While the official farm registry included the date and the farms of origin and destination for each movement of each animal, the truck dataset only contained information about the number of animals moved between communes on a given date. We merged the two datasets into one, which resulted in 3505 livestock movement records between communes (detailed in Supplementary Material A).Network Characteristics.
All livestock movements that occurred in a study year, that is from July to June of the following year, were aggregated to draw seven yearly static networks. Study years were used to capture the rainy season as a whole (November-March) since it was considered to influence livestock movements. The networks were directed and weighted, with the 17 communes as nodes and livestock movements as edges. The number of livestock moved from commune i to commune j was the weight of a directed edge from i to j.First, the large-scale structure of each yearly network was assessed by the density (i.e. the proportion of poten-tial edges present in a network), giant strongly and weakly connected components (GSCC, GWCC), average path length and clustering coefficient13,14. The GSCC and GWCC were to assess the lower and upper limit of the
max-imum epidemic size, respectively14. The average path length and clustering coefficient of the observed networks
were compared to the metrics of random networks to assess whether yearly networks exhibited small-world properties15 (detailed in Supplementary Material B). Between all pairs of yearly networks, the correlation in the
distributions of edges was assessed through a quadratic assignment procedure (QAP)16.
Second, in each yearly network, the similarity in the position of nodes was assessed by exploring their struc-tural equivalence. Euclidean distance was used as a measure of strucstruc-tural equivalence to account for not only the presence of livestock movements but also the number of animals moved between communes17. That is, two
com-munes were considered structurally equivalent if they received and sent the same number of animals from, and to, the same communes, excluding the two communes being compared17. As in other network characteristics,
live-stock movements within communes were not considered when structural equivalence was assessed. To identify clusters of communes with similar livestock movement patterns, communes were then classified into two clusters based on Euclidean distances computed for all pairs of communes. These structurally equivalent clusters were defined using Ward’s criterion18,19 at the point where two clusters resulted in the total minimum within-cluster
variance. The statistical significance of commune partitions into structurally equivalent clusters was explored by comparing the edge density and the number of livestock moved within and between clusters between observed and permuted networks.
Third, communes’ importance was assessed with the following centrality measures: in- and out-strength, betweenness and closeness (detailed in Supplementary Material B). The correlation between those centrality measures was examined by the Kendall rank correlation test.
Finally, the associations between in- and out-strength of a commune and its human and livestock population sizes were assessed by linear regression, accounting for the non-independence of network data by using a permu-tation test20. The association between the number of livestock moved between communes and the shortest road
www.nature.com/scientificreports/
Road distances between communes were calculated using the x-y coordinates of the centre of the largest town in each commune as a geographical reference point24.
Dynamic Epidemic Simulation.
Baseline model. Epidemic spread through livestock movements wassimulated. The spread of a hypothetical exotic infectious disease between the communes of Mayotte through the movements of livestock was assessed by stochastic simulations. At the start of a simulation, all communes were susceptible. The infection was seeded in a randomly selected commune and on a random day of the study period (2007–2014). Daily livestock movements between communes were then replayed as recorded in the dataset until the end of the study period. The infection status of susceptible commune j upon receiving Wi j d, , animals from
commune i on day d was simulated by a Bernoulli trial with Pi j d, , , the probability that commune j became infected,
as the probability of success. Pi j d, , was defined as:
P 1 (1 p ) , if commune i was infected
0 , if commune i was not infected
i j d W , , inf i j d, , = − −
where pinf was the probability that an animal from an infected commune was infectious and transmitted the dis-ease to other animals in the susceptible commune where it was introduced. Infected communes remained infected until the end of a simulation. We generated 20,000 epidemic simulations for each value of pinf: 0.1, 0.5 and 0.9, corresponding to low, medium and high disease transmission scenarios, respectively.
The results of the epidemic simulation were analysed in the following ways. First, we discarded simulations in which less than half of the communes were infected as we only wanted to consider simulations that resulted in large epidemics. Second, to assess the potential of communes to act as sentinels during large epidemics, we computed for each simulation and each commune the time from the day when the infection was seeded to the day when the commune was infected (‘time-to-infection’), except for the commune in which the infection was seeded. For each commune, we then assessed the distribution of time-to-infection values using the median as the measure of central tendency.
Model accounting for potential bias. We assessed the potential bias in the model outcome that could arise from
the data. First, recall bias in the reported movement dates was possible. It could change the temporal sequence of animal movements and, therefore, epidemic patterns. We, therefore, assessed the impact of modifying those reporting dates on the simulated epidemics. We assumed that 10 to 30% of the livestock movements occurred +/− one month around their reported dates. The following steps were repeated for each simulation and reported livestock movement of each dataset. We first simulated whether a livestock movement actually occurred on its reported date through a Bernoulli trial with the parameter being drawn from a Uniform distribution U[0.7, 0.9]. If the trial was successful, the livestock movement occurred on its reported date. If not, the date was simulated by adding to the reported date a rounded random number drawn from a Normal distribution (μ = 0, σ2 = 100)
truncated between −30 and 30. We then merged the two datasets, accounting for possible overlap between them. When there were livestock movements that occurred on the same date between the same communes in both datasets, we randomly selected the number of livestock movements among its possible values. For example, if there were 5 and 3 movements in the official and truck datasets, respectively, one value was randomly selected from integer values between 5 and 8.
Finally, some of the simulations finished before infecting all communes since every simulation ended on the last day of the study period regardless of when the infection was seeded. To assess the extent of bias from this, we considered that the time-to-infection for communes which did not become infected during the course of a given simulation was equal to (1) the [length of the simulation +1 day] or (2) [infinity]. The actual time-to-infection for these communes, therefore, lay between these two bounds.
RVF Seroprevalence and network structure.
To explore the validity of our analyses, we used longitudi-nal RVF IgG seroprevalence data from Mayotte2. We assessed whether the distribution of RVF IgG seroprevalenceacross the island could be associated with the movements of animals by comparing annual RVF IgG seropreva-lence patterns between structurally equivalent clusters, with a particular focus on an RVF epidemic between 2008–20103. More specifically, annual RVF IgG seroprevalence in clusters of communes that were classified based
on communes’ structural equivalence was estimated. The seroprevalence pc y, in a commune cluster c (central or outer) on year y was:
p P N c y i i c i y i i c i y , , , , , = ∑ ∑ ∈ ∈
with Ni y, and Pi y, being the total number of animals and the number of positive animals sampled on commune i
in year y, respectively. The 95% confidence intervals were obtained by accounting for clustering at herd level, using varbin function of the aod package25 in R26. We further explored whether the between-cluster difference
observed in RVF IgG seroprevalence could be explained by vector-related transmission. For this, we used Normalised Difference Vegetation Index (NDVI) as a proxy of mosquito abundance since it reflects the level of vegetation and water presence, i.e. conditions promoting mosquito proliferation27.
Data availability.
The official and truck datasets are available from Supplementary Information S1 and S2, respectively. Commune IDs and their geographic coordinates are available from Supplementary Information S3.Model codes for epidemic simulation are available from Supplementary Information S4 (original model) and S5 (model accounting for potential recall bias) online as R scripts.
Results
Network Characteristics.
During the study period, the number of between-commune livestock move-ments peaked in 2009 (n = 712, 22.3%), whereas it was the lowest in 2014 (n = 350, 11.0%). The density of yearly networks ranged between 0.40 and 0.52, and the total number of livestock movements per year between 350 and 712. The number of livestock moved in (in-strength) and out (out-strength) of a commune ranged from 2 to 142, and from 0 to 155, respectively, and their distributions were right-skewed (Fig. 1). All yearly networks were connected via livestock movements, with the GWCC always including the 17 communes, and the GSCC either 16 or 17 communes. The networks were strongly correlated between all pairs of yearly networks, suggesting that the overall structure of the livestock movement network in Mayotte was stable over the study years; the correla-tion statistic between any two networks was significantly higher than those between the permuted networks (allp-values < 0.001).
All yearly networks showed a high level of clustering, which was significantly higher than in random networks (Supplementary Fig. S1). However, they did not seem to exhibit small-world properties as the average path length was longer than for random networks, in all but one study year (Supplementary Fig. S2).
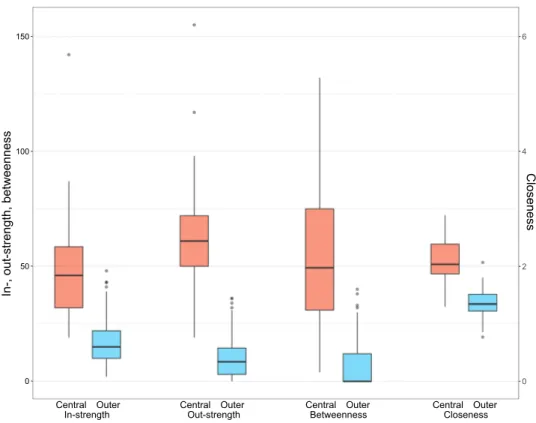
Each yearly network was partitioned into two structurally equivalent clusters, with this partition being corre-lated with the geographical location of the communes (Fig. 2). Communes in the central region of the island of Mayotte tended to be classified as one cluster (red in Fig. 2), and communes in the outer region as another (blue in Fig. 2); communes in the former cluster were referred to as central communes and those in the latter cluster as outer communes. Cluster composition was stable over the study period, with the membership of only 3 com-munes varying over the study period, whereas the other 14 comcom-munes were always either central (n = 3) or outer (n = 11) (Fig. 2); when presenting results from the yearly networks in aggregate, communes were re-classified as central communes if they were classified as central communes in more than half the yearly networks, otherwise as outer communes. Node connectedness greatly varied according to their membership. Nodes’ centrality measures tended to be higher in central than outer communes (Fig. 3). More animals were moved between central than between outer communes, and from central to outer communes than from outer to central communes, except for one study year (Supplementary Fig. S3). In every study year, the number of livestock movements between central communes (or between outer communes) was significantly higher (or lower) in the observed network than in the permuted networks. However, there was no significant difference in the number of livestock movements from central to outer communes (or from outer to central communes) between the observed and permuted networks. Furthermore, in every study year, almost all possible edges were realised between central communes (i.e. den-sity = 1), whereas less than a third between outer communes (Supplementary Fig. S4).
Finally, in each of the study years, out-strength was associated with the size of the livestock population (Supplementary Table S1); on average, communes sent out 1–3 more animals as their livestock population increased by 100 animals. In-strength also showed positive correlations, but there was no statistical significance in all but one study year (July 2011–June 2012). The size of the human population had no significant association
Figure 1. In- and out-strength distributions of the livestock movement network. The in- and out-strength were
aggregated over the study period, and their median values were presented as frequency distributions. The low and high ends of the vertical bars corresponded to the minimum and maximum value, respectively.
www.nature.com/scientificreports/
Figure 2. The livestock movement network in Mayotte from 2007 to 2014. Nodes and edges corresponded to
communes and livestock movements between communes, respectively. The size of the nodes represented the number of livestock in the communes in 2010. The arrow and width of the edges represented the direction and the total number of livestock movements between communes over the study years, respectively. The nodes were expressed as pie charts, showing the proportion of communes’ structurally equivalent cluster over the study years.
Figure 3. In-strength, out-strength, betweenness (left y-axis) and closeness (right y-axis) by structurally
with in- and out-strength in most study years. Finally, QAP regression tests showed that the number of livestock moved between two communes increased as the distance between them decreased (Supplementary Table S2).
Dynamic Epidemic Simulations.
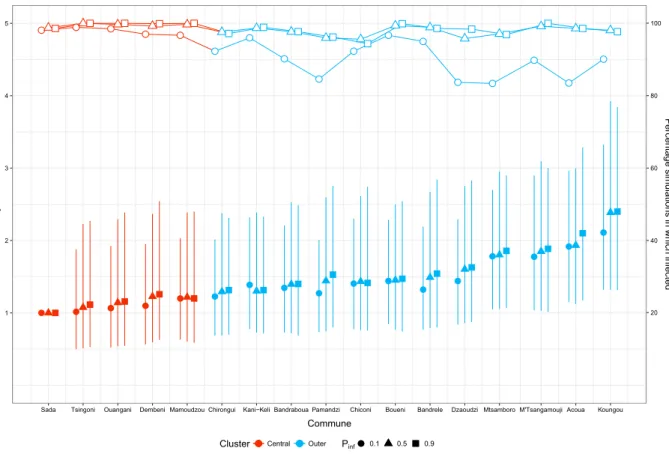
For the three values of pinf tested (0.1, 0.5, 0.9), the median number of days from disease incursion to commune infection was about 1.4 times lower for central than outer communes (Fig. 4). Less than 3 months were needed for diseases with a high transmission potential to reach central com-munes (pinf: 0.9, median: 80 days), whereas it took almost a year for diseases with a low transmission potential (pinf: 0.1, median: 362 days). On average, the commune of Sada was infected the earliest for all values of pinf and therefore was used as a baseline commune when computing the relative time from disease incursion to commune infection. The relative time did not differ much among central communes but was more variable for outer com-munes (Fig. 5). In addition, as pinf decreased, the relative time from disease incursion to commune infection (filled points in Fig. 5) and the likelihood of commune infection during simulations (hollow points in Fig. 5) decreased in most communes, especially in outer communes. For the three values of pinf tested, accounting for potential recall bias in the reported dates and possible overlap between the two datasets resulted in almost the same time-to-infection (Supplementary Figs S5 and S6). Finally, after accounting for communes which were not infected during simulations, the outer communes’ time-to-infection slightly increased for pinf = 0.1, while it remained almost unchanged for central communes (Supplementary Table S3).RVF seroprevalence and network structure.
During the RVF epidemic (2008–2010), RVF IgG sero-prevalence was higher in central than outer communes (Fig. 6). The difference between central and outer com-munes was marked in 2008 when RVF seroprevalence was 5.9 times higher in central than outer comcom-munes. However, it became smaller as RVF seroprevalence in outer communes gradually increased between 2009–2010. A similar pattern was also observed after the epidemic period; in central communes, RVF seroprevalence increased in 2012 with decreases in the following study years. In contrast, in outer communes, RVF seroprev-alence remained low in 2012 and showed a slight increase in 2013. During the epidemic period, there was little difference in NDVI between central and outer communes.Discussion
In the livestock movement network, central communes were closely connected between themselves and to outer communes, whereas outer communes maintained large network distances between themselves or to central communes. These patterns were statistically significantly associated with the number of livestock and the road distance between communes. In the epidemic simulation, central communes tended to be infected earlier than outer communes upon the introduction of exotic livestock disease. Finally, RVF IgG seroprevalence was higher in central than outer communes during the previous epidemic.
Our network analyses showed that central communes acted as a hub in the livestock movement network. Dense connectivity between central communes and from central to outer communes resulted in a higher clus-tering coefficient than random networks. However, outer communes had relatively sparse connectivity between themselves and to central communes, with the shortest path between outer communes being mostly mediated via central communes. This resulted in a longer average path length than random networks, which contrasted with
10 100 1000
Central Outer Central Outer Central Outer
Time−to−inf
ection (in da
ys)
Pinf=0.1 Pinf=0.5 Pinf=0.9
Figure 4. Time from disease incursion to commune infection (in days) aggregated by structurally equivalent
cluster (Baseline model). For the three values of pinf tested (0.1, 0.5, 0.9), the number of days from disease incursion to commune infection was aggregated by structurally equivalent cluster (central and outer communes) and plotted in the log scale (y-axis). Numbers in boxplots corresponded to the median values.
www.nature.com/scientificreports/
small-world properties15. Under this network structure, an epidemic would have a different pattern in the early
stage depending on where a livestock disease is first introduced. If the disease is first introduced into an outer commune, it may be limited within the commune or spread towards central communes rather than the other outer communes. However, once the disease affects central communes, a rapid and widespread epidemic is pos-sible due to dense connectivity between central communes and from central to outer communes. Moreover, the consequence of an epidemic would be more severe when central communes are affected, given a larger livestock population being present in central than outer communes.
Next, the epidemic simulation showed that the difference in the absolute number of days to commune infec-tion decreased sharply as pinf increased. In particular, the difference between central and outer communes also decreased, showing the potential for a rapid and widespread epidemic upon on the introduction of highly trans-missible livestock diseases, such as FMD or PPR. Considering that these diseases are endemic in Eastern Africa, surveillance should be reinforced with particular attention to the movement of animals coming from this area.
The epidemic simulation also showed that central communes tended to be infected earlier than outer com-munes regardless of where the infection was seeded. The difference between central and outer comcom-munes could be larger than observed since the epidemic simulation did not account for within-commune factors; a commune was assumed to be infected at the same level as other infected communes as soon as it received an infected animal. However, communes may have different within-commune infection dynamics. In fact, central communes tended to have not only larger livestock and human populations but also more livestock movements within themselves than outer communes. The prevalence of infection may, therefore, be higher in central than outer communes.
We were able to compare the results of our analysis with RVF seroprevalence data as the data available covered most of the study period. In addition, although RVF is a vector-borne disease primarily transmitted to domestic ruminants via mosquito bites, movements of livestock have been suggested as one of the main factors involved in RVF dynamics2,28. Last and most importantly, an RVF epidemic between 2008–2010 provided a unique
opportu-nity to assess whether Mayotte communes experienced different epidemic patterns depending on their network properties. The observed trend in RVF seroprevalence may suggest that the actual transmission between com-munes was shaped rather by livestock movements, assuming that the climate conditions for vectors and animal exposure to the vectors were similar across the whole island. Our study observed that average NDVI was similar
1 2 3 4 5 20 40 60 80 100
Sada Tsingoni Ouangani Dembeni Mamoudzou Chirongui Kani−Keli Bandraboua Pamandzi Chiconi Boueni Bandrele Dzaoudzi Mtsamboro M'Tsangamouji Acoua Koungou Commune
Da
y rati
o
Percentage simulations in which inf
ecte
d
Cluster Central Outer Pinf 0.1 0.5 0.9
Figure 5. Relative time from disease incursion to infection of individual communes, using the commune of
Sada as baseline (left y-axis), and percentage of simulations in which the commune was infected (right y-axis) (Baseline model). The time from disease incursion to commune infection was compared for each commune using the commune of Sada as a baseline. The median, and 1st and 3rd quartiles of individual communes were
compared with the median of Sada and presented by filled points and vertical lines. For each commune, the percentage of simulations in which the commune was infected was presented by hollow points and horizontal lines. Different point shapes and colours represented different pinf values and structurally equivalent clusters, respectively.
in both central and outer communes during the epidemic. Considering also that ruminant livestock in Mayotte are raised outdoors in herds of small sizes2, their exposure to mosquito bites might have been similar across the
island, and their density might have been too low to have an impact on density-dependent RVF transmission. Under these conditions, the introduction of infected animals might have played a major role in the spread of RVF. The trend of RVF seroprevalence being high in central communes throughout the epidemic period may suggest that these communes acted as a hub for RVF spread via livestock movements. In particular, RVF seroprevalence reached its peak in central communes in the first year of the epidemic, which could be explained by the findings of the network analyses that almost all possible edges were realised between central communes in every study year. That is, RVF might have spread rapidly within central communes at the beginning of the epidemic and then towards outer communes. Data on other diseases, should they become available, could be used to further assess the validity of findings from our analysis.
This study had some limitations. First, our analyses were based on merged data from two sources of livestock movement data collected differently. For the official dataset, livestock movements were recorded when farm-ers reported to CAPAM in pfarm-erson that they had sent out or received livestock. For this reason, some farmfarm-ers reported the movement of an animal when they visited CAPAM long after the actual day of the movement. It was, therefore, possible that some of the recorded movement dates were affected by recall bias. However, its impact on the study results should be considered minimal given that our network analyses were performed on yearly static networks. Also, although the epidemic simulation used daily livestock movements, its outcome would have been influenced mainly by the overall flow of livestock movements between communes rather than their actual movement date, as shown in the model which accounted for possible bias. Second, livestock movements might have been underreported in the official dataset. In particular, livestock movements to/from outer communes might have been underreported more than those to/from central communes due to their more difficult access to CAPAM, located in Ouangani, in the centre of the island. In addition, some livestock movements, especially those of small ruminants, might not have been recorded in the truck dataset being moved by other drivers or farmers themselves. To minimise information bias and improve the representativeness of our analyses, we merged live-stock movements from both datasets assuming that they complement each other.
Our study has significant implications for the design of risk-based surveillance in Mayotte. The main findings suggest that upon the introduction of exotic livestock disease, central communes are more likely to be infected
Figure 6. RVF IgG seroprevalence and normalised difference vegetation index (NDVI) by structurally
equivalent cluster. Solid vertical lines represented the 95% confidence intervals of RVF IgG seroprevalence of each study year, with points representing the means. Dashed lines represented the medians of NDVI at the 16-day interval, with their background colour representing the range of the 1st and 3rd quantiles. NDVI data were
extracted from the Moderate Resolution Imaging Spectroradiometer Terra satellite at 250 m spatial and 16-day temporal resolution29.
www.nature.com/scientificreports/
early than outer communes, and that there is potential for a large epidemic. Considering that the probability of disease occurrence and its consequences are the two main elements in the risk assessment8, our study provides
valuable information for the design of risk-based surveillance. For example, surveillance could adopt risk-based sampling by stratifying central and outer communes into high- and low-risk groups, respectively. Targeted bios-ecurity measures could also be applied on livestock movements between and to central communes to minimise the size of an epidemic.
In conclusion, communes in the central region of Mayotte would play a major role in the spread of livestock diseases. A widespread epidemic is likely due to their high connectivity between themselves and to communes in the outer region. Surveillance efforts, therefore, need to be focused on central communes to achieve the timely detection of disease occurrence and minimise its consequences.
References
1. Tortosa, P. et al. Deciphering arboviral emergence within insular ecosystems. Infect Genet Evol 12, 1333–1339, https://doi. org/10.1016/j.meegid.2012.03.024 (2012).
2. Metras, R. et al. Drivers for Rift Valley fever emergence in Mayotte: A Bayesian modelling approach. PLoS Negl Trop Dis 11, e0005767, https://doi.org/10.1371/journal.pntd.0005767 (2017).
3. Dellagi, K. et al. Serological Evidence of Contrasted Exposure to Arboviral Infections between Islands of the Union of Comoros (Indian Ocean). PLoS Negl Trop Dis 10, e0004840, https://doi.org/10.1371/journal.pntd.0004840 (2016).
4. Namatovu, A. et al. Laboratory capacity for diagnosis of foot-and-mouth disease in Eastern Africa: implications for the progressive control pathway. BMC Vet Res 9, 19, https://doi.org/10.1186/1746-6148-9-19 (2013).
5. Cetre-Sossah, C. et al. Impact and Epidemiological Investigations into the Incursion and Spread of Peste des Petits Ruminants in the Comoros Archipelago: An Increased Threat to Surrounding Islands. Transbound Emerg Dis 63, 452–459, https://doi.org/10.1111/ tbed.12296 (2016).
6. Tuppurainen, E. S. M. et al. Review: Capripoxvirus Diseases: Current Status and Opportunities for Control. Transbound Emerg Dis
64, 729–745, https://doi.org/10.1111/tbed.12444 (2017).
7. Metras, R. et al. The Epidemiology of Rift Valley Fever in Mayotte: Insights and Perspectives from 11 Years of Data. PLoS Negl Trop
Dis 10, e0004783, https://doi.org/10.1371/journal.pntd.0004783 (2016).
8. Stark, K. D. et al. Concepts for risk-based surveillance in the field of veterinary medicine and veterinary public health: review of current approaches. BMC Health Serv Res 6, 20, https://doi.org/10.1186/1472-6963-6-20 (2006).
9. Craft, M. E. Infectious disease transmission and contact networks in wildlife and livestock. Philos Trans R Soc Lond B Biol Sci 370,
https://doi.org/10.1098/rstb.2014.0107 (2015).
10. Gibbens, J. C. et al. Descriptive epidemiology of the 2001 foot-and-mouth disease epidemic in Great Britain: the first five months.
Veterinary Record 149, 729–743, https://doi.org/10.1136/vr.149.24.729 (2001).
11. Mansley, L. M., Dunlop, P. J., Whiteside, S. M. & Smith, R. G. H. Early dissemination of foot-and-mouth disease virus through sheep marketing in February 2001. Veterinary Record 153, 43–50, https://doi.org/10.1136/vr.153.2.43 (2003).
12. Danon, L. et al. Networks and the epidemiology of infectious disease. Interdiscip Perspect Infect Dis 2011, 284909, https://doi. org/10.1155/2011/284909 (2011).
13. Newman, M. E. J. Networks: an introduction. (Oxford University Press, 2010).
14. Kao, R. R., Danon, L., Green, D. M. & Kiss, I. Z. Demographic structure and pathogen dynamics on the network of livestock movements in Great Britain. Proc Biol Sci 273, 1999–2007, https://doi.org/10.1098/rspb.2006.3505 (2006).
15. Watts, D. J. & Strogatz, S. H. Collective dynamics of ‘small-world’ networks. Nature 393, 440–442, https://doi.org/10.1038/30918
(1998).
16. Dekker, D., Krackhardt, D. & Snijders, T. A. In CASOS Working Paper (Carnegie Mellon University, 2003). 17. Wasserman, S. & Faust, K. Social network analysis: methods and applications. (Cambridge University Press, 1994).
18. Ward, J. H. Hierarchical Grouping to Optimize an Objective Function. Journal of the American Statistical Association 58, 236–244,
https://doi.org/10.1080/01621459.1963.10500845 (1963).
19. Manly, B. F. J. Multivariate statistical methods: a primer. 3rd ed. edn, (Chapman & Hall/CRC, 2004).
20. Anderson, M. J. & Legendre, P. An empirical comparison of permutation methods for tests of partial regression coefficients in a linear model. Journal of Statistical Computation and Simulation 62, 271–303, https://doi.org/10.1080/00949659908811936 (1999). 21. Krackardt, D. QAP partialling as a test of spuriousness. Social Networks 9, 171–186, https://doi.org/10.1016/0378-8733(87)90012-8
(1987).
22. Krackhardt, D. Predicting with networks: Nonparametric multiple regression analysis of dyadic data. Social Networks 10, 359–381,
https://doi.org/10.1016/0378-8733(88)90004-4 (1988).
23. Dekker, D., Krackhardt, D. & Snijders, T. A. Sensitivity of MRQAP Tests to Collinearity and Autocorrelation Conditions.
Psychometrika 72, 563–581, https://doi.org/10.1007/s11336-007-9016-1 (2007).
24. Google, M. http://www.google.com/maps (2017).
25. Lesnoff, M. & Lancelot, R. aod: Analysis of Overdispersed Data. R package version 1.3. http://cran.r-project.org/package=aod (2012).
26. R Core Team R: A language and environment for statistical computing. R Foundation for Statistical Computing, Vienna, Austria. URL www.R-project.org/ (2013).
27. Lourenco, P. M. et al. Anopheles atroparvus density modeling using MODIS NDVI in a former malarious area in Portugal. J Vector
Ecol 36, 279-291, doi:10.1111/j.1948-7134.2011.00168.x (2011).
28. Lancelot, R. et al. Drivers of Rift Valley fever epidemics in Madagascar. Proc Natl Acad Sci USA 114, 938-943, https://doi. org/10.1073/pnas.1607948114 (2017).
29. NASA LP DAAC. Vegetation Indices 16-Day L3 Global 250m Version 5. Accessed at https://lpdaac.usgs.gov (2017).
Acknowledgements
The authors thank the Chambre de l’Agriculture, de la Pêche et de l’Aquaculture de Mayotte, Service Animal (CAPAM) who provided the official dataset. R.M. was funded by a Wellcome Trust Sir Henry Wellcome Post-doctoral Fellowship, grant reference 101581. The funders had no role in study design, data collection and analysis, decision to publish, or preparation of the manuscript.
Author Contributions
G.F. and R.M. initiated the study. Y.K., G.F. and R.M. designed the study. Y.K., L.D., A.B.M., G.F. and R.M. conducted the data analysis. Y.K., L.D., A.B.M., P.M., E.C., J.E., D.P., G.F. and R.M. wrote the paper. All authors reviewed the manuscript. G.F. and R.M. share the last authorship.
Additional Information
Supplementary information accompanies this paper at https://doi.org/10.1038/s41598-018-29999-y.
Competing Interests: The authors declare no competing interests.
Publisher's note: Springer Nature remains neutral with regard to jurisdictional claims in published maps and
institutional affiliations.
Open Access This article is licensed under a Creative Commons Attribution 4.0 International
License, which permits use, sharing, adaptation, distribution and reproduction in any medium or format, as long as you give appropriate credit to the original author(s) and the source, provide a link to the Cre-ative Commons license, and indicate if changes were made. The images or other third party material in this article are included in the article’s Creative Commons license, unless indicated otherwise in a credit line to the material. If material is not included in the article’s Creative Commons license and your intended use is not per-mitted by statutory regulation or exceeds the perper-mitted use, you will need to obtain permission directly from the copyright holder. To view a copy of this license, visit http://creativecommons.org/licenses/by/4.0/.