HAL Id: hal-01736187
https://hal.archives-ouvertes.fr/hal-01736187
Submitted on 8 Jun 2018
HAL is a multi-disciplinary open access
archive for the deposit and dissemination of
sci-entific research documents, whether they are
pub-lished or not. The documents may come from
teaching and research institutions in France or
abroad, or from public or private research centers.
L’archive ouverte pluridisciplinaire HAL, est
destinée au dépôt et à la diffusion de documents
scientifiques de niveau recherche, publiés ou non,
émanant des établissements d’enseignement et de
recherche français ou étrangers, des laboratoires
publics ou privés.
A method to determine the pressure and densities of gas
stored in blisters: Application to H and He sequential
ion implantation in silicon
Nabil Daghbouj, Nikolay Cherkashin, Alain Claverie
To cite this version:
Nabil Daghbouj, Nikolay Cherkashin, Alain Claverie. A method to determine the pressure and
den-sities of gas stored in blisters: Application to H and He sequential ion implantation in silicon.
Micro-electronic Engineering, Elsevier, 2018, 190, pp.54-56. �10.1016/j.mee.2018.01.006�. �hal-01736187�
A
method to determine the pressure and densities of gas stored in
blisters:
Application to H and He sequential ion implantation in silicon
N.
Daghbouj, N. Cherkashin, A. Claverie
⁎
CEMES-CNRS and Université de Toulouse, 29 rue J. Marvig, 31055 Toulouse, France
a b s t r a c t
H and He sequential ion implantation of silicon followed by annealing leads to the formation of gas pressurized cavities. When close enough to the surface, they elastically deform this surface and generate blisters. Gaining knowledge of the characteristics and thermal behavior of these blisters is mandatory for the optimization of the Smart Cut™ process. In this paper, we develop the idea and demonstrate that the pressure and the concen-trations of the gases inside a blister can be inferred from its actual dimensions and depth location by using sim-ulations based on Finite Element Method (FEM) modelling. We apply this method to initiate a study on the influence of the respective fluences of H and He ions used in a sequential implantation on blistering efficiency.
Keywords: Ion implantation Defects in silicon Elastic deformation
1. Introduction
Hydrogen and Helium sequential implantation in Si followed by wafer bonding and annealing allows for slicing and the transfer of Si layers from a donor substrate to a host material. The Smart Cut™ tech-nology, based on this principle[1], is used to fabricate Silicon-On-Insulator (SOI) substrates, the starting material of many electronic and photovoltaic modern devices[2,3]. After implantation and during an-nealing, silicon vacancies and hydrogen atoms precipitate in the form of platelets of nanometer dimensions that progressively grow by Ost-wald ripening[4,5]. When their density is large enough, the platelets further evolves during annealing andfinally form highly pressurized micro-cracks[5]. When these micro-cracks are located close enough to the wafer surface, stress relaxation occurs through the formation of blisters elastically deforming the surface[6]. Alternatively, when a stiff-ener is bonded onto the implanted layer, such relaxations cannot occur and the in-plane stress exerted by these micro-cracksfinally leads to the fracture and delamination of the whole layer, the working principle of the Smart Cut™ process. This is why the optimization of the various pa-rameters which define a particular sequential implantation (order, en-ergies,fluences), in order to minimize the total fluence needed to fracture the implanted layer when bonded to a stiffener, is often under-taken by studying the characteristics of the blisters formed at the free surface of this layer.
One important characteristic of these blisters is the concentration and composition of the gas they contain. Indeed, the efficiency of the process is directly linked to the proportion of the implanted dose which is ultimately stored within them. Unfortunately, up to now, a
method to measure these characteristics was lacking. In this paper, we develop the idea that the pressure and the concentrations of the gases inside a blister can be inferred from its actual dimensions and depth at which it is formed with the help of simulations based on Finite Element Method (FEM) modelling. We apply this method to initiate a study and understand the influence of the respective fluences of H and He ions used in a sequential implantation onto the blistering efficiency. 2. Samples
(001) Si wafers covered by a 25 nm-thick thermally grown SiO2
layer (wet oxidation at 800 °C) were sequentially implanted at room temperature with He at 8 keV (Rp from SIMS not shown at about 100 nm below the surface) then with H at 3 keV (Rp from SIMS not shown at about 60 nm below the surface), so that the He ions were im-planted before and deeper than H ions. The Hfluence (ΦΗ) wasfixed at
0.6 × 1016cm−2while the Hefluence (Φ
He) was 0.4 × 10¹⁶, 0.6 × 10¹⁶,
0.9 × 10¹⁶or 1.2 × 1016cm−2, depending on the samples. These samples
were then annealed at 550 °C for 30 min under nitrogen in a conven-tional furnace.
3. Experimental results
Fig. 1shows the images obtained by SEM of the underlying cavities (using back-scattered electrons) on the different samples (left column). On the right, the surface topographies of the same samples observed by AFM are shown. White spots in the AFM images reveal protuberances due to the presence of blisters deforming the surface. The SEM pictures are used to measure the sizes and densities of the cavities while the AFM images are used to measure their heights. The result of the statistical analysis of such SEM images is shown inFig. 2.
⁎ Corresponding author.
These graphs show that when the Hefluence increases by a factor 3, the average diameter of the blisters increases by a factor 2, while their density decreases by a factor of 5. As a result, the surface fraction they occupy stays almost constant at about 60–55%.
Fig. 3shows the result of plotting the height of the blisters (right axis) as a function of their diameter.
This graph shows that there is a direct correlation between the di-ameter of a cavity and the blister height it generated and this, whatever the Hefluence.
Finally, the last missing information i.e., the depth at which these cavities are located was obtained by XTEM (not shown here but same as in Ref[6]). Cavities are located at a depth of 60 nm from the wafer surface.
4. Gas pressure inside a cavity: FEM model
In our model (implemented using Comsol Multiphysics 4.3), a crack is initially described as a cavity of oblate spheroidal shape, as experi-mentally observed[6], characterized by a major and a minor axis, its di-ameter and its thickness, respectively. The crack is embedded within a semi-infinite (001) Si substrate covered by a 25 nm-thick oxide layer and located at 60 nm below the wafer surface (as deduced from SIMS and observed by XTEM). The in-plane stress of the oxide layer is biaxial and compressive and was set at a value of 0.36 GPa as expected for such an oxide[7]. The wafer surface is initially set unstressed in the vertical direction and free to move in every direction. The substrate is rigidly fixed at the bottom of the model structure while the vertical “walls” lim-iting the substrate are only allowed to move vertically. The pressure exerted on the internal surface of a crack of given diameter was adjusted until reproducing through elastic relaxation the actual (measured) height of the blister. Both the volume offered by a blister and its internal pressure can be obtained from this simulation.Fig. 4shows a hybrid plot evidencing the vertical displacement and radial stressfields characteriz-ing a blister after relaxation.
Being able to extract from FEM the gas pressure generating a blister of given height,Fig. 3(left axis) can be replotted to show the univocal relation linking blister diameter and gas pressure inside it.
5. From pressure to concentrations
Given the high pressures deforming the blisters, the ideal gas law cannot be used to deduce the gas concentrations. Instead, we use the ex-perimental data reported in[8,9]. From the results shown in these refer-ences, one can see that hydrogen molecules are more efficient than helium atoms to generate pressure. A given high pressure can be ob-tained either by a minimum molar concentration of hydrogen mole-cules, a maximum concentration of helium atoms or an intermediate concentration of a mixture of both gases.
The total concentration of molecules CHeH2(Pi(di)) = xCHe(Pi(di)) +
(1− x)CH2(Pi(di)) contained within a blister cavity“i” of diameter di
and volume Vican be obtained by combining the data fromFig. 3and
Fig. 1. SEM images of cavities (left column (a–d)) and AFM images of blisters (e, h) observed on the different samples. TheΦΗε/ΦΗratio equals to: (a, e), 0.67; (b, f), 1;
(c, g), 1.5 and (d, h), 2. The zero value of height contrast in the AFM images was assigned to the lowest (thus darkest) areas in the AFM images.
Fig. 2. (a), Average diameter (solid black circles) and density (square blue solid) of the blisters; (b), surface fraction they occupy, as a function of the Hefluence. (For interpretation of the references to colour in thisfigure legend, the reader is referred to the web version of this article.)
Fig. 3. Right axis, height of a blister as a function of its diameter. Left axis, after transformation using FEM, gas pressure inside that blister as a function of its diameter. (compilation of all Hefluences).
those found in[8,9], provided the respective molar fractions x and (1− x) of the two gases are known.
The areal density of molecules, i.e. the number of molecules contained within the blisters and found within a surface area S, is given by
ρHeH2¼ ∑iCHeH2ðPið Þdi ÞVi=S;
withρHeH2= xρHe+ (1− x)ρH2.
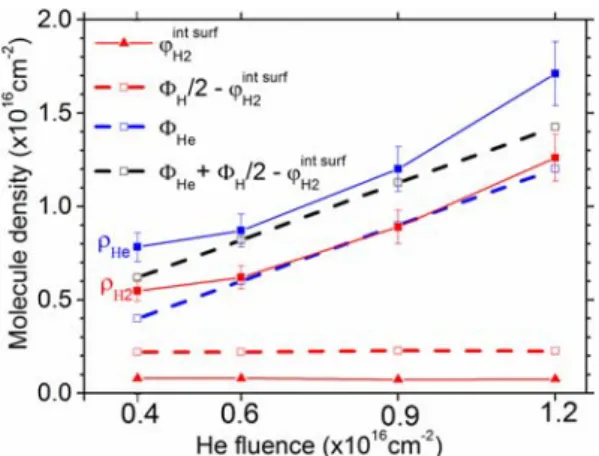
We have plotted inFig. 5using blue or red solid squares respectively, the areal density of molecules that would be needed to generate the ob-served blisters using exclusively He or H2molecules, and this for the
dif-ferent Hefluences studied in this work. It follows that the density needed for any mixture of both gases to generate the same blisters would lie between these two extreme bounds.
We now focus on the amount of implanted gases which could con-tribute to the pressurization of the blisters. Resulting from the debonding of two successive planes, cavities and blisters offer large in-ternal (001) surfaces hosting large concentrations of dangling bonds which hydrogen atoms passivate. The density of dangling bonds pro-vided by these (001) planes equalsγ = 4/aSi2where aSiis the lattice
pa-rameter of silicon. Each dangling bond is passivated by one hydrogen atom. Thus, the total number of H2molecules used to passivate the
internal surfaces of the blisters found within the area S is given by ϕint:surf H2 ¼ ∑i γSi 2S≅∑i πd2 i a2 SiS : The values ofϕH2
int. surfare also plotted inFig. 5(red solid triangles).
Thus, only some part of the implanted Hfluence (ΦΗ/2− ϕH2
int. surf)
is left available to eventually pressurize the blisters (red dashed line) while the whole Hefluence is available (blue dashed line).
From this graph, it is obvious that the blisters we have observed in this study cannot be pressurized by one type of gas only. None of the red and blue dashed lines stays between the two red and blue plain lines. Moreover, the molecule density of H2being small, this
demon-strates that blisters are necessaryfilled by a gas mixture in which He plays a major role.
Alternatively, if we plot the total molecular density of H and He available to pressurize the blistersΦHe+ΦΗ/2− ϕH2
int. surf
(in black dashed line), we note that this line stays within the boundariesfixed by the two blue and red plain lines. In other words, the incorporation of all the implanted H and He ions within blisters would perfectly ex-plain our observations. Moreover, thefine examination of the “distance” between the black dashed line (total availablefluence) and the red plain line demonstrates that more than 95% of the gases initially available must be stored in the blisters.
From this observation, the relative concentrations of the gasesfilling the blisters can be found and are obviously very close to the relative fluences used in the experiments.
6. Conclusions
Cavities and blisters are formed after sequential H and He implanta-tion. In this paper, we have shown how to extract the gas pressure contained within a blister of given dimensions from the FEM simula-tions of the elastic relaxation of silicon when exposed to the vertical stress exerted by a pressurized cavity. We show that the height of a blis-ter developing from a cavity located at a given depth only depends on its diameter. Calculating the molecule densities that would be required to fill the blisters we have observed, we demonstrate that they are neces-sarily pressurized with a mixture of both gases and that almost all the implantedfluences end up within the blisters, at least for the experi-mental conditions studied in this work. Finally, increasing the He fluence with respect to that of H mainly results in an increase of the di-ameters and of the heights of the blisters and thus of the volume they offer.
References
[1]M. Bruel, Mater. Res. Innov. 3 (1999) 9.
[2]S. Pillai, K.R. Catchpole, T. Trupke, M.A. Green, J. Appl. Phys. 101 (9) (2007), 093105. [3]O. Moutanabbir, U. Gösele, Heterogeneous integration of compound semiconductors, in: D.R. Clarke, M. Rühle, F. Zok (Eds.),Annual Review of Materials Research, vol. 40, 2010, pp. 469–500.
[4]J. Grisolia, G. Ben Assayag, A. Claverie, B. Aspar, C. Lagahe, L. Laanab, Appl. Phys. Lett. 76 (7) (2000) 852.
[5] S. Personnic, K.K. Bourdelle, F. Letertre, A. Tauzin, N. Cherkashin, A. Claverie, R. Fortunier, H. Klocker, J. Appl. Phys. 103 (2008), 023508.
[6] N. Cherkashin, N. Dagbouj, F.X. Darras, M. Fnaiech, A. Claverie, J. Appl. Phys. 118 (2015), 245301.
[7]E. Kobeda, E.A. Irene, J. Vac. Sci. Technol. B 6 (1988) 574. [8]M. Lallemand, D. Vidal, J. of Chem. Phys. 66 (1977) 4776.
[9]H. Shimizu, E.M. Brody, H.K. Mao, P.M. Bell, Phys. Rev. Lett. 47 (1981) 128. Fig. 4. Typical shape and radial stressfields characterizing a blister in equilibrium with its
internal pressure. The vertical dimension was enlarged by a factor of 5 for a better visualization. Unit is Pa.
Fig. 5. Blue and red solid squares correspond to the upper and lower limits of molecule density of a mixture consisting of He and H2molecules and needed to pressurize the
observed blisters. The red solid triangles show the density of H2molecules needed to
passivate the internal surfaces of the blisters. Open symbols show the helium (in blue), the H2(in red) and the total (in black) densities available from the implantedfluences
for pressurizing blisters. (For interpretation of the references to colour in thisfigure legend, the reader is referred to the web version of this article.)