HAL Id: hal-03256441
https://hal.archives-ouvertes.fr/hal-03256441
Submitted on 10 Jun 2021
HAL is a multi-disciplinary open access
archive for the deposit and dissemination of
sci-entific research documents, whether they are
pub-lished or not. The documents may come from
teaching and research institutions in France or
abroad, or from public or private research centers.
L’archive ouverte pluridisciplinaire HAL, est
destinée au dépôt et à la diffusion de documents
scientifiques de niveau recherche, publiés ou non,
émanant des établissements d’enseignement et de
recherche français ou étrangers, des laboratoires
publics ou privés.
Distributed under a Creative Commons Attribution - NonCommercial| 4.0 International
Clumped Isotope Thermometer Using Carbonate
Standards
Stefano M. Bernasconi, Mathieu Daëron, Kristin D. Bergmann, Magali
Bonifacie, Anna Nele Meckler, Hagit P. Affek, Noah T. Anderson, David
Bajnai, Eugeni S. Barkan, Emily J. Beverly, et al.
To cite this version:
Stefano M. Bernasconi, Mathieu Daëron, Kristin D. Bergmann, Magali Bonifacie, Anna Nele Meckler,
et al.. InterCarb: A Community Effort to Improve Interlaboratory Standardization of the Carbonate
Clumped Isotope Thermometer Using Carbonate Standards. Geochemistry, Geophysics, Geosystems,
AGU and the Geochemical Society, 2021, 22 (5), �10.1029/2020GC009588�. �hal-03256441�
Abstract
Increased use and improved methodology of carbonate clumped isotope thermometry has greatly enhanced our ability to interrogate a suite of Earth-system processes. However, interlaboratory discrepancies in quantifying carbonate clumped isotope (Δ47) measurements persist, and their specificsources remain unclear. To address interlaboratory differences, we first provide consensus values from the clumped isotope community for four carbonate standards relative to heated and equilibrated gases with 1,819 individual analyses from 10 laboratories. Then we analyzed the four carbonate standards along with three additional standards, spanning a broad range of δ47 and Δ
47 values, for a total of 5,329 analyses
on 25 individual mass spectrometers from 22 different laboratories. Treating three of the materials as known standards and the other four as unknowns, we find that the use of carbonate reference materials
© 2021. The Authors.
This is an open access article under the terms of the Creative Commons Attribution-NonCommercial License, which permits use, distribution and reproduction in any medium, provided the original work is properly cited and is not used for commercial purposes.
Clumped Isotope Thermometer Using Carbonate
Standards
S. M. Bernasconi1 , M. Daëron2 , K. D. Bergmann3 , M. Bonifacie4 ,
A. N. Meckler5 , H. P. Affek6 , N. Anderson3 , D. Bajnai7 , E. Barkan6, E. Beverly8,9 , D. Blamart2, L. Burgener10 , D. Calmels4,11, C. Chaduteau4, M. Clog12 ,
B. Davidheiser-Kroll13, A. Davies14,21, F. Dux15,34, J. Eiler16, B. Elliott17, A. C. Fetrow13 , J. Fiebig7, S. Goldberg3 , M. Hermoso4,18 , K. W. Huntington19 , E. Hyland10 , M. Ingalls16,20 , M. Jaggi1, C. M. John21 , A. B. Jost3 , S. Katz9, J. Kelson9, T. Kluge21,22, I. J. Kocken23 , A. Laskar24 , T. J. Leutert5,25 , D. Liang24, J. Lucarelli17 ,
T. J. Mackey3,26 , X. Mangenot4,16, N. Meinicke5 , S. E. Modestou5 , I. A. Müller23 , S. Murray27, A. Neary9, N. Packard9, B. H. Passey9, E. Pelletier9, S. Petersen9 , A. Piasecki5,28, A. Schauer19, K. E. Snell13 , P. K. Swart29 , A. Tripati17 , D. Upadhyay17, T. Vennemann30 , I. Winkelstern9,31 , D. Yarian9, N. Yoshida32,33 , N. Zhang32 , and M. Ziegler23
1Geological Institute, ETH Zürich, Zürich, Switzerland, 2Laboratoire des Sciences du Climat et de l’Environnement,
LSCE/IPSL, CEA-CNRS-UVSQ, Université Paris-Saclay, Gif-sur-Yvette, France, 3Department of Earth, Atmospheric
and Planetary Sciences, Massachusetts Institute of Technology, Cambridge, MA, USA, 4Université de Paris, Institut
de Physique du Globe de Paris, CNRS, Paris, France, 5Bjerknes Centre for Climate Research and Department of
Earth Science, University of Bergen, Bergen, Norway, 6Institute of Earth Sciences, Hebrew University of Jerusalem,
Jerusalem, Israel, 7Institute of Geosciences, Goethe University Frankfurt, Frankfurt am Main, Germany, 8Now at
Department of Earth and Atmospheric Sciences, University of Houston, Houston, TX, USA, 9Department of Earth
and Environmental Sciences, University of Michigan, Ann Arbor, MI, USA, 10Department of Marine, Earth and
Atmospheric Sciences, North Carolina State University, Raleigh, NC, USA, 11Now at Geosciences Paris Sud (GEOPS),
Université Paris-Saclay, CNRS, Orsay, France, 12Scottish Universities Environmental Research Centre (SUERC),
Scotland, UK, 13University of Colorado Boulder, Boulder, CO, USA, 14Now at Stockholm University, Stockholm,
Sweden, 15Now at School of Earth and Life Sciences, University of Wollongong, Wollongong, Australia, 16Geological
and Planetary Sciences, California Institute of Technology, Pasadena, CA, USA, 17Department of Earth, Planetary, and
Space Sciences, University of California Los Angeles, Los Angeles, CA, USA, 18Univ. Littoral Côte d’Opale, Univ. Lille,
CNRS, Laboratoire d’Océanologie et de Géosciences (UMR 8187 LOG), Wimereux, France, 19University of Washington,
Seattle, WA, USA, 20Now at Department of Geosciences, The Pennsylvania State University, University Park, PA, USA, 21Imperial College, London, UK, 22Now at Karlsruher Institut für Technologie KIT, Karlsruhe, Germany, 23Department
of Earth Sciences, University of Utrecht, Utrecht, The Netherlands, 24Institute of Earth Sciences, Academia Sinica,
Taipei, Taiwan, 25Now at Max Planck Institute for Chemistry, Mainz, Germany, 26Now at Department of Earth and
Planetary Sciences, University of New Mexico, Albuquerque, NM, USA, 27Macquarie University, Sydney, Australia, 28Now at Department of Earth Sciences, Dartmouth College, Hanover, NH, USA, 29Department of Marine Geosciences,
Rostiel School of Marine and Atmospheric Sciences, University of Miami, Miami, FL, USA, 30Institute of Earth
Surface Dynamics, University of Lausanne, Lausanne, Switzerland, 31Now at Geology Department, Grand Valley State
University, Allendale, MI, USA, 32Earth-Life Science Institute, Tokyo Institute of Technology, Tokyo, Japan, 33National
Institute of Information and Communications Technology, Tokyo, Japan, 34School of Geography, University of
Melbourne, Melbourne, Australia Key Points:
• The exclusive use of carbonate reference materials is a robust method for the standardization of clumped isotope measurements • Measurements using different acid
temperatures, designs of preparation lines, and mass spectrometers are statistically indistinguishable • We propose new consensus
values for a set of seven carbonate reference materials and updated guidelines to report clumped isotope measurements
Supporting Information: Supporting Information may be found in the online version of this article. Correspondence to:
S. M. Bernasconi and M. Daëron,
stefano.bernasconi@erdw.ethz.ch;
daeron@lsce.ipsl.fr Citation:
Bernasconi, S. M., Daëron, M., Bergmann, K. D., Bonifacie, M., Meckler, A. N., Affek, H. P., et al. (2021). InterCarb: A community effort to improve interlaboratory standardization of the carbonate clumped isotope thermometer using carbonate standards.
Geochemistry, Geophysics, Geosystems, 22, e2020GC009588. https://doi. org/10.1029/2020GC009588
Special Section:
Clumped Isotope Geo-chemistry: From Theory to Applications
This article is a companion to Daëron (2021), https://doi.org/10.1029/ 2020GC009592.
1. Introduction
Carbonate clumped isotope (Δ47) thermometry is the most developed branch of the rapidly evolving field
of clumped isotope geochemistry. Given the broad range of applications in Earth Sciences (e.g., Affek & Eiler, 2006; Dale et al., 2014; Eagle et al., 2010; Ferry et al., 2011; Ghosh, Adkins, et al., 2006; Ghosh, Gar-zione, & Eiler, 2006; Grauel et al., 2013; Guo & Eiler, 2007; Huntington et al., 2011; Mangenot et al., 2018; Passey & Henkes, 2012; Veillard et al., 2019) and the improvement of analytical methods including auto-mation (Adlan et al., 2020; Bernasconi et al., 2018, 2013; Defliese & Lohmann, 2015; Dennis et al., 2011; Fiebig et al., 2019; Ghosh, Adkins, et al., 2006; He et al., 2012; Hu et al., 2014; Huntington et al., 2009; Meckler et al., 2014; Müller, Fernandez, et al., 2017; Passey et al., 2010; Petersen et al., 2016, 2019; Schmid & Bernasconi, 2010), the last 5–10 years have seen an increasing number of laboratories implementing this technique. The great potential of this thermometer can only be fully exploited if precision and accuracy are sufficient to resolve differences of a few degrees in formation temperatures. In addition, widely available ref-erence materials that match the sample matrices are necessary so that data can be robustly compared across laboratories (Meier-Augenstein & Schimmelmann, 2019). Currently the situation in the field of carbonate clumped isotope geochemistry is far from satisfactory. Published values for the ETH reference materials, the only carbonates that have been recently measured in many different laboratories worldwide, differ by up to 0.053‰ (see Bernasconi et al., 2018; Thaler et al., 2020 for recent comparisons). For paleoclimate applica-tions, however, a repeatability across laboratories of 0.01‰ or better is a necessary goal for meaningful data comparison. This clearly calls for better standardization procedures to improve laboratory comparability. The data normalization scheme currently used in clumped isotope geochemistry of carbonates in many laboratories is based on the comparison of the composition of the CO2 liberated from carbonates by reaction
with phosphoric acid with that of a set of CO2 gases with different bulk and clumped isotope compositions
(Dennis et al., 2011). These gases are prepared either by heating CO2 at 1000 °C (heated gases; HG) or by
CO2 equilibration with water at low temperatures (equilibrated gases at e.g., 25 °C, 50 °C; EG). By
compar-ing the measured compositions with the theoretical predictions of the equilibrium thermodynamic abun-dance of multiply substituted isotopologues in heated and equilibrated gases (Wang et al., 2004; and updates in Petersen et al., 2019), the measurements are standardized to the scale that was named the “absolute reference frame” (ARF) by Dennis et al. (2011). In more recent publications, the ARF is often referred to as the “Carbon Dioxide Equilibration Scale” (CDES), a terminology introduced by Passey and Henkes (2012). This approach was designed to allow different laboratories to link their measurements to an internation-ally recognized scale firmly anchored to theory using relatively easy and established laboratory protocols to produce CO2 standard gases of known isotopic composition. Early comparisons of Δ47 CDES values for
carbonates analyzed in different laboratories and corrected with HG/EG normalization were promising (Dennis et al., 2011). While Bonifacie et al. (2017) reported similar Δ47 CDES values for nine dolomite samples
covering a range of almost 0.4‰ measured both at Caltech and IPGP laboratories with HG/EG normali-zation, Spooner et al. (2016) found that carbonate standardization improved agreement between data they obtained on samples analyzed both at Caltech and WHOI laboratories, compared to when they were using HG/EG normalization. Such recurrent cases of poor interlaboratory reproducibility (see also Bernasconi et al., 2018; Thaler et al., 2020) suggest that there are still unexplained differences in the results among laboratories (see Petersen et al., 2019 for a recent review).
Apart from preservation problems, two known issues still limiting the reliability of this method to yield accurate temperature reconstructions are: (1) the lack of internationally recognized carbonate reference materials for a precise interlaboratory calibration, and (2) that published Δ47-temperature calibrations
pro-duced in different laboratories have differed in both temperature dependence (slope) and absolute value is a robust method for standardization that yields interlaboratory discrepancies entirely consistent with intralaboratory analytical uncertainties. Carbonate reference materials, along with measurement and data processing practices described herein, provide the carbonate clumped isotope community with a robust approach to achieve interlaboratory agreement as we continue to use and improve this powerful geochemical tool. We propose that carbonate clumped isotope data normalized to the carbonate reference materials described in this publication should be reported as Δ47 (I-CDES) values for Intercarb-Carbon
Dioxide Equilibrium Scale.
Received 11 DEC 2020 Accepted 19 MAR 2021 Author Contributions: Conceptualization: S. M. Bernasconi, M. Daëron, K. D. Bergmann, M. Bonifacie, A. N. Meckler
Data curation: M. Daëron
Formal analysis: S. M. Bernasconi, M.
Daëron, K. D. Bergmann, M. Bonifacie, A. N. Meckler
Investigation: S. M. Bernasconi,
M. Daëron, K. D. Bergmann, M. Bonifacie, A. N. Meckler, H. P. Affek, N. Anderson, D. Bajnai, E. Barkan, E. Beverly, D. Blamart, L. Burgener, D. Calmels, C. Chaduteau, M. Clog, B. Davidheiser-Kroll, A. Davies, F. Dux, J. Eiler, B. Elliott, A. C. Fetrow, J. Fiebig, S. Goldberg, M. Hermoso, K. W. Huntington, E. Hyland, M. Ingalls, M. Jaggi, C. M. John, A. B. Jost, S. Katz, J. Kelson, T. Kluge, I. J. Kocken, A. Laskar, T. J. Leutert, D. Liang, J. Lucarelli, T. J. Mackey, X. Mangenot, N. Meinicke, S. E. Modestou, I. A. Müller, S. Murray, A. Neary, N. Packard, B. H. Passey, E. Pelletier, S. Petersen, S. Petersen, A. Piasecki, A. Schauer, K. E. Snell, P. K. Swart, A. Tripati, D. Upadhyay, T. Vennemann, I. Winkelstern, D. Yarian, N. Yoshida
Methodology: S. M. Bernasconi, M.
Daëron, K. D. Bergmann, M. Bonifacie, A. N. Meckler
Software: M. Daëron Writing – original draft: S. M.
Bernasconi, M. Daëron, K. D. Bergmann, M. Bonifacie, A. N. Meckler
Writing – review & editing: S.
M. Bernasconi, M. Daëron, K. D. Bergmann, M. Bonifacie, A. N. Meckler, H. P. Affek, N. Anderson, D. Bajnai, E. Barkan, E. Beverly, D. Blamart, L. Burgener, D. Calmels, C. Chaduteau, M. Clog, B. Davidheiser-Kroll, A. Davies, F. Dux, J. Eiler, B. Elliott, A. C. Fetrow, J. Fiebig, S. Goldberg, M. Hermoso, K. W. Huntington, E. Hyland, M. Ingalls, M. Jaggi, C. M. John, A. B. Jost, S. Katz, J. Kelson, T. Kluge, I. J. Kocken, A. Laskar, T. J. Leutert, D. Liang, J. Lucarelli, T. J. Mackey, X. Mangenot, N. Meinicke, S. E. Modestou, I. A. Müller, S. Murray, A. Neary, N. Packard, B. H. Passey, E. Pelletier, S. Petersen, S. Petersen, A. Piasecki, A. Schauer, K. E. Snell, P. K. Swart, A. Tripati, D. Upadhyay, T. Vennemann, I. Winkelstern, D. Yarian, N. Yoshida
(intercept). Possible reasons for the differences in slopes and intercepts of the Δ47 temperature dependence
have been widely discussed in the literature (e.g., Bonifacie et al., 2017; Daëron et al., 2016; Fernandez et al., 2017; Katz et al., 2017; Kelson et al., 2017; Kluge et al., 2015; Petersen et al., 2019; Schauer et al., 2016). Discrepancies have been attributed to analytical artifacts such as CO2-acid re-equilibration at different acid
digestion temperatures (see Swart et al., 2019; Wacker et al., 2013, for a recent discussion) and to slight pressure imbalances between sample and reference gas (Fiebig et al., 2016). Other factors proposed to in-fluence the calculated slopes of the calibrations are the limitations of the data sets used in the individual studies, in particular in terms of the number of samples and replicates and of the temperature range cov-ered by the available samples (Bonifacie et al., 2017; Fernandez et al., 2017). However, the discrepancies in the intercepts of the calibrations, for example, between Kelson et al. (2017) and Peral et al. (2018), and a generally poor laboratory comparability remain problems that could be mitigated by using a more robust standardization method.
Petersen et al. (2019), in a recent effort to resolve differences in calibrations, compiled raw data of a num-ber of published temperature calibrations and recalculated them all in a consistent way using the revised IUPAC correction parameters to correct for the 17O abundance (Daëron et al., 2016; Schauer et al., 2016).
The goal was to test whether data processing differences and/or the use of consistent but incorrect 17
O-cor-rection parameters in the calculations were the root causes of inconsistencies. The result of this study was that differences among calibrations were reduced but not eliminated by the recalculation, implying that other factors must be responsible for the remaining discrepancies. These differences have pushed many laboratories to use laboratory-specific calibrations performed with the same analytical approach, as they at least partially take into consideration possible procedural differences (Petersen et al., 2019). However, if a laboratory changes analytical procedures or has not generated a robust in-house calibration, this approach is problematic. Achieving an interlaboratory reproducibility at the level of accuracy necessary for meaning-ful interpretations of the observed variations is a requirement for Δ47 thermometry to reach its potential as
a mature analytical method with broad acceptance and quantitative usefulness.
While the definition of the CDES was a major milestone (Dennis et al., 2011), a known problem with this approach is that while the CO2 standard gases equilibrated at known temperature (HG or EG) can be
confi-dently used for correction of mass spectrometric fractionations/nonlinearities and for effects of the purifi-cation procedures, they cannot account for the effects of the phosphoric acid reaction on the composition of the produced CO2. Among the factors responsible for discrepant calibrations and laboratory comparability,
two important ones cannot be tested with a gas-based standardization: (1) the absolute value and tempera-ture dependence of the phosphoric acid fractionation factor (see Petersen et al., 2019 for a recent compila-tion) and (2) possible CO2 equilibration effects during acid digestion of the sample. Swart et al. (2019)
pre-sented evidence that equilibration of CO2 with water or hot metal surfaces during phosphoric acid reaction
and transfer of the CO2 to the mass spectrometer could be a factor leading to the alteration of the apparent
temperature dependence of clumped isotopes in carbonates and on the absolute value of calculated Δ47. As
many laboratories use custom built extraction lines with different designs and volumes of tubing and of acid vessels, these factors are impossible to precisely quantify for each laboratory and may further contribute to interlaboratory discrepancies.
We propose that these issues can be circumvented if carbonates, which undergo the same acid digestion as the samples, are used for normalization instead of or in addition to gases, consistent with the principle of identical treatment of sample and standards (Carter & Fry, 2013; Werner & Brand, 2001). In addition, nor-malizing results to accepted carbonate reference material values, as is commonly done with conventional carbon and oxygen isotope analysis in carbonates, removes the requirement to precisely quantify acid frac-tionation factors at different temperatures (Bernasconi et al., 2018).
A carbonate standardization approach was introduced by Schmid and Bernasconi (2010) and improved by Meckler et al. (2014), with the following benefits: (1) the use of carbonates can more easily be fully auto-mated, eliminating time-consuming and possibly error-prone manual preparation of CO2 standard gases
(equilibrated at known temperature) by individual users on separate extraction lines; (2) in some automat-ed systems designautomat-ed for the measurement of small carbonate samples (e.g., the Kiel Device), the heatautomat-ed and equilibrated gases had to be measured through a different capillary than the gases produced by acid digestion of carbonates with potential biases that would go unrecognized; and (3) in these same systems
the equilibrated and heated gases are measured at constant ion beam intensity in bellow mode, whereas the samples are measured with decreasing ion beams in microvolume mode. These features argue in favor of carbonate standardization a priori, but it remains critical to assess a posteriori whether the results of this approach are as robust and accurate as expected and whether they significantly improve the interlaboratory reproducibility of Δ47 measurements. Discussions at the Sixth International Clumped Isotope Workshop
in Paris in 2017 led to the present interlaboratory comparison exercise (InterCarb) to evaluate the benefits and drawbacks of a carbonate-based standardization approach as an alternative to the use of gas standards. The primary goal of this study was to test whether the exclusive use of carbonate reference materials as a substitute for heated and equilibrated gases can minimize interlaboratory discrepancies and provide an al-ternative to the measurement of heated and equilibrated gases for the entire community. This is particularly important because of the increasing number of laboratories using commercial small-sample automated de-vices which cannot easily be standardized using the HG-EG approach. The InterCarb exercise also provides an opportunity to define the best community-derived consensus Δ47 values for the ETH standards of
Meck-ler et al. (2014). Although these standards are already used in many laboratories, their current nominal Δ47 values are based on measurements from the ETH laboratory only. The InterCarb exercise can similarly
establish community accepted values for other common carbonate reference materials, some of which have been in use for several years, in order to provide the community with a self-consistent set of carbonate ref-erence materials with a broad range of bulk and clumped isotope compositions.
1.1. Nomenclature and Data Processing
Clumped isotope compositions are reported as an excess abundance of the CO2 isotopologue of cardinal
mass 47 (dominantly the isotopologues 13C18O16O) compared to a stochastic distribution according to the
formula:
47 47*
47
Δ R /R 1
where R47 is the ratio of the abundances of the set of minor isotopologues with mass 47 (mostly 13C18O16O
and trace amounts of 12C17O18O and 13C17O
2) divided by the abundance of the most abundant isotopologue
with mass 44 (12C16O
2). The stochastic ratio R47* is calculated using the measured abundance of 13C and 18O
and measured or calculated abundance of 17O in the sample (Affek & Eiler, 2006). According to the IUPAC guidelines the formula does not include the factor 1,000 (Coplen, 2011; though Δ47 is commonly reported
in units of per mil, which implies multiplication by a factor of 1,000). Also, we omit here the classically included terms involving R45* and R46*, which are assumed to be zero by definition when computing δ13C
and δ18O, and in practice never exceed ±0.00002‰ in our calculations (Daëron et al., 2016). The measured
abundance of isotopologues with m/z 47 in the sample with respect to the working gas (WG) in the mass spectrometer is reported in the traditional delta notation as:
47 47 47 WG
δ R /R 1
The δ47 scale is a measure of the difference between the sample of interest and the WG of the specific
in-strument, therefore, it cannot be compared across laboratories. The same notation is used for masses 45, 46, 48, and 49.
The CO2 gas-based standardization scheme for clumped isotope thermometry in carbonates relies on a set
of CO2 standard gases with different bulk compositions (δ13C and δ18O, leading to different δ47), preferably
chosen by the user to encompass the δ47 values of unknown samples that have been (1) heated at 1000 °C to
reach a near-stochastic distribution of all isotopologues, or (2) equilibrated with water at low temperature to reach equilibrium enrichments in the mass-47 isotopologues (Dennis et al., 2011). The heated gases, having a near-stochastic distribution of the heavy isotopes among all isotopologues, define the zero point of the CDES scale, through the assumption that at 1000 °C these gases achieve a Δ47 = 0.0266‰, and the
water-equilibrated gases define a second, generally higher point on this scale (e.g., at 25 °C Δ47 = 0.9196‰).
by Petersen et al. (2019). A wide range in δ47 values of gases used for
normalization is generally chosen to allow for accurate correction for an apparent dependence of Δ47 on δ47, which is caused by inaccurate
pres-sure-dependent background corrections on the m/z 47 collector observed on many instruments (Bernasconi et al., 2013; He et al., 2012). The large range in Δ47 (i.e., 25 °C, 1000 °C), on the other hand, is necessary to
cor-rect for scale compression caused by processes of scrambling and mole-cule recombination in the source of the mass spectrometer or elsewhere in the sample preparation, transfer lines and/or the capillaries (Dennis et al., 2011; Swart et al., 2019). With properly chosen CO2 standard gases
with widely varying δ47 values it is possible to cover the entire range of
natural carbonate compositions, avoiding extrapolations in the δ47 versus
Δ47 compositional space (Figure 1). Note that with measurement errors
(typically no better than 0.010‰) being relatively large compared to the natural compositional range (less than 0.5‰; Figure 1), the large (0.9‰) difference in Δ47 of the CO2 standard gases minimizes errors introduced
by uncertainties resulting from the measurement of HG and EG.
Meckler et al. (2014) attempted to achieve a similar framework as the CO2 gas-based standardization but with carbonate standards. They
de-scribed four carbonates that were developed at ETH Zürich to serve as replacements for HG’s and EG’s and demonstrated that good long- and short-term reproducibility can be achieved using only carbonates for data correction. Bernasconi et al. (2018) discussed in detail these standards and postulated, based on a limited interlaboratory data set, that carbonate standardization should generally improve interlaboratory data compara-bility. This claim seems arguably strengthened by the results of Meinicke et al. (2020), Peral et al. (2018), Piasecki et al. (2019), Kele et al. (2015) as recalculated by Bernasconi et al. (2018), and Jautzy et al. (2020). The first three studies produced independent foraminifera-based the fourth a travertine and the fifth a synthetic carbonate-based Δ47-temperature
cali-bration anchored to the same set of carbonate standards. These studies yielded statistically indistinguishable slopes and intercepts despite the use of independent sample sets and in the case of Peral et al. (2018), a different analytical system. In addition, a reanalysis of samples from five previous calibrations by Anderson et al. (2021) using carbonate standardization revealed no significant dif-ferences in temperature dependence of Δ47 between the different sample sets. This, solved a long standing
debate about variations in slope among calibrations
A possible limitation of carbonate standardization is that available carbonates have a smaller range in δ47
and, perhaps more importantly, a smaller range in Δ47 values than what is achievable with heated and
equilibrated gases. In some specific cases, standardization procedures require extrapolation to compositions that are not within the δ47–Δ
47 space created by carbonate standards (Figure 1). In addition, the range of Δ47
values for carbonates is only on the order of 0.5‰ between 0 and 1000 °C. The smaller range in Δ47
com-pared to HG’s and EG’s requires higher precision and also a larger number of replicates of both standards and samples. Daëron (2021) and Kocken et al. (2019) suggest ∼50:50 ratio of standard to sample replicates to keep standardization errors small.
1.2. InterCarb Goals and Design
InterCarb was designed with the aim to carefully evaluate the potential of carbonates to serve as a standard-ization scheme that improves interlaboratory agreement for “unknown” carbonates both inside and outside of the δ47–Δ
47 space defined by the anchor samples (Figure 2). The main questions posed are:
1. Is it possible to produce consistent carbonate clumped isotope measurements across laboratories using carbonate reference materials exclusively? In other words, does the observed interlaboratory scatter in Δ47 values match that expected from intralaboratory analytical precision?
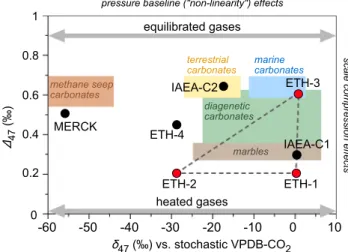
Figure 1. The δ47 versus Δ47 values of carbonate standards (Δ47 on
the I-CDES scale proposed here) and heated and equilibrated gases in comparison to the compositional ranges of typical natural carbonates. The observed range in measured clumped isotope compositions in natural carbonates can be completely bracketed by heated and equilibrated CO2 standard gases from which δ47 values have been chosen by the
user. The δ47 values for the anchor samples used in InterCarb (red) and
the unknowns (black) are reported for a theoretical working gas with stochastic isotope distribution, derived from VPDB. Actual δ47 values will
vary by laboratory depending on the composition of the working gas. Note the smaller achievable range in both δ47 and Δ47 values when using
carbonate standards compared to heated and equilibrated gases and the large extrapolation necessary for the determination of the composition for MERCK. Heated and equilibrated CO2 standard gases have a larger
Δ47 range, allowing for more robust stretching calculations with identical
numbers of standard:sample analyses. I-CDES, Intercarb-Carbon Dioxide Equilibrium Scale. -60 -50 -40 -30 -20 -10 0 10 MERCK IAEA-C2 IAEA-C1 ETH-4 ETH-3 ETH-1 ETH-2 heated gases equilibrated gases δ47(‰) vs. stochastic VPDB-CO2 Δ47 (‰) 0 0.2 0.4 0.6 0.8 1 methane seep carbonates terrestrial
carbonates marinecarbonates diagenetic
carbonates
marbles
pressure baseline ("non-linearity") effects
scale
compression
2. How well does the carbonate standardization approach perform when extrapolating beyond the δ47–Δ 47
compositional space sampled by a set of carbonate reference materials?
3. Do carbonate reference materials fully correct effects arising from different reaction temperatures, sam-ple preparation protocols, and analytical equipment?
4. Can we define a self-consistent set of widely available reference materials with community-agreed com-positions accurately anchored to the CDES scale?
5. Does the use of carbonate reference materials for standardization improve the interlaboratory reproduc-ibility compared to using HG’s and EG’s?
1.3. Approach
Seven carbonate standards with a large range of δ47 and Δ
47 values (Figure 1) were distributed among
par-ticipating laboratories and analyzed, treating three carbonates as “anchors” (whose Δ47 values are assigned
a priori) and the remaining four as “unknowns” (whose Δ47 values are unknown, to be determined by
comparison with the anchors). Due to their relatively widespread use in different laboratories, the three reference materials ETH-1, ETH-2, and ETH-3 (Bernasconi et al., 2018; Meckler et al., 2014) were chosen as anchors. They are still available today in relatively large quantities (>600 g), have been in use at ETH since 2013 and in many other laboratories for several years. Importantly, they have been thoroughly tested for homogeneity based on thousands of measurements in 80–150 µg aliquot sizes in different laboratories and no changes in composition have been noticed at ETH in the 7 years they have been in use.
The “unknown” InterCarb reference materials were chosen to cover a wide natural range in δ47 and Δ 47
values. These samples had to be available in large quantities, inexpensive, and if possible distributed by an organization with a long-term perspective in order to ensure future data quality and availability for the increasing number of laboratories globally.
2. Materials and Methods
2.1. Sample Description
The anchor samples ETH-1 (Carrara marble heated at 600 °C), ETH-2 (synthetic carbonate heated at 600 °C) and ETH-3 (Upper cretaceous chalk) are described in detail in Bernasconi et al. (2018).
IAEA-C1 (marble from Carrara, Italy) is distributed by the International Atomic Energy Agency (IAEA) as a mechanically crushed and milled product with grains ranging from 1.6 to 5 mm. All 50 g provided were ground and thoroughly homogenized in a ball mill at ETH Zürich to a grain size of less than 100 µm and transferred in 0.5 g aliquots to plastic vials for distribution. Nishida and Ishimura (2017) found that IAEA 603, which was produced from the same coarse marble as IAEA C-1, was isotopically inhomogeneous. Whitish grains (1–2 per 100 grains; grain weight, 8–63 μg) were significantly depleted in 18O and 13C
com-pared to translucent grains. In this study we found no evidence of inhomogeneity in Δ47 for sample aliquots
of 80–110 µg after the original material was ground in the ball mill.
IAEA-C2 is a freshwater travertine from Bavaria distributed by IAEA as a powder which was treated identi-cally to IAEA-C1. XRD analysis shows it to be calcite (Figure S1).
ETH-4 is a commercially available synthetic calcium carbonate (Riedel-De Haën; calcium carbonate Puriss. p.a.; Lot No. 30800) determined to be calcite by XRD (Figure S2 with intermediate formation temperature and the same bulk isotope composition as ETH-2 (see Bernasconi et al., 2018 for details).
MERCK (Catalog No. 1.02059.0050; lot no. B1164559 515) is an ultra-pure, commercially available synthetic calcium carbonate determined to be calcite by XRD (Müller et al., 2019) and was chosen for its very low δ13C and δ18O values of approximately −42.2‰ and −15.5‰ (VPDB), respectively. This sample represents
an extreme case of extrapolation from the δ47–Δ47 space defined by the anchor materials (Figure 2). The
same product was recently used to prepare the carbon isotope reference material USGS44 by Qi et al. (2021) which, after careful determination of its Δ47 could be used as a substitute for the aliquots of MERCK
2.2. Instrumentation
The reported data were produced with a variety of preparation systems including custom built (13 labora-tories) and commercial systems (11 laboratories; Protium MS IBEX, ThermoFisher Scientific Kiel IV de-vice and Nu Instruments Nucarb). Reaction temperatures were generally 90 °C for “large-sample” custom preparation systems and 70 °C for the Kiel and the NuCarb. Four mass spectrometer types were used: Ther-mo Fisher Scientific MAT253 and 253Plus, Nu Instruments Perspective, and Elementar Isoprime 100. All participants contributed results they considered to be of “publication-grade” quality, based on their existing quality-control procedures.
2.3. Clumped Isotope Compositions of the ETH Anchor Materials
The clumped isotope compositions of the four ETH reference materials relative to the CO2 reference frame
CDES were first reassessed based on new data provided by 10 laboratories that also provided HG and EG data measured during the same sessions as the ETH reference materials. The data were processed with the same Python script used for the carbonate data in order to avoid any differences in data processing (see Section 2.4).
Although, strictly speaking, 13C-18O clumping in carbonate represents a mass-63 anomaly, the clumped
iso-tope composition of carbonate minerals is reported as Δ47, that is, as the mass-47 excess in the CO2 produced
by acid digestion of these minerals, including the respective temperature-dependent isotopic fractionation. As initially all reactions were carried out at 25 °C (Ghosh, Adkins, et al., 2006), the Δ47 values have
tradi-tionally been reported for a 25 °C acid temperature. With the advent of automated extraction lines, reaction temperatures have been increased to 70 °C or 90 °C. To account for the temperature dependence of the acid fractionation factor (Guo et al., 2009; Petersen et al., 2019) and to project these results back to the orig-inal 25 °C acid reactions, various acid temperature correction values have been reported over time, based on experimental observations and/or theoretical predictions. Given that here seven out of 10 laboratories reacted carbonates at 90 °C, two at 70 °C, and only one at 25 °C, our redetermination of the Δ47 values of
ETH-1/2/3/4 relative to the CDES projected to 25 °C would rely substantially on the accuracy of these acid temperature corrections (which typically range between 60 and 90 ppm). For this reason, we report the Δ47
values of CO2 produced by reacting ETH-1/2/3/4 at 90 °C. With this choice the numerical effect of poorly
known acid corrections is minimized because the data from 70 °C and 25 °C reactions have relatively lit-tle influence on the final, error-weighted average Δ47 values (cf. statistical weights in Figure 2). We thus
propose to break with tradition and define the nominal Δ47 values of the anchor standards as those of CO2
produced at 90 °C, providing the most robust relationship to the CDES. 2.4. Data Processing, Correction, and Error Assessment
It should be stressed that the InterCarb experiment, by design, is not intended to grade the analytical per-formance of individual laboratories. Each participating laboratory (or mass spectrometer, in the case of lab-oratories with several instruments) was thus randomly assigned an anonymous identifying number. Within each laboratory, analyses were grouped in different analytical sessions defined by the participants them-selves. An analytical session is generally defined by a time in which the behavior of the analytical system (preparation system, source tuning, backgrounds, isotope scrambling in the source) is considered to be sim-ilar. The database record of each analysis consists of a laboratory identifier, a session identifier, an analysis identifier, the name of the analyzed sample, the mass spectrometer model, the acid reaction temperature, the mass of the reacted carbonate, and background-corrected δ45, δ46, and δ47 values.
The only instrumental corrections to the raw data applied independently by each participating laboratory were background corrections (“Pressure Baseline Correction” or PBL) to the ion currents/voltages (Bernas-coni et al., 2013; Fiebig et al., 2016, 2019; He et al., 2012). The PBL is strongly dependent on instrument de-sign (it is not observed in some instruments) and configuration, and varies temporally depending on many factors. This correction, therefore, can only be carried out by each participating laboratory according to its own established procedures and monitoring.
To avoid artifacts arising from different calculation/standardization procedures, rounding errors, and 17O
correction parameters, raw data from all laboratories were processed by a single Python script (http://doi. org/10.5281/zenodo.4314448) based on data reduction, standardization and error propagation methods de-scribed in detail in the companion paper (Daëron, 2021). Here we briefly summarize these calculations. Session-averaged, background-corrected δ45 and δ46 values for each of the three anchor samples were first
used to calculate the bulk isotope composition of the working gas used in each session, based on (a) previ-ously reported δ13C
VPDB and δ18OVPDB values of ETH-1, ETH-2, and ETH-3 (Bernasconi et al., 2018), (b) the
IUPAC 17O correction parameters of Brand et al. (2010), and (c) a temperature-dependent oxygen-18 acid
fractionation factor between CO2 and calcite of Kim et al. (2015). This recalculation of working gas bulk
compositions avoids (small) discrepancies potentially introduced by inaccuracies in the nominal composi-tions of the working gases.
Raw Δ47 values were computed according to:
raw 47 47 47
Δ R /R 1
where R47 is the measured ratio and R47* the calculated stochastic ratio of mass 47 over mass 44 of CO 2,
assuming perfectly linear IRMS measurements and a stochastic working gas. Values are then normalized to “absolute” Δ47 values (noted Δ in the equation below, and simply Δabs47 47 thereafter) using session-specific
relationships of the form:
raw abs 47 47 47
Δ aΔ bδ c
For each session, the best-fit standardization parameters (a, b, c) are computed from an unweighted least squares regression, treating Δ as the response variable, only considering the three anchor samples ETH-raw47
1, ETH-2, and ETH-3. Note the advantage of this form over that in Dennis et al. (2011) is the ability to have three standards with distinct Δ47 values whilst being able to solve for b (compositional nonlinearity)
(Daëron et al., 2016). Absolute Δ47 values are then computed for all replicates within that session.
Standard-ization parameters for all sessions are listed in Table 2.
Throughout this study, the analytical error assigned to each individual raw Δ47 analysis is equal to the
pooled “external” repeatability of raw Δ47 measurements of anchors and unknowns within each session.
In the figures and tables, final measurement uncertainties are reported as standard errors and/or 95% con-fidence limits, considering fully propagated errors taking into account reference frame corrections. In Fig-ures 2 and 4, different types of error bars are used to represent analytical errors only considering uncertain-ties in the analyses of a given sample or the full uncertainty considering standardization uncertainuncertain-ties (the “autogenic” errors of Daëron, 2021). In both cases, the analytical error assigned to each individual raw Δ47
analysis is equal to the pooled “external” repeatability of raw Δ47 measurements for all samples (anchors
and unknowns) within each session. This treatment of error is a new approach that more fully accounts for error in both the sample measurement and reference frame.
3. Results and Discussion
3.1. Redetermination of Nominal Δ47 Values for the ETH Standards Relative to Heated and
Equilibrated CO2 Gases
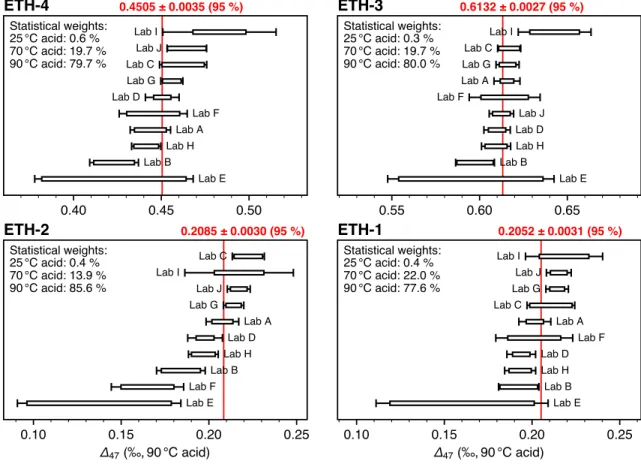
The weighted averages of the four standards (projected to 90 °C for the reactions at 25 and 70 °C using the acid temperature correction suggested by Petersen et al., 2019), comprising 873 analyses of the carbonate standards and 946 heated and equilibrated gases from 10 different laboratories, are reported in Table 1 and Figure 2. The large number of analyses and the appropriate consideration of the errors on the anchors (CO2
gas analyses) distinguishes this effort from previous work and allow a robust redetermination of the accept-ed values of the ETH reference materials with 1SE uncertainties of 2 ppm or less.
When compared with Bernasconi et al. (2018), the average Δ47 values ETH-1 and ETH-2, projected back to
increases by 0.010 and ETH-4 by 0.031‰. A similar positive offset of Δ47 compared to the values reported
in Bernasconi et al. (2018) has also been reported in Fiebig et al. (2019), Bajnai et al. (2020), and Thaler et al. (2020).
The observation that these changes in nominal values decrease as Δ47 increases suggests a simple
hypoth-esis to explain this discrepancy: in the original study of Meckler et al. (2014), the carbonate samples and the heated/equilibrated CO2 gases experienced different analytical procedures. The HGs were measured
as large samples at constant beam intensity through a different capillary than the carbonates, which were measured using the microvolume and a decreasing beam. The potential effects of partial re-equilibration for the heated gases in the gas preparation line or in the capillaries of the mass spectrometer could be sig-nificant whereas it would be minuscule for the gases equilibrated at 25°, leading to an overestimation of Δ47
scale compression and thus of the stretching applied to the Δ47 scale toward theoretical values. The observed
changes in apparent ETH-1 and ETH-2 Δ47 values may therefore simply reflect partial re-equilibration of
heated gases at the time of measurements at ETH (and reported in Meckler et al., 2014), increasing their values in the original study by about 0.05‰ (Figure 3).
It has been suggested previously that ETH-1 and ETH-2 should be indistinguishable in Δ47 and close to
stochastic distribution (Müller, Violay, et al., 2017). This is because Δ47 values of ETH-1 and ETH-2,
origi-nally heated to 600 °C, were found to be higher by only around 0.006‰ from the same carbonates heated at 1000 °C to achieve stochastic distribution of the isotopes. However, additional test measurements in multi-ple laboratories of sammulti-ples heated at >1000 °C are necessary to confirm this observation.
One laboratory (Laboratory F) did however observe a large difference in the value for ETH-1 and ETH-2, although their values of ETH-3 and ETH-4 are similar to other laboratories. The reason for these incon-sistencies is probably due to the fact that ETH-1 was only measured four times with a limited number of HG/EG, and ETH-2 and ETH-4 were not measured in the same session. In addition, the laboratories with
Laboratory All A B C D E F G H I J N of sessions 34 4 4 11 7 1 2 1 1 1 2 N of H/E CO2 946 44 193 257 85 47 21 38 192 13 56 ETH-1 N of analyses 232 34 14 5 54 4 4 19 58 8 32 Δ47 (‰; 90 °C acid) 0.2052 0.2016 0.1926 0.2108 0.1940 0.1601 0.2013 0.2143 0.1932 0.2183 0.2152 ±1SE 0.0016 0.0046 0.0058 0.0069 0.0042 0.0245 0.0107 0.0032 0.0045 0.0109 0.0036 Statistical weight 0.118 0.074 0.053 0.146 0.004 0.022 0.241 0.124 0.021 0.197 ETH-2 N of analyses 215 23 13 11 51 4 4 18 51 8 32 Δ47 (‰; 90 °C acid) 0.2085 0.2077 0.1840 0.2225 0.1978 0.1374 0.1650 0.2141 0.1968 0.2172 0.2170 ±1SE 0.0015 0.0047 0.0070 0.0046 0.0050 0.0233 0.0101 0.0029 0.0043 0.0154 0.0033 Statistical weight 0.105 0.047 0.108 0.092 0.004 0.023 0.272 0.125 0.010 0.213 ETH-3 N of analyses 264 55 15 20 54 4 5 15 59 8 29 Δ47 (‰; 90 °C acid) 0.6132 0.6156 0.5975 0.6169 0.6102 0.5950 0.6143 0.6159 0.6094 0.6428 0.6124 ±1SE 0.0014 0.0037 0.0056 0.0033 0.0038 0.0237 0.0099 0.0033 0.0042 0.0103 0.0035 Statistical weight 0.140 0.062 0.175 0.134 0.003 0.020 0.179 0.110 0.018 0.158 ETH-4 N of analyses 162 10 12 5 55 4 4 12 47 7 6 Δ47 (‰; 90 °C acid) 0.4505 0.4438 0.4230 0.4624 0.4506 0.4230 0.4454 0.4560 0.4414 0.4831 0.4646 ±1SE 0.0018 0.0058 0.0071 0.0068 0.0049 0.0226 0.0095 0.0032 0.0042 0.0161 0.0057 Statistical weight – 0.093 0.064 0.068 0.133 0.006 0.035 0.314 0.177 0.012 0.097
Note. Reported standard errors represent analytical uncertainties associated both with reference frame errors (HG/EG) and carbonate sample reproducibility (Daëron, 2021).
Table 1
Newly Determined Nominal Δ47 Values of the ETH Standards Projected to 90 °C Acid Reaction Using Acid Correction Factors of −0.088‰ and −0.022‰ for 25 °C
the smallest number of replicate measurements have uncertainties that are systematically larger (Table 1). These results highlight the importance of strict correction procedures in clumped isotope analysis. Suffi-cient replication of both standards and samples is critical and, if insuffiSuffi-cient, offsets can arise when com-paring results from different sessions. Due to these difficulties it is good practice to spread replicates of the same sample in different sessions over longer periods of time to obtain accurate results and follow a ∼50:50 standard to sample replicate ratio.
Based on the results above, the difference between the average of ETH1/2 and ETH-3 is reduced by 0.028‰, thus leading to a compression of the scale by about 5.8% compared to the values reported by Bernasconi et al. (2018). As a consequence, the slopes of published temperature calibrations produced with carbonate standardization (Bernasconi et al., 2018; Jautzy et al., 2020; Kele et al., 2015; Meinicke et al., 2020; Peral et al., 2018; Piasecki et al., 2019) will become slightly shallower, with more positive y-intercepts. If Δ47 results
from previous publications are also recalculated with the new standard values (see Section 3.4), however, changes in calculated formation temperatures will be negligible. For this reason, when comparing data from publications using old accepted values of the ETH standards for standardization (either those published by Meckler et al., 2014 or those recalculated with the IUPAC parameters by Bernasconi et al., 2018) to newer data, it is recommended to directly compare the reconstructed temperatures rather than recalculating Δ47.
Full recalculation of old measurements usually requires the availability of the entire data set including standards and the same correction procedures (e.g., averaging methods) used in the original publications (but see Appendix A for an alternative calculation method).
Figure 2. New determination of Δ47 values for the four ETH standards relative to the CDES using updated CO2 equilibrium values. These measurements, using
acid reaction temperatures of 90 °C, 70 °C, or 25 °C, are projected to 90 °C using acid corrections of −0.088‰ and −0.022‰ for 25 °C and 70 °C reactions, respectively (Petersen et al., 2019). Error bars correspond to 95% confidence limits taking into account fully propagated errors (i.e., taking into account errors in both unknown and anchor analyses). Boxes correspond to 95% confidence limits not accounting for normalization errors (i.e., only taking into account errors in unknown analyses). Red numbers are the error-weighted average values (with statistical weights summarized in upper-left corners). All plots have the same horizontal scales for the different samples. CDES, Carbon Dioxide Equilibrium Scale.
3.2. InterCarb Results
Results for the unknown carbonate samples were obtained from 25 mass spectrometers in 22 laboratories. The Δ47 values of the four unknown
samples were normalized to the new community-derived values of ETH-1, ETH-2, and ETH-3 of Table 1, then averaged per individual analytical session and mass spectrometer (Tables 2 and 3). Mean Δ47 values
ob-tained for each sample in each mass spectrometer are shown in Figure 4. The details of each analytical session, including the number of samples and standards measured, the isotopic composition of the working stand-ard, the scaling parameters and the internal reproducibilities (as 1SD) of the individual sessions are listed in Table 2. Some laboratories reported data for only a subset of the unknown samples, and both replication level and analytical reproducibility vary greatly from laboratory to laboratory (Table 2).
To clearly distinguish Δ47 values normalized to the CDES using
car-bonates rather than heated and equilibrated gases, we propose the new acronym (I-CDES), short for InterCarb-CDES, to reflect the use of the proposed InterCarb reference materials for data standardization (see Sec-tion 3.5 for more details).
The laboratory averages for the four unknowns show standard deviations of 0.011‰ for ETH-4 and IAEA-C1, 0.018‰ for IAEA-C2 and 0.024‰ for MERCK, the most extreme case of extrapolation (Table 3). Qualitatively, laboratories with stronger analytical constraints (i.e., better intralabora-tory repeatability of Δ47 measurements and/or greater number of
analy-ses) generally converge toward the overall mean value for each sample (Figure 4). This suggests that the observed interlaboratory variability is largely due to random errors that can be alleviated by replication, even for laboratories with relatively large analytical errors on individual measurements. It is also notable that fully propagated analytical errors that take into account uncertainties in the standardization procedure can be substantially larger than the errors based on the uncertainty associated with sample analyses alone, which is what is generally reported in the literature. The increase in error is also related to intralaboratory repeatability and the number of standards measured. In addition, the error increases for unknown samples whose compositions lie outside the “an-chor triangle” defined by ETH-1/2/3. This is illustrated by the increased scatter and errors associated with MERCK, the carbonate farthest from the “anchor triangle,” consistent with the models of Daëron (2021) (see also Kocken et al., 2019).
As seen in Table 2, there are stark differences in the total number of replicate analyses and the typical Δ47
reproducibility achieved in different laboratories. As a result, final uncertainties in the average Δ47 values
of unknown samples vary considerably (Figure 4). Interlaboratory variability is smaller among laboratories with small analytical uncertainties, and larger among laboratories with few replicate analyses and/or poor analytical repeatability. If we chose only laboratories that have provided data with average standard errors below 0.01‰ (Table 3), which is within the shot-noise limits of modern IRMS instruments, interlaboratory standard deviation (1SD) becomes ≤ 9 ppm for ETH-4 (N = 22), IAEA-C1(N = 15), and IAEA-C2 (N = 13) and ≤0.015‰ for MERCK (N = 11; with SE < 0.0135). We note that this does not significantly change the average value of the unknowns, and highlights the importance of sufficient sample replication to obtain accurate results.
Next we may assess whether interlaboratory discrepancies are significantly larger than expected from intral-aboratory analytical uncertainties, that is, whether we can detect the effects of hypothetical unrecognized sources of scatter beyond known analytical errors.
In order to do so, we compute the “number-of-sigma” deviation obtained by each laboratory for each un-known sample, relative to that sample’s overall weighted average value. For example, the sigma-deviation for sample ETH-4 and Lab01 is equal to (0.4477–0.4511)/0.0052 = −0.66 and that for MERCK and Lab13 is
Figure 3. New nominal Δ47 values for the ETH standards compared
to previously reported ones. The dashed gray line is a linear regression through the new versus old values of ETH-1/2/3/4, whose extrapolation coincides with 25 °C equilibrated CO2 but not with heated gases.
Apparent changes in the ETH-1/2/3/4 values thus scale linearly with the Δ47 difference between carbonate samples and 25 °C equilibrated
CO2, suggesting that Δ47 values of heated gases in the original study may
have been biased by ∼ +0.05‰ through partial re-equilibration at room temperature between the quenching of heated CO2 and its ionization in
Number of analyses
Nf
Working gas Standardization parameters Reproducibility (ppm)
Lab Session El E2 E3 E4 Cl CZ M δ13C VPDB δ18OVSMOW a b c δ13CVPDB δ18OVSMOW Δ47 01 01 16 17 10 7 0 0 0 46 −3.58 25.38 0.91 (6.0 × l0−4) −0.893 41 91 31.5 02 6 5 3 1 0 0 0 11 −3.52 25.58 0.89 −2.1 × 10⁻³ −0.765 34 64 22.8 03 150 146 65 72 19 21 22 488 −3.63 25.22 0.98 (−2.9 × 10⁻⁵) −0.965 33 74 33.5 02 01 19 24 20 18 4 5 4 87 −36.89 8.76 0.99 −5.6 × 10⁻⁴ −0.955 17 92 13.0 02 6 8 5 4 2 3 2 23 −36 0.88 8.83 0.98 (−5.5 × 10⁻⁴) −0.931 25 77 16.1 03 01 37 24 17 9 0 0 0 83 −10.44 31.64 0.98 (−1.6 × 10⁻⁴) −0.917 22 56 27.9 02 29 32 12 14 17 13 11 121 −3.65 25.28 1.00 (−1.7 × 10⁻⁴) −0.917 46 93 25.2 04 01 6 9 9 6 4 – 35 −6.57 27.18 0.97 5.0 × 10⁻³ −1.022 259 562 40.6 05 01 3 3 5 2 3 2 2 13 −10 0.43 31.31 0.95 l.7 × 10−3 −0.970 15 27 8.6 02 13 13 13 12 10 11 8 73 −3.62 25.05 0.99 (3.8 × 10⁻⁴) −0.968 15 24 20.9 03 7 10 10 8 5 4 4 41 −3.63 25.06 0.90 1.1 × 10⁻³ −0.901 42 113 17.3 06 01 6 3 5 3 3 3 3 19 −2.95 25.52 0.83 (−3.8 × 10⁻⁴) −0.920 22 25 21.0 02 6 6 6 6 0 0 0 20 −2.98 24.93 0.92 (−9.9 × 10⁻⁵) −0.920 14 71 13.3 03 3 3 3 3 3 3 3 14 −3.01 24.90 0.88 (3.6 × 10⁻⁴) −0.932 10 43 9.4 04 6 6 6 0 6 6 6 30 −2.95 25.28 0.90 (−l.4 × 10−4) −0.926 18 61 17.3 07 01 – 4 4 – 4 4 – 19 −11.64 35.75 0.87 3.5 × 10⁻³) −0.836 91 303 23.9 08 01 5 6 9 4 4 4 4 29 −2.68 25.86 0.94 (−9.2 × 10⁻⁴) −0.686 13 25 28.4 02 5 4 14 6 4 5 4 35 −2.64 25.96 0.94 (8.6 × 10⁻⁴) −0.741 83 88 33.2 03 4 4 13 4 3 5 6 32 −2.64 25.91 0.93 (−1.7 × 10⁻⁴) −0.728 15 33 33.2 04 4 5 9 5 4 4 4 28 −2.67 25.85 0.85 (1.3 × 10⁻⁴) −0.629 17 51 44.5 OS 3 6 8 4 4 4 4 26 −2 0.70 25.79 0.87 (1.3 × 10⁻³) −0.660 16 56 43.3 06 4 4 16 6 6 6 4 39 −2.63 25.90 0.92 (3.9 × 10⁻⁴) −0.693 85 54 37.8 07 3 4 16 6 6 4 6 38 −2.66 25.90 0.96 (−1.9 × 10⁻³) −0.709 19 52 48.8 08 4 4 16 4 4 4 4 33 −2.66 25.89 1.03 (3.9 × 10⁻⁵) −0.806 12 46 42.7 09 5 6 8 4 4 3 4 27 −2.67 25.84 0.92 (1.6 × 10⁻⁴) −0.722 19 25 46.7 10 6 6 6 4 4 2 4 25 −2.63 25.91 0.97 (4.4 × 10⁻⁴) −0.767 36 39 40.5 11 6 5 8 4 4 3 4 27 −2.67 25.87 0.97 (2.5 × 10⁻⁴) −0.760 11 31 49.5 12 6 6 8 3 4 4 4 28 −2.66 25.86 1.02 (7.9 × 10⁻⁴) −0.767 58 40 61.3 13 4 6 8 6 4 4 6 31 −2.63 25.93 0.89 (1.3 × 10⁻³) −0.685 19 38 41.0 14 5 7 5 4 4 4 4 26 −2.59 25.90 0.90 (−3.6 × 10⁻⁴) −0.665 76 104 27.4 15 6 4 8 4 4 4 4 27 −2.68 25.79 0.95 −2.0 × 10⁻³ −0.685 21 52 36.0 16 2 2 10 5 4 2 4 22 −2.63 25.89 0.96 (−5.4 × 10⁻⁴) −0.765 40 39 38.8 09 01 4 4 5 6 0 0 0 15 −3.60 25.36 0.89 3.8 × 10⁻³ −0.856 22 74 28.3 02 26 19 16 24 0 0 0 81 −3.36 19.94 0.90 5.2 × 10⁻³ −0.928 46 98 18.4 03 21 17 13 19 0 1 0 66 −3.53 24.49 0.92 −l.0 × 10−2 −0.968 72 1667 22.4 04 19 16 13 16 8 7 2 74 −3.60 25.27 0.98 −9.6 × 10⁻³ −0.994 44 56 16.0 10 01 7 7 8 2 0 11 0 30 −7.43 32.38 0.98 l.9 × 10−3 −1.077 24 38 35.1 02 15 15 21 15 11 20 11 101 −7.41 32.42 0.93 (−2.0 × 10⁻⁴) −0.877 25 44 23.0 03 17 18 25 9 22 31 20 135 −7.43 32.37 0.96 (−2.8 × 10⁻⁴) −0.900 31 92 30.0 Table 2
Table 2
Continued
Number of analyses
Nf
Working gas Standardization parameters Reproducibility (ppm)
Lab Session El E2 E3 E4 Cl CZ M δ13C VPDB δ18OVSMOW a b c δ13CVPDB δ18OVSMOW Δ47 11 01 24 24 28 28 0 0 0 100 −3.63 25.37 0.99 (−8.1 × 10⁻⁵) −0.974 23 91 19.1 02 20 18 15 15 0 0 0 64 −3.60 25.53 0.98 (3.5 × 10⁻⁴) −0.996 35 270 28.9 03 69 62 74 66 13 13 8 298 −3.02 24.99 0.91 (−2.2 × 10⁻⁴) −1.065 34 89 25.0 04 36 34 34 35 6 4 8 150 −3.01 25.08 1.00 (−3.l ×10−4) −1.088 87 210 33.7 OS 90 83 92 78 12 10 9 367 −2.76 25.78 0.98 (−5.0 × 10⁻⁴) −1.088 97 317 19.3 12 01 7 7 9 5 5 6 5 37 −3.75 25.15 0.89 3.7 × 10⁻³ −0.904 7 41 10.2 02 7 6 6 6 5 5 5 33 −3.74 25.18 0.87 4.6 × 10⁻³ −0.897 8 so 9.3 03 8 7 12 5 5 5 5 40 −3.74 25.17 0.88 5.5 × 10⁻³ −0.909 9 51 9.7 04 6 7 6 5 5 5 4 31 −3.74 25.17 0.88 5.3 × 10⁻³ −0.908 7 51 8.7 13 01 58 51 59 47 6 12 9 235 −10.29 33 0.18 0.98 −3.7 × 10⁻⁴ −0.993 176 239 26.8 14 01 4 7 10 10 0 0 0 27 −3.63 24.95 0.93 (1.3 × 10⁻⁴) −0.972 42 159 19.3 02 10 11 8 7 0 0 0 32 −3.61 25.04 0.97 (5.8 × 10⁻⁴) −1.021 40 128 30.0 03 6 4 4 3 0 0 0 13 −10.38 31.93 0.84 −1.7 × 10⁻³ −0.747 39 59 20.5 04 2 2 2 2 0 0 0 4 −10 0.40 31.92 0.86 −l.0 × 10−3 −0.794 20 29 9.2 05 4 4 3 4 0 0 0 11 −10 0.40 31.92 0.91 −l.6 × 10−33 −0.807 27 60 11.0 06 5 6 6 7 0 0 0 20 −10.43 31.84 0.99 (1.3 × 10⁻⁴) −0.908 39 53 22.4 07 3 5 2 1 0 0 0 7 −10 0.41 31.85 0.97 (−1.7 × 10⁻⁴) −0.877 51 43 12.8 08 11 7 3 5 0 0 0 22 −10.47 31.66 0.94 −7.8 × 10⁻⁴ −0.920 61 84 23.4 09 4 2 3 4 0 0 0 9 −10 0.43 31.82 0.95 (−4.8 × 10⁻⁴) −0.907 55 83 12.0 10 4 4 1 3 0 0 0 8 −10.49 31.73 0.99 (1.7 × 10⁻⁴) −0.926 40 71 13.3 15 01 4 4 4 4 0 0 0 12 −32 0.89 36 0.92 0.96 −2.5 × 10⁻³ −0.887 87 70 14.6 02 4 4 4 4 4 4 4 21 −3.72 24.98 1.02 4.6 × 10⁻³ −1.027 59 41 14.0 16 01 – 6 6 4 4 – – 23 −10.49 31.56 0.99 −4.1 × 10⁻³ −0.979 47 109 10.1 17 01 – 5 – – 6 6 – 23 −9.73 23.81 0.81 (6.3 × 10⁻⁴) −0.940 65 204 29.3 18 01 168 147 172 169 20 20 25 714 −3.45 25.25 0.81 (1.5 × 10⁻⁴) −0.722 65 11 0 37 0.7 0 2 17 14 17 13 4 4 4 66 - 3 0.4 1 25 0.4 2 0.83 (1.6 × 10⁻⁵) −0.761 21 52 45.7 03 11 12 13 14 2 4 2 51 −3.52 25.12 0.96 (6.0 × 10⁻⁴) 1 −0.835 23 45 40.5 19 01 4 4 5 7 5 4 4 26 −24.48 25.66 0.99 (2.0 × 10⁻⁴) −0.970 69 193 23.4 02 7 8 10 7 0 0 0 28 5.03 38.66 0.99 (2.0 × 10⁻⁴) −0.962 164 416 22.5 20 01 9 6 6 6 0 0 0 23 −3.63 28.89 0.93 −2.1 × 10⁻³ −0.921 11 so 14.3 21 01 – – – – 0 0 0 8 −3.62 25.20 0.90 l.0 × 10−3 −0.886 65 139 11.4 22 01 8 8 8 0 0 – 33 −3.54 25.37 0.98 9.9 × 10⁻³ −0.951 155 443 20.5 23 01 6 6 6 6 0 0 – 20 −10 0.77 31.02 1.00 4.4 × 10⁻³ −0.948 47 91 20.5 24 01 19 18 15 12 0 0 0 60 −4.40 25.32 0.98 (2.1 × 10⁻⁴) −0.955 42 107 9.9 26 01 4 4 4 3 – – 19 −40.04 5.51 0.89 (2.2 × 10⁻⁴) −0.998 96 14 5 15.0 02 6 7 6 3 – – 24 −40 0.03 5.40 0.92 (−1.1 × 10⁻⁴) −1.014 50 88 8.7
Notes. Nf is the number of degrees of freedom when estimating pooled analytical repeatabilities and standardization model uncertainties. Standardization parameters a, b, and c refer to the scrambling factor in the source, the compositional slope due to positive or negative backgrounds in the collectors and the working gas offset, respectively (see Section 2.4 and Daëron, 2021). Values of standardization parameter b which are statistically indistinguishable from zero at 95% confidence level are reported in parenthesis. Reproducibility is reported as 1 SD.
equal to (0.5470–0.5135)/0.0135 = +2.48. If the analytical errors reported in Table 3 are reasonably accu-rate, we expect the population of sigma-deviations among all laboratories to be distributed as the canonical Gaussian distribution (μ = 0; σ = 1), and we can test this prediction using established statistical methods such as a Kolmogorov-Smirnov test of normality (Massey, 1951). We carried out this test for two cases: only considering the error of sample replication (Figure 5, upper row) and second including the normalization error (i.e., the fully propagated error (Figure 5, lower row). If we neglect uncertainties arising from stand-ardization (the “allogenic” errors of Daëron, 2021), the sigma-deviations are no longer normally distributed (p = 0.003, Figure 5 upper-left panel). When considering fully propagated analytical errors, as shown in the lower-left panel of Figure 5, the distribution of sigma-deviations for all laboratories and all samples is statistically indistinguishable from the expected normal distribution (p = 0.19). Figure 5 also illustrates that neglecting standardization errors does not strongly affect the normality of sigma-deviations for IAEA-C1, which has δ47 and Δ
47 values within the range covered by the three anchor samples. By contrast,
sigma-devi-MS
ETH-4 IAEA-C1 IAEA-C2 MERCK
Δ47(I-CDES
(‰ ± 1SE) N (‰ ± 1SE)Δ47(I-CDES N (‰ ± 1SE)Δ47(I-CDES N (‰ ± 1SE)Δ47(I-CDES N
1 0.4477 ± 0.0052 80 0.2773 ± 0.0080 19 0.6275 ± 0.0088 21 0.4991 ± 0.0105 22 2 0.4499 ± 0.0044 22 0.3086 ± 0.0060 6 0.6299 ± 0.0061 8 0.5025 ± 0.0089 6 3 0.4430 ± 0.0074 23 0.3114 ± 0.0073 17 0.6427 ± 0.0112 13 0.5235 ± 0.0152 11 4 0.4841 ± 0.0248 9 0.2959 ± 0.0215 6 0.6368 ± 0.0291 4 – – 5 0.4734 ± 0.0055 22 0.2916 ± 0.0044 18 0.6378 ± 0.0057 17 0.4987 ± 0.0094 14 6 0.4545 ± 0.0060 12 0.3004 ± 0.0051 12 0.6471 ± 0.0069 12 0.5229 ± 0.0116 12 7 0.4607 ± 0.0066 8 0.3099 ± 0.0042 16 0.6520 ± 0.0052 15 0.5231 ± 0.0098 8 8 0.4442 ± 0.0072 73 0.3099 ± 0.0060 67 0.6383 ± 0.0071 62 0.5159 ± 0.0127 70 9 0.4505 ± 0.0041 65 0.2926 ± 0.0064 8 0.6309 ± 0.0078 8 0.5630 ± 0.0158 2 10 0.4416 ± 0.0075 26 0.2987 ± 0.0060 33 0.6348 ± 0.0065 62 0.4954 ± 0.0130 31 11 0.4468 ± 0.0025 222 0.3085 ± 0.0043 31 0.6354 ± 0.0050 27 0.5175 ± 0.0066 25 12 0.4521 ± 0.0032 21 0.3015 ± 0.0026 20 0.6479 ± 0.0032 21 0.5064 ± 0.0054 19 13 0.4484 ± 0.0062 47 0.3048 ± 0.0113 6 0.6376 ± 0.0091 12 0.5470 ± 0.0135 9 14 0.4548 ± 0.0041 46 – – – – – – 15 0.4480 ± 0.0083 8 0.3016 ± 0.0090 4 0.6217 ± 0.0116 4 0.4642 ± 0.0195 4 16 0.4627 ± 0.0076 4 0.2962 ± 0.0063 4 0.6563 ± 0.0084 3 0.5176 ± 0.0136 2 17 0.4634 ± 0.0250 5 0.3254 ± 0.0181 6 0.6971 ± 0.0314 6 0.4623 ± 0.0429 3 18 0.4510 ± 0.0046 196 0.3060 ± 0.0079 26 0.6386 ± 0.0084 28 0.5317 ± 0.0104 31 19 0.4460 ± 0.0106 14 0.2851 ± 0.0142 5 0.6015 ± 0.0183 4 0.5256 ± 0.0339 4 20 0.4627 ± 0.0095 6 – – – – – – 21 0.4470 ± 0.0108 3 – – – – – – 22 0.4639 ± 0.0124 7 – – – – 0.5269 ± 0.0213 7 23 0.4453 ± 0.0137 6 – – – – – – 24 0.4544 ± 0.0042 12 – – – – – – 26 0.4378 ± 0.0058 8 0.3008 ± 0.0051 6 0.6396 ± 0.0062 6 0.5152 ± 0.0095 6 w. avg 0.4511 ± 0.0011 945 0.3018 ± 0.0013 310 0.6409 ± 0.0016 333 0.5135 ± 0.0024 286 SD 0.011 – 0.011 – 0.018 – 0.024 –
Notes. Note the larger standard deviation for the samples further from the calibration triangle defined by the anchors. The average Δ47 values for individual analytical sessions are reported in Table 2.
Table 3
Average Δ47 Values (±1SE, Fully Propagated Uncertainties) Obtained by Each Mass Spectrometer From the 22
ations for unknowns with “exotic” isotopic compositions (ETH-4 and IAEA-C2 but especially MERCK) are only normally distributed if standardization uncertainties are correctly accounted for.
Based on these tests, we conclude that the interlaboratory scatter observed in the InterCarb data set is nei-ther smaller nor larger than expected from the analytical uncertainties computed within each laboratory,
as long as standardization errors are taken into account. This important finding implies that, at least for the
time being, we can rule out any systematic interlaboratory discrepancies in carbonate-standardized Δ47
measurements, which constitutes an important milestone in the progress of clumped isotope measurement techniques.
On demonstrating that we can fully account for interlaboratory error using carbonate standardization, we revisit the results obtained for ETH1-4 using HG and EG (Figure 2). Applying the same Kolmogor-ov-Smirnov test of normality yields unambiguous evidence that the interlaboratory scatter observed here, using HG/EG standardization, is significantly greater than predicted from known analytical errors alone (p = 0.005, Figure 6), contrary to the opposite finding for the InterCarb results, using carbonate-based standardization (p = 0.19, Figure 5).
Figure 4. Final InterCarb results by laboratory. Error bars correspond to fully propagated 95% confidence limits, taking
into account errors in both unknown and anchor analyses. Boxes correspond to 95% confidence limits not accounting for normalization errors (i.e., only taking into account errors in unknown analyses). Results are sorted by increasing analytical errors, and laboratories are identified by number. Overall error weighted average Δ47 values are displayed as