HAL Id: hal-00330340
https://hal.archives-ouvertes.fr/hal-00330340
Submitted on 14 Oct 2008
HAL is a multi-disciplinary open access
archive for the deposit and dissemination of
sci-entific research documents, whether they are
pub-lished or not. The documents may come from
teaching and research institutions in France or
abroad, or from public or private research centers.
L’archive ouverte pluridisciplinaire HAL, est
destinée au dépôt et à la diffusion de documents
scientifiques de niveau recherche, publiés ou non,
émanant des établissements d’enseignement et de
recherche français ou étrangers, des laboratoires
publics ou privés.
Pacific: longitudinal trends and coupling with primary
production
France van Wambeke, I. Obernosterer, T. Moutin, S. Duhamel, O. Ulloa,
Hervé Claustre
To cite this version:
France van Wambeke, I. Obernosterer, T. Moutin, S. Duhamel, O. Ulloa, et al.. Heterotrophic bacterial
production in the eastern South Pacific: longitudinal trends and coupling with primary production.
Biogeosciences, European Geosciences Union, 2008, 5 (1), pp.157-169. �hal-00330340�
www.biogeosciences.net/5/157/2008/
© Author(s) 2008. This work is distributed under the Creative Commons Attribution 3.0 License.
Biogeosciences
Heterotrophic bacterial production in the eastern South Pacific:
longitudinal trends and coupling with primary production
F. Van Wambeke1, I. Obernosterer2,3, T. Moutin4, S. Duhamel1,4, O. Ulloa5, and H. Claustre6
1Laboratoire de Microbiologie, G´eochimie et Ecologie Marines (LMGEM), CNRS, UMR 6117, Universit´e de la
M´editerran´ee, Campus de Luminy – Case 901, 13288 Marseille cedex 9, France
2Universit´e Pierre et Marie Curie-Paris6, Laboratoire ARAGO, Avenue Fontaul´e, BP44, 66650 Banyuls-sur-Mer, France 3CNRS, UMR7621, Laboratoire d’Oc´eanographie Biologique de Banyuls, Avenue Fontaul´e, BP44, 66650 Banyuls-sur-Mer,
France
4Laboratoire d’Oc´eanographie et de Biog´eochimie (LOB), CNRS, UMR 6535, Universit´e de la M´editerran´ee, Campus de
Luminy – Case 901, 13288 Marseille cedex 9, France
5Departmento de Oceanograf´ıa & Centro de Investigaci´on Oceanogr´afica en el Pac´ıfico Sur-Oriental, Universidad de
Concepci´on, Casilla 160-C, Concepci´on, Chile
6CNRS, Laboratoire d’oc´eanographie de Villefranche, 06230 Villefranche-sur-Mer, France ; Universit´e Pierre et Marie
Curie-Paris6, Laboratoire d’oc´eanographie de Villefranche, 06230 Villefranche-sur-Mer, France
Received: 23 July 2007 – Published in Biogeosciences Discuss.: 15 August 2007 Revised: 7 January 2008 – Accepted: 7 January 2008 – Published: 8 February 2008
Abstract. Spatial variation of heterotrophic bacterial pro-duction and phytoplankton primary propro-duction were inves-tigated across the eastern South Pacific Ocean (−141◦W,
−8◦S to −72◦W, −35◦S) in November–December 2004. Bacterial production (3H leucine incorporation) integrated over the euphotic zone encompassed a wide range of val-ues, from 43 mg C m−2d−1in the hyper-oligotrophic South Pacific Gyre to 392 mg C m−2d−1in the upwelling off Chile. In the gyre (120◦W, 22◦S) records of low phytoplankton biomass (7 mg Total Chla m−2) were obtained and fluxes of in situ14C-based particulate primary production were as low as 153 mg C m−2d−1, thus equal to the value considered as a limit for primary production under strong oligotrophic conditions. Average rates of3H leucine incorporation rates, and leucine incorporation rates per cell (5–21 pmol l−1h−1 and 15–56×10−21mol cell−1h−1, respectively) determined in the South Pacific gyre, were in the same range as those re-ported for other oligotrophic subtropical and temperate wa-ters. Fluxes of dark community respiration, determined at selected stations across the transect varied in a narrow range (42–97 mmol O2m−2d−1), except for one station in the
up-welling off Chile (245 mmol O2m−2d−1). Bacterial growth
Correspondence to: F. Van Wambeke
(france.van-wambeke@univmed.fr)
efficiencies varied between 5 and 38%. Bacterial carbon de-mand largely exceeded 14C particulate primary production across the South Pacific Ocean, but was lower or equal to gross community production.
1 Introduction
Over a broad range of aquatic systems, heterotrophic bac-terial biomass varies less than phytoplankton biomass (Cole et al., 1988). The magnitude, variability and control of bac-terial heterotrophic production has been well studied in the northern hemisphere (Ducklow, 2000; Landry and man, 2002), including the Arctic (Sherr et al., 2003; Kirch-man et al., 2005). By contrast, the oceans in the southern hemisphere have been much less explored, except along sev-eral coasts and margins, and the Indian and the Antarctic Ocean. In the Pacific Ocean, results for heterotrophic bac-terial production were mainly acquired in tropical and sub-tropical regions (20◦N–20◦S, Landry and Kirchman, 2002). The North Pacific Central gyre has been intensively studied, particularly the long term station HOTS (Hawaii Ocean Time Series, Karl et al., 2001). Overall, oligotrophic regions of the ocean are clearly the least well studied.
On the basis of remotely-sensed ocean color, the South Pacific central gyre appears to be the most oligotrophic and
MAR HNL UPX UPW GYR 1 2 13 3 4 5 8 14 11 12 7 6 15 17 18 19 20 21 EGY
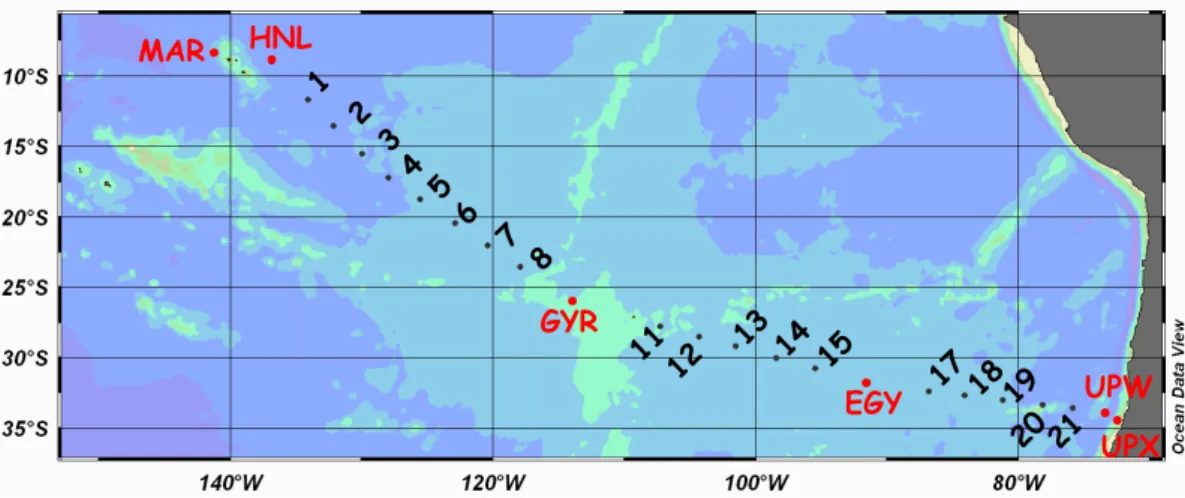
Fig. 1. Transect of the BIOSOPE cruise from the Marquesas Islands to Chile. Long-term process stations are indicated in red. Numbers indicates short-term stations, for which only numbers have been indicated to simplify presentation, and not the complete code as in Table 3. For instance 1 is STB1 and 21 is STA21.
stable water body (Claustre and Maritonera, 2003). To date, however, no investigation on the biogeochemistry of this wa-ter body has taken place. The aim of the BIOSOPE (Bio-geochemistry and Optics South Pacific Experiment) project was to conduct a pluridisciplinary exploration of this gyre as well as their eastern (Chilean coastal upwelling) and western (Marquesas plateau) borders, allowing the examination of a very large range of trophic conditions. Hyperoligotrophic conditions were observed at the centre of the gyre, with the clearest natural waters ever described (Morel et al., 2007), and a deep chlorophyll maximum reaching 180 m (Ras et al., 2007). The aim of the present study was to determine the abundance and activity of heterotrophic bacteria across the South Pacific Ocean, and to relate bacterial heterotrophic ac-tivity to phytoplankton primary production. We further dis-cuss the techniques involved for determining the coupling be-tween primary and bacterial heterotrophic production.
2 Materials and methods 2.1 Strategy of sampling
The BIOSOPE cruise was conducted from 24 October to 11 December 2004 aboard R/V Atalante across the east-ern South Pacific Ocean (Fig. 1). Stations of short (<5 h, 21 stations) and long (3 to 6 days, 6 stations) duration were sampled (Table 1). Stations occupied for less than 5 h were abbreviated chronologically (station type STB1 to STB20 and STA21, Fig. 1, Table 1). The stations of long dura-tion were abbreviated according to their locadura-tion: MAR (in the vicinity of Marquesas Islands), HNL (High Nutrients Low Chlorophyll waters in North Eastern area far from Mar-quise Islands), GYR (the central part of the South Pacific gyre), EGY (the eastern part of the South Pacific gyre) and, UPW and UPX (two sites chosen in the coastal upwelling
region of central Chile). At the short stations we systemati-cally sampled at 09:00 h local time to avoid possible biases due to daily variability in heterotrophic bacterial abundance and activity. At the long stations, we checked the valid-ity of our routine bacterial production protocols by time se-ries and concentration kinetics. All samples were collected from a CTD-rosette system fitted with 20 12-l Niskin bot-tles equipped with Teflon rings. Samples were processed within 1 h of collection. Water samples used for in situ-simulated primary measurements (IPPdeck) came from the
same rosette cast as that used for bacterial production (the 09:00 a.m. CTD cast). However some measurements of PP using the JGOFs protocol (in situ moored lines immerged for 24 h from dusk to dusk, IPPinsitu) were also performed
some-times at the long stations. In that case, samples were taken on a rosette before dusk. Besides measurements of bacte-rial abundance and production and primary production de-scribed below, other data presented in this paper include hy-drographic properties (Claustre et al., 2008) and Total chloro-phyll a (TChla=Chla+Divinyl-Chla, Ras et al., 2007).
2.2 Bacterial abundance
Water samples for flow cytometric analyses of non-chlorophyllous bacterioplankton populations, asssumed to be mainly heterotrophic bacteria in the upper ocean, were fixed with paraformaldehyde at 1% and preserved in liquid nitro-gen for further analysis in the laboratory. The protocol is fully described in Grob et al. (2007). Briefly, bacterioplank-ton samples were stained with SYBR-Green I and counted on a FACS Calibur (Becton Dickinson) flow cytometer.
2.3 Bacterial production
“Bacterial” production (BP – sensus stricto referring to het-erotrophic prokaryotic production –) was determined by [3H]
Table 1. Main physical and biological characteristics of the stations sampled during the BIOSPE cruise. SST: sea surface temperature, Ze: depth of the euphotic zone (1% PAR), Z10%(UV-B): the 10% UV-B irradiance depth (at 305±2 nm) as determined in T´edetti et al. (2007), I TChla: integrated Total chlorophyll a, IPPdeck: integrated particulate primary production (based on on-deck incubations, see methods), IBPZe: integrated bacterial heterotrophic production. All stocks and fluxes are integrated from the surface to the euphotic depth.
station Longitude Latitude date SST Ze Z10%(UVB) I TChl a IPPdeck IBPZe
◦W ◦S ◦C m m mg m−2 mgC m−2d−1 mgC m−2d−1 MAR1 −141.24 −8.40 26 October 27.8 66 10 24 457 131 MAR3 −141.28 −8.33 28 October 27.8 70 21 683 144 HNL1 −136.85 −9.00 31 October 27.8 90 10 16 335 86 STB1 −134.10 −11.74 3 November 27.8 99 12 17 414 101 STB2 −132.11 −13.55 4 November 27.4 124 17 250 96 STB3 −129.93 −15.53 5 November 27.1 134 12 16 150 114 STB4 −127.97 −17.23 6 November 26.5 136 17 16 164 87 STB5 −125.55 −18.75 7 November 25.7 142 19 11 142 71 STB6 −122.89 −20.45 8 November 24.5 157 5 139 72 STB7 −120.38 −22.05 9 November 24.3 167 28 8 76 79 STB8 −117.89 −23.55 10 November 23.4 144 7 152 61 GYR2 −114.01 −25.97 12 November 22.1 160 21 11 159 50 STB11 −107.29 −27.77 20 November 21.3 152 8 97 62 STB12 −104.31 −28.54 21 November 21.2 152 19 7 98 49 STB13 −101.48 −29.23 22 November 20.0 145 8 125 43 STB14 −98.39 −30.04 23 November 19.8 136 10 138 47 STB15 −95.43 −30.79 24 November 18.7 108 12 219 57 EGY2 −91.46 −31.82 26 November 18.1 92 12 14 196 55 STB17 −86.78 −32.40 1 December 17.3 96 10 15 280 61 STB18 −84.07 −32.68 2 December 17.4 87 9 15 233 44 STB19 −81.20 −33.02 3 December 17.2 107 12 195 57 STB20 −78.12 −33.35 4 December 17.6 48 21 359 93 STA21 −75.83 −33.61 5 December 16.8 56 21 566 110 UPW2 −73.36 −33.93 7 December 15.9 34 3 59 226 UPX1 −72.41 −34.54 9 December 13.3 38 39 1446 392
leucine incorporation applying the centrifugation method (Smith and Azam, 1992). Duplicate 1.5 mL samples were in-cubated with a mixture of [4,5-3H]leucine (Amersham, spe-cific activity 160 Ci mmol−1)and nonradioactive leucine at final concentrations of 7 and 13 nM, respectively for active waters (>10 pmol leu l−1h−1)and the opposite (7 nM cold, 13 nM labeled) for low activity waters. Samples were incu-bated in the dark at the respective in situ temperatures for 1– 7 h according to expected activities, period during which we preliminarily checked that the incorporation of leucine was linear with time (e.g. at the centre of the gyre we incubated surface waters on average for 2 h, and the activity in dark incubated samples was linear up to 8 h, data not shown). In-cubations were stopped by the addition of trichloracetic acid (TCA) to a final concentration of 5%. To facilitate the pre-cipitation of proteins, bovine serum albumin (BSA, Sigma, 100 mg l−1final concentration) was added prior to centrifu-gation at 16 000 g for 10 min. After discarding the super-natant, 1.5 ml of 5% TCA were added and the samples were subsequently vigorously shaken on a vortex and centrifuged again. The supernatant was discarded and 1.5 ml of PCS
liq-uid scintillation cocktail (Amersham) were added. The ra-dioactivity incorporated into bacterial cells was counted in a Packard LS 1600 Liquid Scintillation Counter on board the ship. We checked effects of ethanol rinse and BSA addi-tion in our protocol, because in most published studies BSA is not added and ethanol rinse is often used to remove un-specific 3H labelling (Wicks and Robarts, 1998; Ducklow et al., 2002; Kirchman et al., 2005) although sometimes ethanol rinse did not change the results (Van Wambeke et al., 2002; Gran´eli et al., 2004). There was no significant difference among the different treatments (+ or − ethanol, + or − BSA added, data not shown). As we also man-aged some size-fractionated BP measurements on some se-lected samples, we were also able to compare the filtration technique (20 ml incubated with 1 nM 3H-leucine +19 nM cold leucine, filtered through Millipore GS 0.2 µm filters, no ethanol rinse), with the centrifugation technique (BSA addi-tion, no ethanol rinse). The model II regression was applied to compute the relationships between both techniques. With the whole data set (n=88, BP range 5–578 ng C l−1h−1), the slope of “filtration” versus “centrifugation” was 1.04±0.02,
leu inc. rates pmol l-1h-1
BN x 105 ml-1
MAR GYR EGY UPW
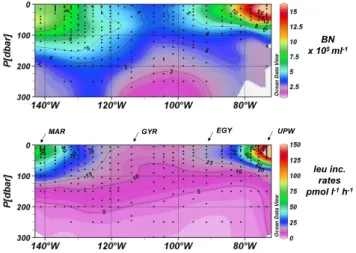
Fig. 2. Distribution of bacterial abundances (upper panel) and leucine incorporation rates (lower panel) along the BIOSOPE cruise transect. All CTD casts were performed around 09:00. The main characteristics of the stations sampled are presented in Table 1. The scale of leucine incorporation rates is limited to 150 pmol l−1h−1 but higher values were obtained in the coastal upwelling region (see Fig. 3). Interpolation between sampling points in contour plots was made with the Ocean Data View program (VG gridding algorithm, Schlitzer, 2004).
and with only the <50 ng C l−1h−1data set (n=77), the slope was 0.93±0.04 (figure not shown). In both cases, the Y in-tercept was not significantly different from 0. We felt thus confident in comparing our measurements of leucine rates to results obtained with other protocols (centrifugation with no BSA or filtration technique).
A factor of 1.5 kg C mol leucine−1was used to convert the incorporation of leucine to carbon equivalents, assuming no isotopic dilution (Kirchman, 1993). Indeed, isotopic dilution ranged from 1.04 to 1.18 as determined on four occasions on concentration kinetics. Errors associated with the variability between replicate measurements (half the difference between the two replicates) averaged 13% and 6% for BP values less and more than 10 ng C l−1h−1, respectively.
2.4 Particulate primary production
Primary production was determined: (1) by 24 h-in situ in-cubations according to the experimental protocol detailed in Moutin and Raimbault (2002), and (2) by short-term (<5 h) on-deck incubations using incubators equipped with Nickel screens (50, 25, 15, 7, 3 and 1% of incident irradiance) (Duhamel et al., 2006). Rates of daily particulate primary production were obtained using two incubation methods: (i) in situ moored lines immerged during 24 h, and in that case daily rates were directly measured (PPinsitu)and (ii) using the
conversion factors τ(T i;T ) according to Moutin et al. (1999)
to calculate normalized (dawn-to-dawn) daily rates from the hourly rates measured in the on-deck incubators (PPdeck).
The conversion factors were calculated based on incident ir-radiance measured aboard.
2.5 Gross community production, dark community respira-tion and net community producrespira-tion
Rates of gross community production (GCP), dark commu-nity respiration (DCR) and net commucommu-nity respiration (NCP) were estimated from changes in the dissolved oxygen (O2)
concentration during light/dark incubations of unfiltered sea-water (24 h) carried out in situ on moored lines. Seasea-water was collected at six depths in the euphotic zone and trans-ferred to 9-l polycarbonate bottles. The biological oxygen demand (BOD) bottles (125 ml) were filled by siphoning, us-ing silicon tubus-ing. For DCR, the BOD bottles were placed in black bags. All BOD bottles (quadruplicate in the dark, quadruplicate in the light at each layer) were incubated in situ at the respective depth layers under natural irradiance levels from dusk to dusk using the same mooring line as for PPinsitu. The concentration of oxygen was determined
by Winkler titration of whole bottles. Titration was done with an automated potentiometric end-point detection sys-tem (Metrohm DMS 716), following the recommendations of Carignan et al. (1998). DCR and NCP were calculated as the difference between initial and final O2concentrations
in dark and light bottles, respectively. GCP was calculated as the difference between NCP and DCR. On two occasions (St 3 5 m, 125 m), respiration rates were also determined on filtered (0.8 µm) water samples.
2.6 Bacterial growth efficiency
The bacterial growth efficiency (BGE) was calculated from BP and DCR, assuming that bacterial respiration represented a constant proportion (f ) of DCR, and applying a respiratory quotient (RQ) to convert O2−based measurements to carbon
units:
BGE = BP / (BP + (f × RQ ×DCR))
The choices of RQ and f are developed in the results sec-tion. The BGE were estimated from data of daily BP and DCR integrated over the euphotic zone. Vertical profiles for both parameters are available at the long stations MAR, HNL, GYR, UPW and UPX, where moored lines were de-ployed for 24 h in situ.
3 Results
3.1 Horizontal and vertical variation of bacterial produc-tion
Bacterial abundances (0.8–20.7×10⁵cells ml−1) and leucine incorporation rates (0.34–400 pmol leu l−1h−1) varied over a large range across the 8000 km of the BIOSOPE transect (Fig. 2) and both variables were strongly correlated (rela-tion log–log, n=249, r=0.85, p<0.001) . The gradients of
d e p th (m) d e p th (m) d e p th (m) température (°C) SIGMA Theta T Chla (mg m-3) primary production (mgC m-3d-1) bacterial abundance (x 105cells ml-1)
leu incorporation rate (pmol l-1h-1) MAR 0 50 100 150 200 20 21 22 23 24 25 26 10 15 20 25 30 SIG T 0 50 100 150 200 0 25 50 75 100 0 0.5 1 leu BA UPW 0 50 100 150 200 23 24 25 26 27 28 29 10 15 20 25 30 0 50 100 150 200 0 100 200 300 0 0.5 1 1.5 2 2.5 GYR 0 50 100 150 200 250 300 23 24 25 26 27 28 29 10 15 20 25 30 0 50 100 150 200 250 300 0 10 20 30 40 50 0 0.5 1 0 50 100 150 200 0 25 50 0 0.5 1 PP Tchla 0 50 100 150 200 0 10 20 30 40 50 0 0.5 1 1.5 2 2.5 0 50 100 150 200 250 300 0 1 2 3 4 0.0 0.5 1.0 0 50 100 150 200 250 0 10 20 30 40 50 0 0.5 1 0 50 100 150 200 250 300 0 1 2 3 4 0.0 0.5 1.0 EGY 0 50 100 150 200 250 23 24 25 26 27 28 29 10 15 20 25 30
Fig. 3. Vertical distributions of temperature, sigma theta (upper panel), bacterial abundance, leucine incorporation rates (middle panel), Tchla, primary production (PPdeck, see methods, lower panel), at stations mesotrophic MAR (26 October), hyperoligotrophic GYR (12 November), oligotrophic EGYR (26 November), and eutrophic UPW (7 December). All variables are from the 09:00 CTD cast, except for bacterial abundance (the following 12:00 CTD cast).
bacterial abundances and leucine incorporation rates were particularly pronounced off Chile. Highest leucine incor-poration rates were obtained in the coastal upwelling area (250 pmol l−1h−1at UPW at 35 m, Fig. 3; 400 pmol l−1h−1 at UPX at 15 m, data not shown) and in the northwest-ern zone of the transect, close to the Marquesas Islands (60 pmol l−1h−1at MAR at 10–50 m). Leucine
incorpora-tion rates were substantially lower between STB6 to STB15
representing the gyre stations (maximum 15 pmol l−1h−1). A similar pattern was detectable for chlorophyll (Ras et al., 2007) and concentrations of inorganic nutrients (Raimbault et al., 2007).
At the mesotrophic site MAR, sea surface temperature was 27.5◦C and the mixed layer reached 70 m (Fig. 3). Leucine incorporation rates were highest between 10 and 50 m (59±8 pmol l−1h−1) coinciding with the layer of
d e p th ( m)
specific leu rate (x10-21 mol cell-1 h-1)
st 5 - st 15 0 100 200 300 0 40 80 MAR - st 4 0 100 200 300 0 40 80 st 16 - UPX 0 100 200 300 0 40 80 120 160 200
Fig. 4. Vertical distribution of specific leucine incorporation rates (×10−21mol leucine cell−1h−1). Bacterial abundance and leucine incorporation rates were measured on water samples coming from the same CTD cast. MAR-st 4: MAR 3, HNL1, STB1, 2, 3, 4; st5-st15: STB5, 6, 7, 8, 11, 12, 13, 14; st16-UPW: STB15, 17, 18, 19, 20, 21, UPW2, UPX1. All these casts were sampled at 09:00 local time.
maximum primary production (20 m, 13 µg C l−1d−1) and maximum TChla (50 m, 0.4 µg l−1). At the eutrophic site UPW, characterized by a shallow mixed layer (20 m) and relatively low surface water temperature (15.9◦C), the maximum rates of leucine incorporation (250 pmol l−1h−1) and primary production (50 µg C l−1d−1)were higher than those at the MAR site. Maximum leucine incorporation coincided with a narrow, high TChla peak (2.6 µg l−1) at 35 m depth (Fig. 3). At the hyperoligotrophic GYR site, leucine incorporation was homogenous (mean ±SD: 9.3±1.9 pmol l−1h−1) down to 120 m depth, similarly to
primary production (0.9±0.3 µg C l−1d−1 between 20 and 160 m). Below 120 m, leucine incorporation progressively decreased to 1.4 pmol l−1h−1at 250 m depth. No clear asso-ciation with the deep, very small peak of TChla (0.16 µg l−1)
at 185 m depth was detectable at this site. At the oligotrophic site EGY, leucine incorporation rates were still very low, but exhibited a subsurface maximum around 40 m, coinciding with a peak of primary production around 3 µg C l−1d−1.
In contrast to bulk leucine incorporation rates, cell-specific leucine incorporation rates varied within a rather narrow range (10–70×10−21mol cell−1h−1), except for the Chilean coast, where values reached up to 200×10−21mol cell−1h−1 (Fig. 4). From MAR to STB4, a sub-surface maximum was visible around 20-30 m with values ranging from 30 to 70×10−21mol cell−1h−1(Fig. 4). Within the gyre (stations
STB6 to STB15), specific leucine incorporation rates were rather constant down to the deep Tchla maximum at around 160 m (13–56×10−21mol cell−1h−1).
Bacterial production (BP) integrated over the euphotic zone (IBP) ranged from 43 to 392 mg C m−2d−1during the BIOSOPE cruise (Table 1). The large range of trophic conditions encountered is reflected by the integrated stocks of TChla in the euphotic zone ranging between 7 and 59 mg m−2 (Table 1) and the integrated fluxes of particu-late primary production (IPPdeck) varying between 76 and
1446 mg C m−2d−1 (Table 1). As for volumetric values,
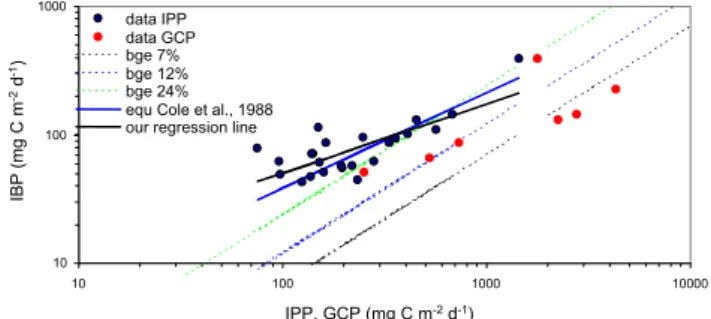
10 100 1000 10 100 1000 10000 IPP, GCP (mg C m-2d-1) IBP (mg C m -2 d -1) data IPP data GCP bge 7% bge 12% bge 24% equ Cole et al., 1988 our regression line
Fig. 5. Relation between bacterial production (IBP; y axis) and primary production (IPP, x axis), both expressed on an integrated basis for the euphotic zone (black dots). Relation between IBP and gross community production (GCP) are also indicated (red dots). Black line: regression line (Log IBP=0.542 Log IPP+0.615) for all our data set (n=24, r2=0.59, p<0.0001). Red line: regression line (Log IBP=0.746 Log IPP+0.093) from Cole et al. (1988) calculated for pelagic systems. We used ordinary least square regression for comparison purposes, and also for the reasons evoked in Teira et al. (2001). The three dotted lines are relying on a couple of IBP, IPP points such that BCD equals IPP, (BCD=IBP/BGE=IPP), with assumed BGEs values of (from left to the right) 7% (green), 12% (blue), 24% (black).
highest values of IBP were obtained in the upwelling region off Chile (226–392 mg C m−2d−1) corresponding roughly to the IBP obtained by Cuevas et al. (2004) – based on the thymidine technique – in the upwelling area off Concepcion in October 1999 (268–561 mg C m−2d−1 for their coastal station at 73◦W). At stations STB6 to STB15, encompass-ing the GYR sites, IBP was as low as 58±11 mg C m−2d−1
(mean ±SD). Similarly, IPPdeck revealed lowest values at
these stations (134±42 mg C m−2d−1). Stations MAR and
HNL, on the western part of the transect, presented inter-mediary values of IBP (86–140 mg C m−2d−1) and IPPdeck
(318–683 mg C m−2d−1). IPPinsitu, determined only on
a limited number of stations across the transect reflected the trend in IPPdeck (r=0.89, n=5) with higher values at
MAR and UPX (1146 and 1344 mg C m−2d−1, respectively) and lower values at GYR (154 mg C m−2d−1, Table 2). IPPinsituwas, on average, 1.3 fold higher than IPPdeck(range
0.92–1.67, n=5). There was a significant log-log relation-ship between IBP and IPPdeck when all data were pooled
(Log IBP=0.551 Log IPP+0.594, n=36, r2=0.59, p<0.0001) (Fig. 5). The ratio IBP to IPPdeck, however, was highly
vari-able, ranging from 0.19 to 1.04 (n=24) across the cruise tran-sect. For the GYR sites (STB 6 to STB15), the ratio IBP to IPPdeckwas, on average, 0.48±0.24, and it was lower on the
boundaries of the transect (for the eastern part, stations EGY to UPX: 0.24±0.05, for the western part, stations MAR to STB1: 0.25±0.03).
Gross community production (GCP) integrated in the eu-photic zone ranged from 29 to 505 mmol O2m−2d−1
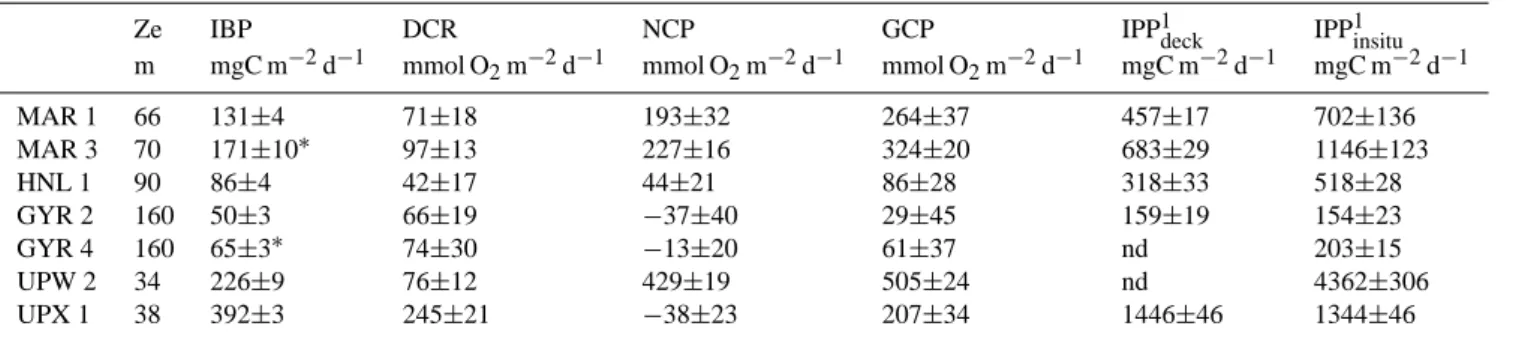
Table 2. Measured gross community production (GCP), dark community respiration (DCR), net community production (NCP),14C based particulate primary production (IPPdeckand IPPinsitu)at stations where all these parameters were available. Data are integrated over the euphotic zone (Ze). Errors correspond to water-column integrated standard deviations for GCP, DCR and NCP (quadruplicate incubations at each depth) and for IPPinsitu (triplicate samples at each depth). For IBP and IPPdeck errors represent water column integrated val-ues of the variability between duplicate measurements per depth. Note that the units vary according the variable (mmol O2m−2d−1and mgC m−2d−1).
Ze IBP DCR NCP GCP IPP1deck IPP1insitu
m mgC m−2d−1 mmol O2m−2d−1 mmol O2m−2d−1 mmol O2m−2d−1 mgC m−2d−1 mgC m−2d−1
MAR 1 66 131±4 71±18 193±32 264±37 457±17 702±136 MAR 3 70 171±10∗ 97±13 227±16 324±20 683±29 1146±123 HNL 1 90 86±4 42±17 44±21 86±28 318±33 518±28 GYR 2 160 50±3 66±19 −37±40 29±45 159±19 154±23 GYR 4 160 65±3∗ 74±30 −13±20 61±37 nd 203±15 UPW 2 34 226±9 76±12 429±19 505±24 nd 4362±306 UPX 1 38 392±3 245±21 −38±23 207±34 1446±46 1344±46 1IPP
deck: as in Table 1 (on-deck incubations), IPPinsitu: from 24 h in situ moored lines.
∗ The daily IBP were calculated cumulating data of different profiles measured every 3 h along a diel cycle (Van Wambeke et al.,
2008). In other cases, daily BP was calculated from the 09:00 CTD cast assuming daily rates = 24 times hourly rates.
Integrated net community production (NCP) was again high-est at the upwelling site UPW (429±19 mmol O2m−2d−1)
and at the stations close to the Marquesas islands (mean 210 mmol O2m−2d−1). Integrated fluxes of NCP were
neg-ative at UPX (−38±23 mmol O2m−2d−1) and were close
to balance at the GYR site (−13±20 mmol O2m−2d−1and
−37±40 mmol O2m−2d−1).
3.2 Dark community respiration and bacterial growth effi-ciency
Rates of dark community respiration (DCR) varied within a narrow range (42–97 mmol O2m−2d−1) except for the
high rates obtained at UPX (245 mmol O2m−2d−1).
Res-piration in 0.8 µm filtered seawater was determined only at station STB5. Respiration rates in the <0.8 µm size fraction and unfiltered seawater amounted to 0.62±0.22 and 0.52±0.25 µmol O2l−1d−1, respectively, at 5 m and to
0.46±0.12 and 0.58±0.24 µmol O2l−1d−1, respectively, at
125 m. Such comparison was made only in two occasions, and since it is risky to generalize these results, to determine the BCD we assume the following: (i) that heterotrophic bac-terial respiration accounts entirely for DCR (BGE100), (ii) or
that it represents half of it (BGE50, Table 3). For all
sta-tions considered, BGE100and BGE50ranged between 7 and
24% and between 14 and 38%, respectively. The applica-tion of respiratory quotients (RQ) reported in the literature (0.8–1.1; Robinson and Williams, 1999; Lefevre et al., in press) resulted in minor changes in the BGE for a given con-tribution of bacterial to community respiration (by 2 to 7%). Hence, the assumption on the fraction of DCR attributable to bacterial respiration has a greater impact on the
variabil-Table 3. Calculated bacterial growth efficiency (BGE), integrated gross community production (GCP, in carbon units), the ratio of IPPinsitu/GCP and BCD/GCP at stations where all the parameters were available. BGEs were calculated using the following formula: BGE=BP/(BR+BP), where BR (bacterial respiration) was assumed to be equal to DCR (BGE100)or half of it (BGE50). DCR and IBP data considered are those given in Table 2. BGEcorr: BGE100 corrected for exponential growth in the flask during incubation.
BGE1
50 BGE1100 BGE1corr GCP2 IPP/GCP3 BCD/GCP3
% % % mgC m−2d−1 ratio ratio MAR 1 22–28 12–16 21–27 2259–2876 0.16–0.31 0.16–0.47 MAR 3 21–27 12–16 20–26 2778–3536 0.19–0.41 0.18–0.52 HNL 1 24–30 13–17 23–29 738–939 0.34–0.7 0.31–0.87 GYR 2 10–14 5.4–7.4 10–13 252–320 0.48–0.63 1.2–3.7 GYR 4 12–15 6.2–8.3 11–15 525–669 0.30–0.39 0.63–2.0 UPW 2 31–38 18–24 30–37 4328–5509 0.22–1 0.11–0.29 UPX 1 20–25 10–14 19–24 1774–2258 0.6–0.81 0.69–2.0
1The range considers minimum – maximum values when applying Respiratory Quotients of 0.8 and 1.1.
2 The range considers minimum – maximum values when applying Photosynthetic Quotients of 1.1 and 1.4.
3The range considers minimum – maximum values obtained according the BGEs, RQ and PQ used.
ity of the BGE than the choice of the respiratory quotient (RQ). Considering both assumptions (i.e. different contribu-tions of bacterial to community respiration and RQs), the lowest BGEs were obtained at site GYR (5–15%), and BGEs increased in the upwelling area (UPW: 14–38%) and in the western part, at the MAR and HNL sites (12–28%, Table 3).
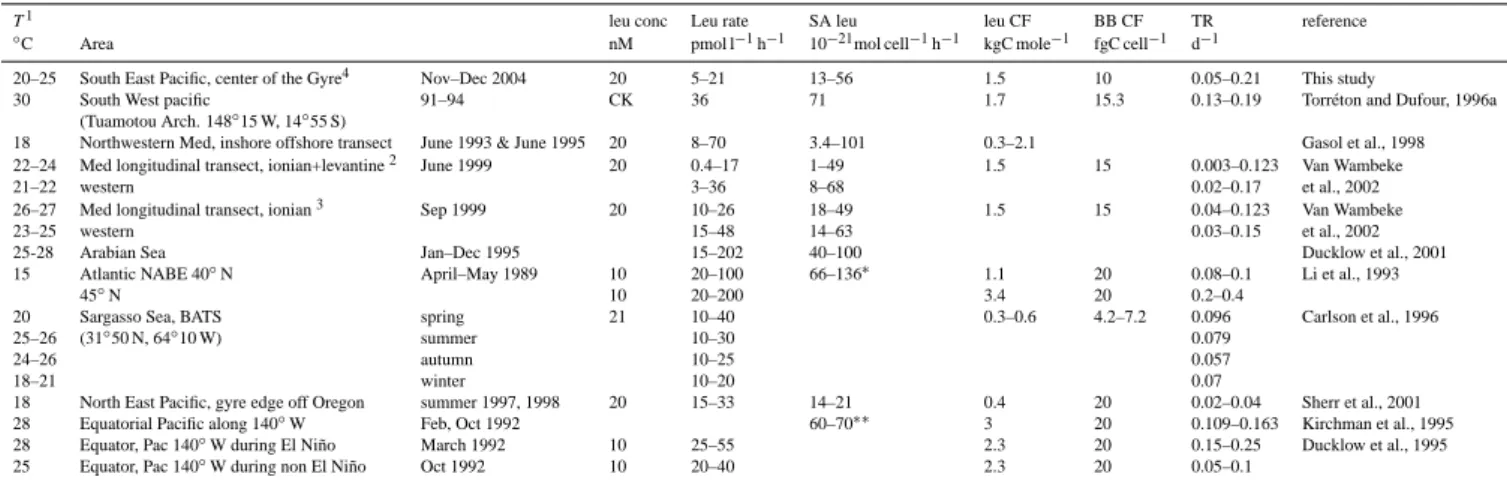
Table 4. Review of leucine incorporation rates, specific leucine incorporation rates (SA leu) and bacterial turnover rates (TR) in most olig-otrophic mid-latitudes to equatorial areas. Temperature (T ), conversion factors used to compute TR (leu CF), bacterial biomass conversion factor (BB CF) and Leucine concentration used are also indicated. Empty case: data not available. CK: concentration kinetic.
T1 leu conc Leu rate SA leu leu CF BB CF TR reference
◦
C Area nM pmol l−1h−1 10−21mol cell−1h−1 kgC mole−1 fgC cell−1 d−1
20–25 South East Pacific, center of the Gyre4 Nov–Dec 2004 20 5–21 13–56 1.5 10 0.05–0.21 This study
30 South West pacific 91–94 CK 36 71 1.7 15.3 0.13–0.19 Torr´eton and Dufour, 1996a
(Tuamotou Arch. 148◦15 W, 14◦55 S)
18 Northwestern Med, inshore offshore transect June 1993 & June 1995 20 8–70 3.4–101 0.3–2.1 Gasol et al., 1998
22–24 Med longitudinal transect, ionian+levantine2 June 1999 20 0.4–17 1–49 1.5 15 0.003–0.123 Van Wambeke
21–22 western 3–36 8–68 0.02–0.17 et al., 2002
26–27 Med longitudinal transect, ionian3 Sep 1999 20 10–26 18–49 1.5 15 0.04–0.123 Van Wambeke
23–25 western 15–48 14–63 0.03–0.15 et al., 2002
25-28 Arabian Sea Jan–Dec 1995 15–202 40–100 Ducklow et al., 2001
15 Atlantic NABE 40◦N April–May 1989 10 20–100 66–136∗ 1.1 20 0.08–0.1 Li et al., 1993
45◦N 10 20–200 3.4 20 0.2–0.4
20 Sargasso Sea, BATS spring 21 10–40 0.3–0.6 4.2–7.2 0.096 Carlson et al., 1996
25–26 (31◦50 N, 64◦10 W) summer 10–30 0.079
24–26 autumn 10–25 0.057
18–21 winter 10–20 0.07
18 North East Pacific, gyre edge off Oregon summer 1997, 1998 20 15–33 14–21 0.4 20 0.02–0.04 Sherr et al., 2001
28 Equatorial Pacific along 140◦W Feb, Oct 1992 60–70∗∗ 3 20 0.109–0.163 Kirchman et al., 1995
28 Equator, Pac 140◦W during El Ni˜no March 1992 10 25–55 2.3 20 0.15–0.25 Ducklow et al., 1995
25 Equator, Pac 140◦W during non El Ni˜no Oct 1992 10 20–40 2.3 20 0.05–0.1
1Only surface temperatures are indicated when stratification is important,2values from profiles down to depth of TChla maximum,3values from surface layers,4for our study, values have been indicated for stations 5 to 14 within euphotic layer (down to Ze),∗from related reference Ducklow et al. (1992),∗∗from related reference Kirchman et al. (2005).
Keeping an average BGE of 7% as an estimate for the more oligotrophic sites, the ratio of the integrated bacterial carbon demand (BCD) to14C-Primary production (IPPdeck, given in
Table 1) in the gyre would range between 3.7 (STB15) and 14 (STB7) (median for stations STB6 to STB15: 5.7, n=9).
The calculation of the BGE is commonly based on bac-terial heterotrophic production determined prior to the 24 h incubation. During the size fractionation experiment at sta-tion STB3 as well as during bioassay experiments (Van Wambeke et al., 2007), we observed, however, an increase in bacterial heterotrophic production during the 24 h incuba-tion period (median factor of increase ×3.2, n=9, STB6 to STB15, Van Wambeke et al., 2007). Such increases during DCR measurements were reported previously (Pomeroy et al., 1994). Estimates of the BGE can be corrected from this bias by assuming an exponential increase in bacterial produc-tion during the 24 h as follows: (BP24−BP0)/(Ln (BP24)−Ln
(BP0)). Applying this correction, BGEs at the GYR sites
range from 10 to 15% (Table 3). Consequently, the average BGE of 7% given above for the hyper-oligotrophic sites in-creases to 12%, resulting in a decrease in the range of the ratio BCD/IPP to 2.1–8.6 (median 3.3 for stations STB6 to STB15, n=9).
4 Discussion
The South Pacific Gyre is probably the most oligotrophic water body of the global ocean, a description that is up to date mainly based on satellite observations (Claustre and Maritonera, 2003). Several parameters determined
dur-ing the BIOSOPE-cruise (Claustre et al., 2008), such as water tranparency (Morel et al., 2007) and phytoplankton biomass (7 mg TChla m−2 in the euphotic zone, Table 1, Ras et al., 2007) confirm the hyperoligotrophic charac-ter of this area. One question that we addressed in the present study was whether bacterial production rates are also the lowest reported for open seas and oligotrophic ar-eas. For surface layers, most reported rates of leucine incorporation in oligotrophic areas do not decrease be-low a threshold of ∼10 pmol l−1h−1 (Table 4). Lower leucine incorporation rates were measured in the eastern Mediterranean Sea (Levantine and Ionian Sea, range 0.4– 17, mean 6.6±4.9 pmol l−1h−1, Table 4), and in our study between STB6 and STB15 (range 5–21 pmol l−1h−1, mean 10.8±2.9 pmol l−1h−1). Both cases correspond to marine environments where the depth of the deep TChla maximum exceeds 150 m. Bacterial abundance varies less than bac-terial heterotrophic production, thus the lowest cell-specific activities are again obtained for the Levantine Basin in the Mediterranean Sea (1–49×10−21mol cell−1 h−1), and cell
specific activities were in the same order of magnitude (10– 60×10−21mol cell−1h−1)in the centre of the South Pacific Gyre, the western Mediterranean Sea, or the equatorial Pa-cific Ocean (Table 4).
The bacterial community turnover rate (the ratio of bacte-rial production (BP) to bactebacte-rial biomass (BB) allows a com-parison among studies independent of the technique (leucine or thymidine incorporation) used, but it requires the appli-cation of conversion factors for bacterial biomass and pro-duction. In the present study, we used 1.5 kg C per mol leucine incorporated, assuming no isotopic dilution, and
a low carbon per cell conversion factor specific for olig-otrophic environments (10 fg C per cell, Christian and Karl, 1994; Fukuda et al., 1998). The application of these conver-sion factors allowed us to compare our bacterial community turnover rates (0.05–0.21 d−1, Table 4, mean 0.11±0.03 d−1,
n=63) with many previous studies that used 3.1 kgC per mol leucine and 20 fg C per cell (Li et al., 1993; Kirchman et al., 1995). Lowest bacterial community turnover rates are still obtained for the eastern Mediterranean Sea (0.003–0.123 d−1 based on leucine incorporation, Table 4 and 0.005–0.11 d−1 based on thymidine incorporation, Robarts et al., 1996). In the tropical, subtropical and temperate Pacific and At-lantic Oceans, a bacterial community turnover rate of 0.02– 0.04 d−1(Table 4) appears to be a minimum threshold based on theoretical leucine-carbon conversion factors. However, a recent investigation of empirical conversion factors along a coast-offshore transect in the Atlantic (Alonso-Saez et al., 2007) suggests a bias related to the high respiration of leucine (60–80%), in off shore stations leading to very low conver-sion factors (0.02–0.36 kg C mol leu−1). Applying the mean of their empirical conversion factors (0.17 kg C mol leu−1, Alonso-Saez et al., 2007) to our data set, bacterial turnover rates would range between 0.005 and 0.02 d−1in the South Pacific Gyre. Based on microautoradiographic observations, the fraction of bacteria taking up leucine was determined to account for 19 to 33% of the bacterioplankton cells in sur-face waters in the gyre (Obernosterer et al., 2007). Assuming that this fraction represents the active bacterioplankton com-munity, the turnover rate of the active population would be four-fold higher than any estimate based on the total counts. Considering all these assumptions, would lead to a possibly very large range of bacterial community growth rates, vary-ing between 0.005 d−1(0.17 kg C per mole, no correction for
the active fraction) to 0.8 d−1(1.5 kg C per mole, 25% of the bacteria active).
The fact that the bacterial community turnover rate is of-ten low compared to that of phytoplankton is presently sub-ject of debate (Duhamel et al., 2007 and references therein). Alternative techniques based on the turnover of a particular chemical pool or a cell compound were recently proposed to estimate turnover rates of heterotrophic bacterial cells. The turnover rate of the phosphate (P) pool in different size fractions, for instance, was examined during the BIOSOPE cruise (Duhamel et al., 2007). Based on the hypothesis that detrital particulate P is negligible, and assuming that the P assimilation rates and the P biomass in the <0.6 µm fraction are mainly related to heterotrophic prokaryotes, these authors found a bacterial P-based turnover time of 0.11±0.07 d−1
in the gyre. This value compares well with the mean bac-terial turnover rate that we obtained in the centre of the gyre using theoretical conversion factors. Unexpected high turnover rates of bacteriochlorophyll-a were reported for the Atlantic (0.7–1.1 d−1in gyres centers, Koblizek et al., 2007). This pigment is characteristic for aerobic anoxygenic pho-totrophic bacteria, which were also abundant in the South
Pacific Gyre (Lami et al., 2007) at the time of the cruise. Such turnover rates derived from the analysis of a given chemical pool, if representative for cell turnover (Koblizek et al., 2007), further suggest that some components of the heterotrophic (including mixotrophs) bacterioplankton might have higher turnover rates than the whole consortium.
Our measurements of bacterial production, though among the lowest reported for the open ocean – excluding high lat-itude, cold waters – clearly do not represent minimum val-ues. If bacterial activity is similar among open ocean olig-otrophic environments, is this also the case for primary pro-duction? A comparison among studies is not simple due to differences in the incubation conditions. Our IPPdeck values
were generally lower than those obtained by “standard” in situ incubations (IPPinsitu, Table 2). It is well known that it is
difficult to reproduce natural irradiance conditions on board and thus, for the comparison with IPP from other studies, we will only refer to primary production determined from the in situ moored lines. It appears that considerably higher rates of IPPinsitu were obtained in the North Pacific Gyre
at ALOHA (200–900 mg C m−2d−1, Karl et al., 2001), and in the Sargasso Sea at BATS (312–520 mg C m−2d−1 and 340–530 mg C m−2d−1, Steinberg et al., 2001 and Mourino-Carballido and McGillicuddy, 2006, respectively) as com-pared to the measurements of IPPinsitu in the centre of the
South Pacific Gyre (154–203 mg C m−2d−1). These previ-ous estimates were derived from in situ dawn to dusk incu-bations, whereas our results are from 24 h incubations. As previously reported for the eastern Mediterranean Sea, an in-tegrated primary production of about 150 mg C m−2d−1may appear as a lower limit for primary production rates estimated by 24 h in situ incubations under strong oligotrophic condi-tions (Moutin and Raimbault, 2002). Thus the rates of pri-mary production determined in the centre of the south Pacific gyre appear to be among the lowest reported.
We explored the phytoplankton-bacteria coupling by com-paring the bacterial carbon demand (BCD) to primary pro-duction (IPP) and gross community propro-duction (GCP). These comparisons are often used to determine the potential fate of primary production through the microbial food web, but they often represent also the basis for defining the metabolic bal-ance, presently a subject of debate (del Giorgio et al., 1997; Kirchman, 1997; del Giorgio and Duarte, 2002; Williams, 2004; Mc Andrew et al., 2007; Claustre et al., 2007a). We paid particular attention to the methodological biases related to these different estimates.
As suggested previously (Ducklow et al., 2000), we as-sumed linearity when converting bacterial heterotrophic pro-duction from hourly to daily rates. Taking into account the diurnal variability of BP we observed at selected stations (Van Wambeke et al., 2008), real daily rates were, on av-erage, by 18% higher than those calculated from one single measurement made at 09:00 a.m. and assuming linearity over 24 h. The error introduced by not taking into account the di-urnal variability is in the same order as the precision of the
bacterial production measurement in oligotrophic areas (13% for BP values lower than 10 ng C l−1h−1, see methods).
Considering all these biases (e.g. diurnal variability in BP, BGE estimates), BCD could exceed 14C based IPP in the gyre by factors varying between 2 to 8 (median 3.3, n=9). This is illustrated in Fig. 5 where most of our data points (IBP, IPP) are on the left side of the theoretical lines cor-responding to situations where BCD equals IPP (Fig. 5), in particular with an assumed BGE of 7% and 12%. Two as-pects should be considered about these results: first, BCD exceeded IPP at all stations, and second, a large variabil-ity of this ratio was obtained. Particulate PP based on14C measurements accounts for about 40–50% of gross photo-synthesis (Karl et al., 1998; Moutin et al., 1999; Bender et al., 1999). In the present study, the ratio IPP/GCP (including the whole set of IPPdeckand IPPinsituas given in Table 2) was
0.47±0.25 (mean ±SD) (Table 3), which confirms previous studies. Thus, the question arises how adequate the compar-ison between the BCD and14C-particulate primary produc-tion is? The present data set allowed us to compare the BCD to GCP, indicating that the ratio BCD/GCP is <1 or close to 1 (Table 3). Even in the centre of the gyre the two fluxes were close to balance. The same conclusion can be drawn from the fluxes of NCP (Table 2).
Processes like DOC production (by excretion, lysis, graz-ing processes) and respiratory losses are the main contribu-tors to the difference between GCP and particulate PP. Esti-mates on the percent of primary production released as DOC vary largely among studies. Although some studies report a percentage of excretion constant across trophic gradients (Maranon et al., 2005); both laboratory (Myklestadt, 1995; Obernosterer and Herndl, 1995) and field studies (Teira et al., 2001; Moran et al., 2002; Fern´andez et al., 2004), indi-cate an increase of the percent of primary production released as DOC in nutrient-limited environments. In the South Pa-cific Gyre primary production was strongly limited by nitro-gen (Bonnet et al., 2007). We attempted to estimate DOC excretion by using empirical equations on DOC production and particulate primary production obtained in field studies (Baines and Pace, 1991; Moran et al., 2001; Teira et al., 2001; Moran et al., 2002). This approach is, however, limited because the rates of primary production analyzed are higher than those encountered in the South Pacific Ocean. Applying on our data set relationships which were obtained in olig-otrophic conditions as close as possible as ours: southern Ocean – NE Atlantic (Moran et al., 2002) or NW Iberian coastal transition zone (Teira et al., 2001), the percentage of extracellular release would vary between 20%±6% and 58%±11% (n=63) in the South Pacific Gyre, respectively. This approach does not take into account the amount of DOC released that is respired by bacteria during the incubation pe-riod. This fraction is likely to be high given the low BGEs in oligotrophic environments. This suggests potentially high percentages of DOC production rates in the South Pacific Gyre.
A marked diurnal pattern in bacterial production deter-mined from high-frequency sampling at three stations (MAR, GYR and EGY) was observed (Van Wambeke, 2008). Bacte-rial production was highest around midnight, decreased until the early afternoon, and then rapidly increased again. This pattern reflects an adjustment of heterotrophic bacterial pro-duction to in situ primary propro-duction and DOC propro-duction. Heterotrophic bacterial production is likely to be delayed by a few hours from that of phytoplankton due to inhibition by UV radiation around noon. Apart from this short time-lag, these results suggest a strong coupling between primary pro-duction and heterotrophic bacterial propro-duction.
The variability in the ratio BCD/IPP observed in the present study is more driven by the variability in IPP than by the variability in IBP (percentage of variation 32% for IPPdeck data, versus 19% for IBP data at stations 6 to 15
considered as oligotrophic, Table 1). The strong variabil-ity in IPP was not related to the position of the station only. At station GYR, IPPdeck and GCP varied both
con-siderably during our visit, and this variability was linked to surface irradiance (Claustre et al., 2007). Day-to-day fluc-tuations of primary production and thus variability in the ra-tio of BCD/IPP are also reported from a Lagrangian exper-iment (Ducklow, 1999). Larger variability in primary pro-duction as compared to respiration was also observed dur-ing a one year study at station ALOHA (Williams et al., 2004). The lack of synchronicity between PP and BP has been proposed as an explanation for punctual high BCD/IPP ratios (Kirchman, 1997). Our results appear to support the hypothesis that short-term variability in PP frequently oc-curs, but that it is rarely determined due to the time scale on which oceanographic cruises are taking place (Williams et al., 2004). Indeed, rapid (<1 week) bursts of net autotro-phy, decoupled from respiration, could appear as a conse-quence of mesoscale physical processes, as shown by re-cent investigation on the effects of deep-sea water enrich-ment in nutrient-limited surface waters of the North Pacific subtropical Gyre (Mc Andrew et al., 2007). During the BIOSOPE-cruise the balance between autotrophic and het-erotrophic processes was also determined applying an opti-cally based method to determine gross primary production (Claustre et al., 2007). These authors conclude that the South Pacific Gyre is in metabolic balance. Observations based on alternative techniques and higher frequency (Emerson et al., 2002) are probably required to provide valuable insights into the temporal variability of autotrophic and heterotrophic pro-cesses in the open ocean.
Acknowledgements. The authors thanks the crew of the R.V. Atalante for their help during the cruise, A. Sciandra for his leadership during the second leg., C. Bournot, D. Taillez and D. Merien for CTD operations, C. Grob and G. Alarc´on for the analysis of bacterioplankton by flow cytometry, and P. Catala for GCP and DCR measurements during Leg 2. Two anonymous reviewers improved the manuscript through their criticism and are also acknowledged. OU was funded by the Chilean National
Commission for Scientific and Technological Research through the FONDAP program (grant 15010007) and the Millenium Scientific Initiave (grant EBMA P04/007). This research was founded by the French program PROOF (Processus Biogeochimiques dans l’Oc´ean et Flux), Centre National de la Recherche Scientifique (CNRS), the Institut National des Sciences de l’Univers (INSU). This is a contribution to the BIOSOPE project of the LEFE CYBER program.
Edited by: T. J. Battin
References
Alonso-Saez, L., Gasol, J. M., Aristegui, J., Vilas, J. C., Vaque, D., Duarte, C. M., and Agusti, S.: Large scale variability in surface bacterial carbon demand and growth efficiency in the subtropi-cal northeast Atlantic Ocean, Limnol. Oceanogr., 52, 533–546, 2007.
Baines, S. B. and Pace, M. L.: The production of dissolved organic matter by phytoplankton and its importance to bacteria: Patterns across marine and freshwater systems, Limnol. Oceanogr., 36, 1078–1090, 1991.
Bender, M. L., Orchardo, J., Dickson, M. L., Barber, R., and Lind-ley, S.: In vitro O2 fluxes compared with14C production and other rate terms during the JGOFS Equatorial Pacific experiment, Deep-Sea Res. Pt. I, 46, 637–654, 1999.
Carignan, R., Blais, A.-M., and Vis, C.: Measurement of primary production and community respiration in oligotrophic lakes us-ing the Winkler method, Can. J. Fish. Aquat. Sci., 55, 1078– 1084, 1998.
Carlson, C. A., Ducklow, H. W., and Sleeter, T. D.: Stocks and dynamics of bacterioplankton in the northwestern Sargasso Sea, Deep-Sea Res. Pt. II, 43, 491–515, 1996.
Christian, J. R. and Karl, D. M.: Microbial community structure at the U.S.-Joint Global Ocean flux Study Station ALOHA: Inverse methods for estimating biochemical indicator ratios, J. Geophys. Res., 99(C7), 14 269–14 276, 1994.
Claustre, H., Huot, Y., Obernosterer, I., Gentili, B., Taillez, D., and Lewis, M.: Gross community production and metabolic bal-ance in the south Pacific Gyre using a non intrusive bio-optical method, Biogeosciences Discuss., 4, 3089–3121, 2007, http://www.biogeosciences-discuss.net/4/3089/2007/.
Claustre, H. and Maritonera, S.: The many shades of ocean blue, Science, 302, 1514–1515, 2003.
Claustre, H., Sciandra, A., Vaulot, D., and Raimbault, P.: Intro-duction to the special section: bio-optical and biogeochemical conditions in the South East Pacific in late 2004 – the BIOSOPE program, Biogeosciences Discuss., in press, 2008.
Cole, J. J., Findlay, S., and Pace, M. L.:Bacterial production in fresh and saltwater ecosystems : a cross-system overview, Mar. Ecol.-Prog. Ser., 43, 1–10, 1988.
Cuevas, L. A., Daneri, G., Jacob, B., and Montero, P.: Microbial abundance and activity in the seasonal upwelling area off Con-cepci´on (36◦S), central Chile: a comparison of upwelling and non-upwelling conditions, Deep-Sea Res. Pt. II, 51, 2427–2440, 2004.
Del Giorgio, P. A. and Duarte, C. M.: Respiration in the open ocean, Nature, 420, 379–384, 2002.
Ducklow, H. W., Kirchman, D. L., and Quinby, H. L.: Bacterio-plankton cell growth and macromolecular synthesis in sewater cultures during the North Atlantic spring phytoplankton bloom, May, 1989, Microb. Ecol., 24, 125–144, 1992.
Ducklow, H. W., Quinby, H. L., and Carlson, C. A.: Bacterioplank-ton dynamics in the equatorial Pacific during the 1992 El Nino, Deep-Sea Res. Pt. II, 42, 621–638, 1995.
Ducklow, H. W.: The bacterial component of the oceanic euphotic zone, FEMS, Microb. Ecol., 30, 1–10, 1999.
Ducklow, W. H.: Bacterial production and biomass in the oceans, in: Microbial Ecology of the Oceans, edited by: Kirchman, D. L., Wiley-Liss, New York, 85–120, 2000.
Ducklow, H. W., Smith, D. C., Campbell, L., Landry, M. R., Quinby, H. L., Steward, G. F., and Azam, F.: Heterotrophic bac-terioplankton in the Arabian Sea: Basinwide response to year-round high primary productivity, Deep-Sea Res. Pt. II, 48, 1303– 1323, 2001.
Ducklow, H. W., Kirchman, D. L., and Anderson, T. R.: The magni-tude of spring bacterial production in the North Atlantic Ocean, Limnol. Oceanogr., 47, 1684–1693, 2002.
Ducklow, H. W., Dickson, M. L., Kirchman, D. L., Steward, G., Orchardo, J., Marra, J., and Azam, F.: Constraining bacterial production, conversion efficiency and respiration in the Ross Sea, Antarctica, January–February, 1997, Deep-Sea Res. Pt. II, 47, 32 227–33 247, 2000.
Duhamel, S., Zeman, F., and Moutin, T.: A dual-labelling method for the simultaneous measurement of dissolved inorganic car-bon and phosphate uptake by marine planktonic species, Limnol. Oceanogr.-Meth., 4, 416–425, 2006.
Duhamel, S., Moutin, T., Van Wambeke, F., Van Mooy, B., Rim-melin, P., Raimbault, P. and Claustre, H.: Growth and specific P-uptake rates of bacterial and phytoplanktonic communities in the Southeast Pacific (BIOSOPE cruise), Biogeosciences, 4, 941– 956, 2007,
http://www.biogeosciences.net/4/941/2007/.
Emerson, S., Stump, C., Johnson, B., and Karl, D..: In situ deter-mination of oxygen and nitrogen dynamics in the upper ocean, Deep-Sea Res. Pt. I, 49, 941–952, 2002.
Fern´andez, M., Bianchi, M., and Van Wambeke, F.: Bacterial biomass, heterotrophic production and utilization of dissolved organic matter photosynthetically produced in the Almeria-Oran front, J. Marine Syst., 5, 313–325, 1994.
Fukuda, R., Ogawa, H., Nagata, T., and Koike, I.: Direct determina-tion of carbon and nitrogen contents of natural bacterial assem-blages in marine environments, Appl. Environ. Microbiol., 64, 3352–3358, 1998.
Gasol, J. M., Doval, M. D., Pinhassi, J., Calderon-Paz, J. I., Guixa-Boixareu, N., Vaqu´e, D., and Pedros-Alio, C.: Diel variations in bacterial heterotrophic activity and growth in the northwestern Mediterranean Sea, Mar. Ecol.-Prog. Ser., 164, 107–124, 1998. Gran´eli, W., Carlsson, P., and Bertilsson, S.: Bacterial abundance,
production and organic carbon limitation in the Southern Ocean (39–62◦S, 4–14◦E) during the austral summer 1997/1998, Deep Sea Res. Pt. II, 51, 2569–2582, 2004.
Grob, C., Ulloa, O., Claustre, H., Huot, Y., Alarcon, G., and Marie, D.: Contribution of picoplankton to the total particulate organic carbon concentration in the eastern South Pacific, Bio-geosciences, 4, 837–852, 2007,
Karl, D. M., Hebel, D. V., and Bjorkman, K.: The role of dissolved organic mater release in the productivity of oligotrophic North Pacific Ocean, Limnol. Oceanogr., 13, 1270–1286, 1998. Karl, D. M., Bidigare, R. R., and Letelier, R. M.: Long-term
changes in plankton community structure and productivity in the North Pacific Subtropical Gyre: The domain shift hypothesis, Deep-Sea Res. Pt. II, 48, 1449–1470, 2001.
Kirchman, D. L.: Leucine incorporation as a measure of biomass production by heterotrophic bacteria, in: Handbook of methods in aquatic microbial ecology, edited by: Kemp, P. F., Sherr, B. F., Sherr, E. B., and Cole, J. J., Boca Raton: Lewis, 509–512, 1993. Kirchman, D. L.: Microbial breathing lessons, Nature, 385, 121–
122, 1997.
Kirchman, D. L., Rich, J. H., and Barber, R. T.: Biomass and biomass production of heterotrophic bacteria along 140◦W in the Equatorial Pacific : Effect of temperature on the microbial loop, Deep-Sea Res. Pt. II, 42, 603–619, 1995.
Kirchman, D. L., Malmstrom, R. R., and Cottrell, M. T.: Control of bacterial growth by temperature and organic matter in the West-ern Arctic, Deep-Sea Res. Pt. II, 52, 3386–3395, 2005.
Kobl´ıˇzek, M., Masin, M., Ras, J., Poulton, A. J., and Prasil, O.: Rapid growth of aerobic anoxygenic phototrophs in the oceans, Environ. Microbiol., 9, 2401–2406, 2007.
Lami, F., Cottrell, M., Ras, J., Ulloa, O., Obernosterer, I., Claustre, H., Kirchman, D., and Lebaron, P.: High abundances of aerobic anoxygenic photosynthetic bacteria in the South Pacific ocean, Appl. Environ. Microbiol., 73, 4198–4205, 2007.
Landry, M. R. and Kirchman, D. L.: Microbial community structure and variability in the tropical Pacific, Deep-Sea Res. Pt. II, 49, 2669–2693, 2002.
Lefevre, D., Guigue, C., and Obernosterer, I.: The metabolic bal-ance during a phytoplankton bloom induced by natural iron fer-tilization in the Southern Ocean (Kerguelen Plateau), Deep Sea Res. Pt. II, in press, 2008.
Li, W. K. W., Dickie, P. M., Harrisson, W. C., and Irwin, B. D.: Biomass and production of bacteria and phytoplankton dudring the spring bloom in the western north Atlantic Ocean, Deep-Sea Res. Pt. II, 40, 303–327, 1993.
Maranon, E., Cermeno, P., and Perez, V.: Continuity in the photo-synthetic production of dissolved organic carbon from eutrophic to oligotrophic waters, Mar. Ecol.-Prog. Ser., 299, 7–17, 2005. McAndrew, P., Bjorkman, K., Church, M., Morris, P., Jachowski,
N., Williams, P. J. Le B., and Karl, D.: Metabolic response of oligotrophic plankton communities to deep water nutrient enrich-ment, Mar. Ecol.-Prog. Ser., 332, 63–75, 2007.
Moran, X. A. G., Estrada, M., Gasol, J. M., and Pedros-Alio, C.: Dissolved primary production and the strength of phytoplankton-bacterioplankton coupling in contrasting marine regions, Micro-bial Ecol., 44, 217–223, 2002.
Moran, X. A., Gasol, J., Pedros-Alio, C., and Estrada, M.: Dis-solved and particulate primary production and bacterial produc-tion in offshore Antarctic waters during austral summer: coupled or uncoupled?, Mar. Ecol.-Prog. Ser, 222, 25–39, 2001. Morel, A., Gentili, B., Claustre, H., Babin, M., Bricaud, A., Ras,
J., and Tieche, F.: Optical properties of the “clearest” natural waters, Limnol. Oceanogr., 52, 217–229, 2007.
Mourino-Carballido, B. and McGillicuddy Jr., D. J.: Mesoscale variability in the metabolic balance of the Sargasso Sea, Limnol. Oceanogr., 51, 2675–2689, 2006.
Moutin, T., Raimbault, P., and Poggiale, J. C.: Production primaire dans les eaux de surface de la M´editerran´ee occidentale : Calcul de la production journali`ere, C. R. Acad. Sci. Paris, Sciences de la vie, 322, 651–659, 1999.
Moutin, T. and Raimbault, P.: Primary production, carbon export and nutrients availability in western and eastern Mediterranean Sea in early summer 1996, J. Marine Syst., 33–34, 273–288, 2002.
Myklestad, S. M.: Release of extracellular products by phytoplank-ton with special emphasis on polysaccharides, Sci. Total Envi-ron., 165, 155–164, 1995.
Obernosterer, I. and Herndl, G.: Phytoplankton extracallular release and bacterial growth: dependence on the inorganic N:P ratio, Mar. Ecol.-Prog. Ser., 116, 247–257, 1995.
Obernosterer, I., Catala, P., Lami, R., Caparros, J., Ras, J., Bricaud, A., Dupuy, C., Van Wambeke F., and Lebaron, P.: Biochemi-cal characteristics and bacterial community structure of the sea surface microlayer in the South Pacific Ocean, Biogeosciences Discuss., 4, 2809–2844, 2007,
http://www.biogeosciences-discuss.net/4/2809/2007/.
Pomeroy, L. R., Sheldon, J. E., and Sheldon, W. M.: Changes in Bacterial numbers and leucine assimilation during estimations of microbial respiratory rates in seawater by the precision Winkler method, Appl. Environ. Microbiol., 60, 328–332, 1994. Raimbault, P., Garcia, N., and Cerutti, F.: Distribution of inorganic
and organic nutrients in the South Pacific Ocean – evidence for long-term accumulation of organic matter in nitrogen-depleted waters, Biogeosciences Discuss., 4, 3041–3087, 2007,
http://www.biogeosciences-discuss.net/4/3041/2007/.
Ras, J., Claustre, H., and Uitz, J.: Spatial variability of phytoplank-ton pigment distributions in the Subtropical South Pacific Ocean: comparison between in situ and predicted data, Biogeosciences Discuss., 4, 3409–3451, 2007,
http://www.biogeosciences-discuss.net/4/3409/2007/.
Robarts, R. D., Zohary, T., Waiser, M. J., and Yacobi, Y. Z.: Bac-terial abundance, biomass, and production in relation to phy-toplankton biomass in the Levantine Basin of the southeastern Mediterranean Sea, Mar. Ecol.-Prog. Ser., 137, 273–281, 1996. Sherr, E., Sherr, B., and Cowles, T.: Mesoscale variability in
bac-terial activity in the NorthEast Pacific Ocean off Oregon, USA, Aquat. Microb. Ecol., 25, 21–30, 2001.
Sherr, B. F. and Sherr, E. B.: Community respiration/production and bacterial activity in the upper water column of the central Arctic Ocean, Deep-Sea Res. Pt. I, 50, 529–542, 2003.
Smith, D. C. and Azam, F.: A simple, economical method for mea-suring bacterial protein synthesis rates in sea water using 3H-Leucine, Mar. Microb. Food Webs, 6, 107–114, 1992.
Steinberg, D. K., Carlson, C. A., Bates, N. R., Johnson, R. J., Michaels, A. F., and Knap, A. H.: Overview of the US JGOFS BErmuda Atlantic Time-series Study (BATS): a decade-scale look at ocean biology and biogeochemistry, Deep-Sea Res. Pt. II, 48, 1405–1447, 2001.
Tedetti, M., Semp´er´e, R., Vasilkov, A., Charri`ere, B., N´erini, D., Miller, W. L., Kawamura, K., and Raimbault, P.: High pene-tration of ultraviolet radiation in the south east Pacific waters, Geophys. Res. Lett., 34, L12610, doi:10.1029/2007GL029823, 2007.
Teira, E., Serret, P., and Fernandez, E.: Phytoplankton size struc-ture, particulate and dissolved organic carbon production and oxygen fluxes through microbial communities in the NW Iberian transition zone, Mar. Ecol.-Prog. Ser, 219, 65–83, 2001. Torr´eton, J.-P. and Dufour, P.: Bacterioplankton production
deter-mined by DNA synthesis, protein synthesis, and frequency of di-vinding cells in Tuamotu Atoll Lagoons and surrounding ocean, Microb. Ecol., 32, 185–202, 1996.
Van Wambeke, F., Christaki, U., Giannakourou, A., Moutin, T., and Souvemerzoglou, K.: Longitudinal and vertical trends of bacte-rial limitation by phosphorus and carbon in the Mediterranean Sea, Microb. Ecol., 43, 119–133, 2002.
Van Wambeke, F., Bonnet, S., Moutin, T., Raimbault, P., Alarc¸on G., and Guieu, C.: Factors limiting heterotrophic prokaryotic production in the southern Pacific Ocean, Biogeosciences Dis-cuss., 4, 3799–3828, 2007,
http://www.biogeosciences-discuss.net/4/3799/2007/.
Van Wambeke, F., Tedetti, M., Duhamel, S., and Semp´er´e, R.: Diel variability of heterotrophic bacterial production and UV doses in the South East Pacific, Biogeosciences Discuss., 5, 435–462, 2008,
http://www.biogeosciences-discuss.net/5/435/2008/.
Wicks, R. J. and Robarts, R. D.: Ethanol extraction requirement for purification of protein labeled with 3HLeucine in aquatic bac-terial production studies, Appl. Environ. Microbiol., 54, 3191– 3193, 1988.
Williams, P. J. Le B.: Microbial contribution to overall ma-rine plankton metabolism: a direct measurement of respiration, Oceanol. Acta, 4, 359–364, 1981.
Williams, P. J. Le B., Morris, P. J., and Karl, D. M.: Net community production and metabolic balance at the oligotrophic ocean site, station ALOHA, Deep-Sea Res. Pt. I, 51, 1563–1578, 2004.