HAL Id: hal-02370089
https://hal.archives-ouvertes.fr/hal-02370089
Submitted on 15 Sep 2020
HAL is a multi-disciplinary open access
archive for the deposit and dissemination of
sci-entific research documents, whether they are
pub-lished or not. The documents may come from
teaching and research institutions in France or
abroad, or from public or private research centers.
L’archive ouverte pluridisciplinaire HAL, est
destinée au dépôt et à la diffusion de documents
scientifiques de niveau recherche, publiés ou non,
émanant des établissements d’enseignement et de
recherche français ou étrangers, des laboratoires
publics ou privés.
Biases of STRUCTURE software when exploring
introduction routes of invasive species
Eric Lombaert, Thomas Guillemaud, Emeline Deleury
To cite this version:
Eric Lombaert, Thomas Guillemaud, Emeline Deleury. Biases of STRUCTURE software when
ex-ploring introduction routes of invasive species. Heredity, Nature Publishing Group, 2018, 120 (6),
pp.485-499. �10.1038/s41437-017-0042-1�. �hal-02370089�
Biases
of STRUCTURE software when exploring introduction routes
of
invasive species
Eric Lombaert1 ● Thomas Guillemaud1 ● Emeline Deleury1
Abstract
Population genetic methods are widely used to retrace the introduction routes of invasive species. The unsupervised Bayesian clustering algorithm implemented in STRUCTURE is amongst the most frequently used of these methods, but its ability to provide reliable information about introduction routes has never been assessed. We simulated microsatellite datasets to evaluate the extent to which the results provided by STRUCTURE were misleading for the inference of introduction routes. We focused on an invasion scenario involving one native and two independently introduced populations, because it is the sole scenario that can be rejected when obtaining a particular clustering with a STRUCTURE analysis at K = 2 (two clusters). Results were classified as “misleading” or “non-misleading”. We investigated the influence of effective size, bottleneck severity and number of loci on the type and frequency of misleading results. We showed that misleading STRUCTURE results were obtained for 10% of all simulated datasets. Our results highlighted two categories of misleading output. The first occurs when the native population has a low level of diversity. In this case, the two introduced populations may be very similar, despite their independent introduction histories. The second category results from convergence issues in STRUCTURE for K = 2, with strong bottleneck severity and/or large numbers of loci resulting in high levels of differentiation between the three populations. Overall, the risk of being misled by STRUCTURE in the context of introduction routes inferences is moderate, but it is important to remain cautious when low genetic diversity or genuine multimodality between runs are involved.
Introduction
The reconstruction of introduction routes is important for the management of biological invasions because it facil-itates (i) the design of strategies to prevent future invasions by targeting the source area (Mack et al.2000) and (ii) the development of measures to control invasive populations which effectiveness depends on the genetic composition and geographical origin of introduced individuals (Roderick and Navajas 2003). From an academic point of view, retracing the introduction routes of invasive alien species is a prerequisite to accurately compare ancestral and derived
populations to infer ecological and evolutionary processes which determine the invasion success (Keller and Taylor
2008). When there are at least two invasive populations, crucial historical and demographical characteristics of their introductions typically include the number of independent introductions from the native area and the number of serial introductions involving intermediate invasive populations. However, identification of the source of an introduced population is a complex task, because of the highly sto-chastic nature of the introduction process (Estoup and Guillemaud2010). Many population genetics methods and tools are now widely used to retrace the introduction routes of invasive species. This approach is somewhat risky, because the methods involved are often dependent on demographic and genetic equilibria, but invasions often involve demographic disequilibrium, through strong bot-tlenecks followed by rapid population growth, for example. Despite this limitation and the risks of using population genetics methods inappropriately in the specific context of biological invasions, only a few of these methods have been
* Eric Lombaert eric.lombaert@inra.fr
1 INRA, CNRS, Université Côte d’Azur, ISA, Paris, France
Electronic supplementary material The online version of this article
(https://doi.org/10.1038/s41437 017 0042 1) contains supplementary
formally evaluated (e.g., Estoup and Guillemaud 2010; Guillemaud et al.2010).
Among population genetics methods, unsupervised individual Bayesian clustering methods are widely used. The popularity of these methods is due to their ability to infer genetic structure correctly in many situations and their apparent simplicity (several“click-and-play” software suites are available). STRUCTURE (Pritchard et al.2000; Falush et al.2003; Hubisz et al.2009) is the most frequently used software for clustering, with more than 28,000 citations for the three references indicated above in Google Scholar in September 2017. STRUCTURE aims to sort individuals in an unsupervised way into K clusters (K being defined by the user), assuming Hardy–Weinberg/linkage equilibrium within clusters (Porras-Hurtado et al.2013). In theory, if K is set to the true number of population, samples belonging to the same population will be classified into the same cluster. More broadly, because knowing or inferring the true number of population is not always possible, samples belonging to the same cluster are at least considered as
sharing a close evolutionary history. STRUCTURE is known to perform well in most cases, but it can be mis-leading in some situations, particularly in the presence of isolation by distance (Frantz et al. 2009; Schwartz and McKelvey 2009), clusters of very different sizes (Kali-nowski2011; Puechmaille2016), family groups (Anderson and Dunham 2008; Rodríguez-Ramilo and Wang 2012; Rodríguez-Ramilo et al. 2014), or high proportions of missing data (Smith and Wang2014).
STRUCTURE and other software suites based on similar methods are frequently used in the context of introduction routes inferences (Estoup and Guillemaud 2010; Lawson Handley et al. 2011; Cristescu 2015). In some cases, STRUCTURE is used directly to contrast models of inva-sion history, mainly for comparisons of scenarios involving either multiple independent introductions from a native population, or a single introduction from the native area followed by serial introduction(s) from this primary intro-duced area. Being able to differentiate between the two scenarios is of great importance especially because serial
Fig. 1 Schematic representations of the main STRUCTURE clustering patterns that can be obtained at K 3 and K 2 according to different invasion scenarios (either independent or serial) involving one native and two invasive populations. Other patterns with admixture are also possible but are not shown here because they are less informative in the context of invasion routes. At K 3, with 3 samples, the same pattern (i.e., each sample constitutes a cluster) is likely to be found whatever the scenario, and thus no valuable information about the
origin of introduced populations can be deduced. On the contrary, patterns obtained at K 2 can be informative: whereas clustering patterns a and b can be obtained in both independent and serial sce nario, pattern c should only be found if introductions are serial. If obtained, this pattern c would lead a STRUCTURE user to eliminate the independent scenario as a likely one
introductions may be associated with a major eco-evolutionary change in a particular invasive population that can then act as a bridgehead for a larger scale invasion (Lombaert et al. 2010; Guillemaud et al. 2011). In this
context, exploring clustering patterns with only two genetic clusters (K= 2) is considered as informative. Indeed, one of the clustering patterns that can be obtained makes it pos-sible to reject the hypothesis of independent introductions:
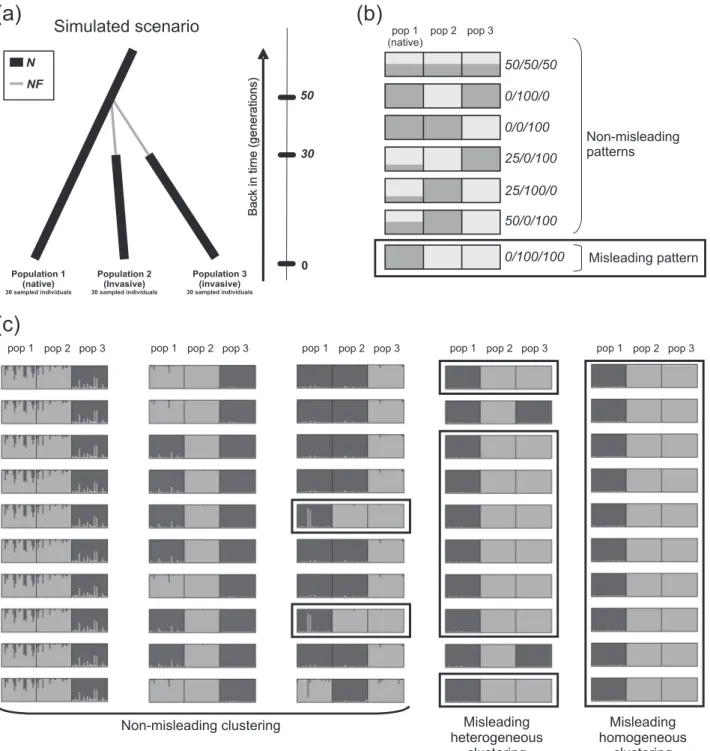
Fig. 2 Simulated scenario and main observed STRUCTURE patterns at K 2.a Graphical representation of the simulated scenario in which two invasive populations (populations 2 and 3) are independently derived from the native population (population 1). N is the effective size at equilibrium and NF is the effective number of founders during the bottlenecks. b Schematic representations of the main patterns obtained in the STRUCTURE runs for K 2 and their associated summarized codes. The misleading pattern, inconsistent with the
simulated scenario, is boxed.c Five examples of clusterings obtained over ten STRUCTURE runs for K 2, and their associated classifi cation. In this study, we focused on“misleading homogeneous clus terings” and “misleading heterogeneous clusterings”, in which “misleading patterns” were found in all ten runs or predominated, respectively, for a given dataset. Runs displaying the misleading pat tern are boxed
if all samples from the invaded areas group together in one cluster, and all samples from the native area group in the other cluster, this allows rejecting the hypothesis of inde-pendent introductions and is considered to provide fairly conclusive evidence about a single introduction from the native area (Fig. 1). For example, Ascunce et al. (2011) explored the worldwide invasion history of the fire ant Solenopsis invicta with a total of 2144 colonies sampled from 75 geographic locations, including 39 native (South America) and 36 invaded (USA, China, Australia) areas. They found that all samples from invasive populations clustered together when analyzing the data with STRUC-TURE at K= 2 and concluded that only one introduction from the native area occurred. They then used approximate Bayesian computation to test whether the oldest invasive population in the USA was the source of all other invasive populations in distant areas. Similarly, Cordero et al. (2017) analyzed 378 individuals of the Manila clam Ruditapes philippinarum from 9 geographic locations, including 3 native (Asia) and 6 invaded (North America and Europe) areas. They found that STRUCTURE analyses at K= 2 grouped all samples of invasive populations into the same cluster. They concluded that a single native Asian intro-duction of the species into North America was very likely, and that North America then became the source of the European outbreak. Such use of STRUCTURE in the context of invasion biology is very common (e.g., Lach-muth et al. 2010; Papura et al. 2012; Robert et al. 2012; Bolte et al. 2013; Fontaine et al. 2013; Sanz et al. 2013; Zhang et al.2014; Yu et al.2014; Zhou et al.2015; Guil-lemaud et al.2015; Rewicz et al.2015; Dieni et al. 2016; Zhu et al. 2017). However, invasions frequently involve major demographic events, such as strong bottlenecks fol-lowed by genetic drift, which may significantly impair our ability to determine introduction routes correctly from a given STRUCTURE result. This may account for the con-tradictory outcomes sometimes obtained with different population genetics methods. For example, Mallez et al. (2015) found conflicting results when trying to infer the origin of the invasive Portuguese outbreak of the pinewood nematode Bursaphelenchus xylophilus: while FST values
suggested a native North American origin, STRUCTURE suggested an origin from an oldest invasive population in Japan for these samples, because all invasive samples from Portugal and Japan belonged to one cluster and all native samples belonged to another cluster while analyzing K= 2 patterns.
In this study, we evaluated the risk of incorrect intro-duction route inferences based on STRUCTURE analyses, for the simple case of an invasion scenario involving one native population and two independently introduced popu-lations. We chose to simulate this scenario because it is the sole one that can be rejected when obtaining a particular
clustering with a STRUCTURE analysis at K= 2 (Fig.1). We simulated a large number of microsatellite datasets drawn from populations of various effective sizes and bot-tleneck severities. STRUCTURE analyses were performed on these simulated datasets and the resulting clustering patterns at K= 2 were classified as “misleading” or “non-misleading”. We then explored the effect of demographic parameters on the likelihood of misleading patterns being obtained, to identify and predict the situations in which the use of STRUCTURE in a context of introduction routes inference may be risky.
Methods
Scenario description and data simulation
We chose to simulate a scenario with two independent introductions because it is the only one that can be rejected from a STRUCTURE analysis when considering two introduced populations and a native one (Fig. 1). We thus defined a simple historical scenario in which two invasive populations (populations 2 and 3) were independently founded 50 generations ago from the same native popula-tion (populapopula-tion 1). Both invasive populapopula-tions were sub-jected to a demographic bottleneck lasting 20 generations (Fig. 2a). The effective sizes of all three populations at equilibrium (N) and the effective number of founders of the two invasive populations during the bottlenecks (NF) could take different values: 10000, 1000, 100, 10, and 2 indivi-duals, with N≥ NF. Log10(N/NF) was considered to
quan-tify bottleneck severity.
We used DIYABC version 2.0.4 software (Cornuet et al.
2014) to generate microsatellite multilocus genotype data-sets through a coalescent process. We evaluated the effect of the number of loci on the analyses, by performing simulations with 10, 20, or 100 unlinked microsatellite markers. For each combination of N, NF, and number of loci, a total of 500 replicate datasets were generated. For all datasets, a sample of 30 diploid individuals per population was simulated. We used a generalized stepwise mutation model, with realistic values for all three parameters (Jarne and Lagoda1996; Estoup et al.2002): the mean mutation rate (set to 5× 10 4), the mean parameter of the geometric distribution defining the number of microsatellite repeats gained or lost during mutation events (set to 0.22) and the mean mutation rate for single-nucleotide insertion/deletion (set to 10 8). In total, we simulated 22,500 datasets (15 sets of parameters× 3 numbers of loci × 500 replicate datasets). We developed a pipeline with PERL scripts, available at
https://doi.org/10.5281/zenodo.1002658, to automate the processing of the datasets (simulations and subsequent STRUCTURE and post-STRUCTURE analyses).
STRUCTURE analyses and misleading clustering
For each of the 22,500 simulated datasets, a Bayesian clustering analysis was performed in parallel, on a 120-cores computer cluster, with STRUCTURE software version 2.3.4 (Pritchard et al.2000). We chose the admix-ture model with correlated allele frequencies and no linkage between loci. We used default values for all the other parameters. Each run consisted of a burn-in period of 105 Markov chain Monte Carlo (MCMC) iterations, followed by 5× 10⁵MCMC iterations. This run length is considered to be long enough to obtain precise estimates of parameters (Pritchard et al.2010), but we also tried runs of double this length for some combinations of parameters with 100 loci. The results obtained were the same (data not shown). We carried out ten replicate runs for each dataset and each value of K, the number of genetic clusters, with K taking values of 1, 2, 3 and 4. Although K= 2 constituted the focal analysis of our study, we tested multiple values of K in order to infer its most likely value as follow: for each dataset, if the mean natural logarithm of the likelihood of the data ln(P(X|K)) was maximal for K = 1, then the inferred number of clusters was 1; otherwise, we determined the best value of K (either K= 2 or K = 3) by the ΔK method (Evanno et al.2005).
We investigated the ability of STRUCTURE to clarify introduction routes by focusing on K= 2 analyses. With K = 2, the two samples from an introduced population may or may not cluster together. With the scenario simulated here, in which the two invasive populations result from two independent introductions, the two samples of the introduced populations would not be expected to cluster together (Fig.1). Indeed, the two independent drift pulses at work during these two introductions (i.e., the bottleneck events) should make the introduced populations more genetically different from each other than from the native population, from which they are separated by a single drift pulse. Consequently, STRUCTURE would yield a misleading pattern if the native population sample belonged to one cluster and the two invasive population samples both belonged to the other at K= 2. Indeed, this could be considered evidence for a lack of independence of the two populations, with one invasive population being the source of the other (Figs.1 and 2b). Such a clustering pattern, hereafter referred to as “misleading clustering”, would lead most STRUCTURE users to an incorrect interpretation, according to which a “serial introductions” scenario would be more likely than the “independent introductions” scenario. Note that STRUCTURE analyses carried out on three population samples with K= 3 are, theoretically, unsuitable for comparisons of indepen-dent and serial introductions scenarios, because each
population sample would probably form its own cluster (Fig. 1).
For analysis of the 225,000 STRUCTURE runs with K = 2 and estimation of the frequency of misleading cluster-ings, the STRUCTURE output was characterized as fol-lows. From the output file of each run, we extracted the proportion of membership QiA and QiB of population
sam-ple i for clusters A and B, respectively (with QiB= 1–QiA).
The QiAand QiBvalues were coded as 0, 25, 50, 75, or 100
when belonging to the [0;0.2],]0.2;0.4[, [0.4;0.6],]0.6;0.8 [or [0.8;1] intervals, respectively. For each STRUCTURE run, we summarized the clustering pattern by a code C1A/
C2A/C3A, where CiA is the membership code of population
sample i for cluster A. For example, the clustering code would be 0/0/100 for a STRUCTURE run output in which Q1A= 0.12, Q2A= 0.05, and Q3A= 0.96. Note that
belonging to cluster A or B has no specific meaning, and the subscripts A and B can thus be permuted. For example, clustering codes 0/0/100 and 100/100/0 summarize the same pattern and are pooled together as 0/0/100. Given the simulated scenario of independent introductions of the two invasive populations, 0/100/100 was the code considered to correspond to misleading clustering (Fig. 2b). All other clustering codes were considered non-misleading in the context of introduction routes inference. Focusing on the codes instead of the proportions of membership made it possible to pool together slightly different clustering pat-terns in the same category.
Given the stochastic processes involved in the MCMC analysis, the ten replicated STRUCTURE runs performed on a single dataset could conceivably generate different results, a phenomenon called genuine multimodality (Jakobsson and Rosenberg 2007; Porras-Hurtado et al.
2013). Clustering results for a given dataset were con-sidered to be homogeneous if the same clustering code (as defined above) was obtained in all ten runs. They were otherwise considered to be heterogeneous. We evaluated the global occurrence of misleading clustering in the analyses of the simulated datasets, and focused on two critical categories of misleading clusterings (Fig.2c):
(i) “Misleading homogeneous clusterings”: for one data-set, all ten runs homogeneously provide the mislead-ing clustermislead-ing pattern 0/100/100.
(ii) “Misleading heterogeneous clusterings”: for one dataset, the ten runs are not homogeneous (i.e., genuine multimodality is observed) and the mislead-ing clustermislead-ing pattern 0/100/100 predominates. In addition, we quantified the proportion of datasets for which the most frequent clustering pattern was also represented by the run with the highest log-likelihood of the data.
Effect of demographic parameter values on
misleading clustering
For each number of simulated microsatellite loci (10, 20, or 100), the variables “proportion of analyses yielding mis-leading homogeneous clusterings” and “proportion of ana-lyses yielding misleading heterogeneous clusterings” were analyzed independently with a generalized linear model, using a binomial probability distribution of the residual error and a logit link function. The following factors were included as fixed effects: effective population size N and bottleneck severity log10(N/NF). We used the Akaike
information criterion (AIC) to select the best model from the various models of different complexity. Analyses were performed with R software V3.2.2 (R Development Core Team2015).
Link between summary statistics of genetic diversity
and STRUCTURE patterns
We summarized each simulated dataset, by using ARL-SUMSTAT version 3.5 software (Excoffier and Lischer
2010) to compute the mean number of alleles and the mean expected heterozygosity in each population sample, and the pairwise FSTvalues between each pair of populations. We
also used in-house PERL scripts to compute (i) the mean
individual assignment likelihood (Rannala and Mountain
1997) (Li→j) of each invading population (samples 2 and 3)
to each possible source population (i.e., either the native population or the other invasive population), and (ii) the number of alleles shared by the invasive population samples.
For the comparison of datasets leading to “misleading homogeneous clusterings”, “misleading heterogeneous clusterings” and “non-misleading clusterings”, we specifi-cally explored a few genetic diversity summary statistics: (i) expected heterozygosity of the native population sample, (ii) mean expected heterozygosity of both invasive popu-lation samples and (iii) the ratio of alleles shared by the two invasive population samples to the total number of alleles in the two samples. For each summary statistic and each number of loci, pairwise Mann–Whitney tests with Holmes correction for multiple comparisons were performed.
We also compared STRUCTURE results with those obtained by two other methods traditionally used to identify source populations: (i) the“FST-based method” and (ii) the
“assignment likelihood-based method” (Genton et al.2005; Pascual et al. 2007; Ciosi et al. 2008; Tepolt et al. 2009; Thibault et al.2009; Papura et al.2012; Mallez et al.2015; Dieni et al. 2016). For an“independent introductions” sce-nario, we would expect the FST between the two invasive
population samples to be larger than the FSTvalues between
Fig. 3 Distribution of the best number of clusters K inferred by Evanno’s method for each number of loci, and the proportion for which there was an absence (homogeneous clustering) or presence (heterogeneous clustering) of genuine multimodality in the ten STRUCTURE runs carried out at K 2
the native population and each of the invasive population samples (i.e., FST2–3 > FST 1–2 and FST 2–3 > FST 1–3).
We would also expect both invasive population samples to be best assigned to the native population sample (i.e., L2→1
> L2→3and L3→1> L3→2).
For each dataset, a global exact test for population gen-otypic differentiation (Raymond and Rousset 1995a) was carried out with GENEPOP software version 4.3 (Raymond and Rousset 1995b). If a dataset displayed no population differentiation, we made the prudent and standard decision of not trying to infer any evolutionary relationship between the population samples. Consequently, such datasets were
considered to generate non-misleading results for all methods.
Results
Effect of demographic parameter values on
simulated datasets
The 500 simulated datasets for each parameter set are summarized with some common statistics in Table S1. Decreasing effective population sizes (N) generate lower
Fig. 4 a Proportion of datasets with and without misleading patterns (Fig.2b) for the ten STRUCTURE runs at K 2.b Best inferred number of clusters K obtained by Evanno’s method for each number of loci within the datasets displaying misleading homogeneous (left) and misleading heterogeneous clusterings (right)
intra-population and higher inter-population genetic diver-sities. Increasing bottleneck severity (log10(N/NF))
gen-erates lower intra-population genetic diversities for both invasive samples, and overall higher inter-population genetic diversity. The main impact of a larger number of loci is a decrease in the variance of all summary statistics. Overall, the chosen parameter values (for N and NF) yield a large number of different combinations of genetic diversity for evaluation of the ability of STRUCTURE software to explore introduction routes in different situations.
Overall STRUCTURE results
The best value of K inferred was most frequently three (Fig.
3and Fig. S1). The proportion of datasets for which the best number of clusters was K= 3 increased strongly with increasing numbers of loci (41.9, 50.6, and 74.9% for 10, 20, and 100 loci, respectively). More than 80% of the simulated datasets for which K= 3 was inferred by the ΔK method had heterogeneous clustering codes (i.e., genuine multimodality) at K= 2 (Fig. 3). By contrast, when the number of inferred clusters was one or two, multimodality at K= 2 was found in less than 10% of all datasets.
Occurrence of misleading STRUCTURE patterns
Three categories of clustering codes at K= 2 accounted for more than 95% of all runs (see Table S2 for details): (i)
clusterings in which all populations were fully admixed and undistinguishable with STRUCTURE (i.e., the 50/50/50 code), (ii) clusterings in which the two invasive samples belonged to different clusters (i.e., the C1A/100/0 and C1A/0/
100 codes) and (iii) the misleading clusterings defined earlier (see Methods), in which the two invasive samples belonged to the same cluster, whereas the native sample belonged to the other cluster (i.e., the 0/100/100 code, Fig.
2b).
Overall, the proportion of datasets with at least one misleading clustering pattern over the ten STRUCTURE runs (“misleading homogeneous clusterings”, “misleading heterogeneous clusterings” and non-misleading clusterings with at least one run yielding a misleading pattern) was 15.31, 22.07, and 47.01% for 10, 20, and 100 simulated loci, respectively (Fig. 4a and Fig. S2), and very similar proportions were obtained with more (0.1 and 0.9) and less (0.3 and 0.7) stringent QiAcutoff values (instead of 0.2 and
0.8 for QiA) for the encoding of pattern results (Table S3).
The frequency of“misleading homogeneous clusterings” was similar for different numbers of loci, and was rather low overall (between 4.24 and 5.59% of the datasets, Fig.
4a). “Misleading heterogeneous clusterings” were also infrequent, but their frequency increased with the number of loci: 2.71, 3.96, and 8.41% for 10, 20, and 100 loci, respectively (Fig. 4a). Overall, 7.45, 9.55, and 12.65% of datasets for 10, 20, and 100 loci, respectively, yielded misleading results. For some combinations of parameters,
Table 1 Results obtained with the best model selected from the various statistical models run for the response variables“proportion of analyses yielding homogeneous misleading clusterings” and “proportion of analyses yielding heterogeneous misleading clusterings”
Response variable Number of loci Factors of selected model
Estimate Std error z value (df 7499)
P
Proportion of analyses yielding homogeneous misleading clusterings
10 N 0.004 0.0005 7.931 <0.0001 log10(N/NF) 0.399 0.084 4.746 <0.0001 N x log10(N/NF) 0.001 0.0002 5.185 <0.0001 20 N 0.005 0.0005 9.658 <0.0001 100 N 0.0003 0.00006 5.757 <0.0001 log10(N/NF) 0.194 0.259 0.749 0.4540 N× log10(N/NF) 0.028 0.005 5.190 <0.0001
Proportion of analyses yielding heterogeneous misleading clusterings
10 N 0.0002 0.00007 3.496 0.0005 log10(N/NF) 1.107 0.114 9.672 <0.0001 N× log10(N/NF) 0.00004 0.00002 1.827 0.0677 20 N 0.0004 0.00006 5.977 <0.0001 log10(N/NF) 0.574 0.079 7.178 <0.0001 N× log10(N/NF) 0.00009 0.00002 4.854 <0.0001 100 N 0.0009 0.0001 9.666 <0.0001 log10(N/NF) 0.801 0.068 11.715 <0.0001 N× log10(N/NF) 0.0003 0.00003 11.245 <0.0001
Fig. 5 Proportion of simulated datasets yielding (a) misleading homogeneous clusterings and (b) misleading heterogeneous cluster ings as a function of the parameters “effective population size at
equilibrium” (N) and “bottleneck severity” (log10(N/NF)). Each pro
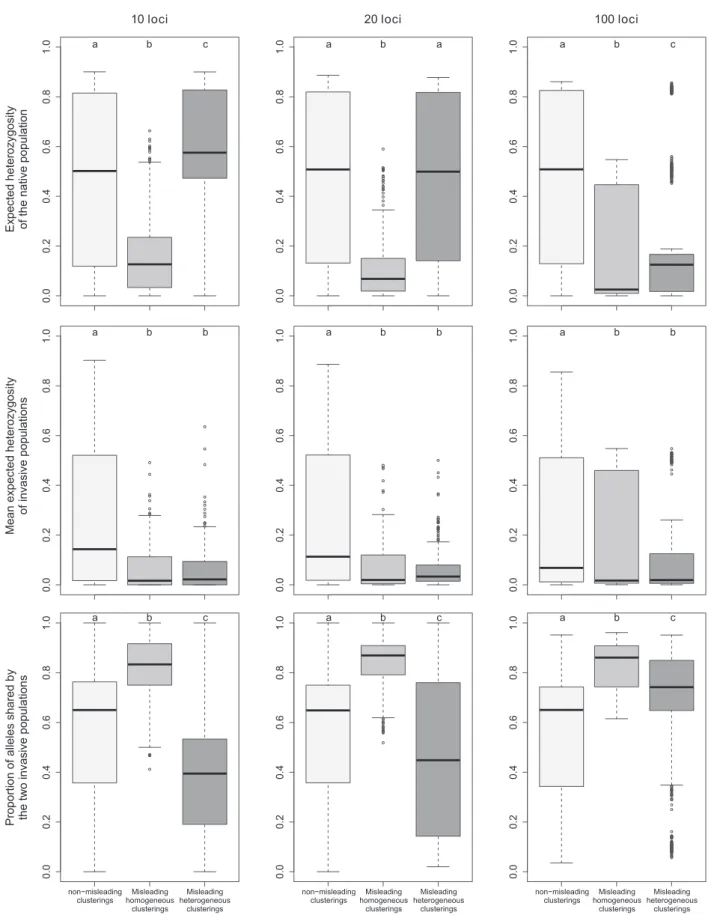
Fig. 6 Tukey boxplots representing population genetics summary statistics for simulated datasets yielding non misleading clusterings, misleading homogeneous clusterings or misleading heterogeneous
clusterings. Within each frame, plots labeled with different letters are significantly different at the 5% level of significance (Mann Whitney tests)
this proportion reached 36.8% of datasets (Fig. S2). K= 2 was most often (70%) inferred for datasets yielding “mis-leading homogeneous clusterings”, and K = 3 was most often (91%) inferred for datasets leading to “misleading heterogeneous clusterings” (Fig. 4b).
For 85.8% of all datasets, the code of the run with the highest log-likelihood of the data was the code that pre-dominates over the 10 runs. However, this proportion dropped to only 40.5% when considering specifically the datasets displaying“Misleading heterogeneous clusterings”.
Effect of demographic parameter values on
STRUCTURE results
For the response variable “proportion of analyses yielding misleading homogeneous clusterings”, the best model according to the AIC always included the effective popu-lation size at equilibrium N, which was highly significant whatever the number of simulated loci (Table1). Lower N values resulted in a higher proportion of misleading homogeneous clusterings (Fig. 5a). The best model also included bottleneck severity, log10(N/NF), and the
interac-tion between the two main factors for 10 and 100 loci. Bottleneck severity was significant only for 10 loci, and had
a positive effect: the stronger the bottleneck, the higher the proportion of misleading homogeneous clusterings. The interaction between the two factors was significant in both models (Table 1and Fig.5a).
For the response variable “proportion of analyses yield-ing misleadyield-ing heterogeneous clusteryield-ings”, the full model was selected for all numbers of simulated loci (Table 1). The effective population size at equilibrium N was sig-nificant in all cases, and had a negative effect (Fig. 5b). Bottleneck severity log10(N/NF) was also strongly
sig-nificant for all numbers of loci, but its effect was positive for 10 and 20 loci and negative for 100 loci. The interaction between the two factors was significant for 20 and 100 loci, with a positive effect (Table1).
Links between summary statistics for genetic
diversity and STRUCTURE patterns
The diversity of the native population, as assessed by its expected heterozygosity in the datasets with “misleading homogeneous clusterings”, was significantly lower than that for “non-misleading” datasets, with median values ranging from 0.025 to 0.126 depending on the number of loci considered (Fig.6). On the contrary, no clear trend could be
Fig. 7 Venn diagrams illustrating the distribution of misleading results for three methods: the FST based method, the assignment likelihood based method, and STRUCTURE. Each diagram was produced with 7,500 datasets. The Venn diagrams on the left correspond to
homogeneous misleading clustering with STRUCTURE, whereas those on the right correspond to heterogeneous misleading clustering with STRUCTURE
observed for datasets with “misleading heterogeneous clusterings”. For these datasets, the mean expected hetero-zygosity was relatively high with 10 loci, intermediate with 20 loci and low with 100 loci, but, in each case, extreme low and high values were observed. The diversity of inva-sive populations, which was affected by both the diversity of the native population and bottleneck severity, was low for both kinds of misleading clusterings (Fig.6). In com-parisons with the“non-misleading” datasets, the proportion of alleles shared by the two invasive populations was higher for the datasets with“misleading homogeneous clusterings” regardless of the number of loci, and lower for“misleading heterogeneous clusterings”, except for 100 loci for which it was higher (Fig.6).
Outcomes for comparisons of STRUCTURE clusterings with results from FST-based and assignment
likelihood-based methods were very mixed, depending on the type of “misleading clusterings” considered. 86.5, 93.6, and 99.1% of datasets with “misleading homogeneous clusterings” in STRUCTURE provided misleading results with at least one of the methods based on FST or assignment likelihood,
when considering 10, 20, and 100 loci, respectively (Fig.7). By contrast, datasets with“misleading heterogeneous clus-terings” in STRUCTURE analysis were rarely (for 10 and 20 loci), or at least not as strongly (for 100 loci), associated with misleading results with the other methods: this was the case for 15.2, 24.9, and 67.5% of these datasets for 10, 20, and 100 loci, respectively (Fig. 7). Note that, overall, STRUCTURE generates less misleading results than the other two methods, while the assignment likelihood-based method generates the worse results.
Discussion
We used simulated microsatellite datasets for a particular invasion scenario to determine whether the method imple-mented in the widely used STRUCTURE software (Pritchard et al.2000) could mislead users trying to infer introduction routes. We focused on a scenario with two independent introductions from a native population because this scenario can be rejected when obtaining some particular clustering results, which is not true for serial introductions scenarios when the chronology of introductions is not known. We found that, for a true scenario of two inde-pendent invasions from a single source, STRUCTURE runs could give misleading clustering patterns (i.e., the two invasive populations clustered together at K= 2). In about 10% of all simulated datasets, the results led to incorrect interpretation, with all (“homogeneous misleading cluster-ings”) or most (“heterogeneous misleading clusterings”) of the runs for a given dataset yielding the misleading pattern. Some combinations of demographic parameters resulted in
higher frequencies of misleading results with STRUC-TURE, and increasing the number of loci also led to an overall increase in the frequency of misleading results. Our results suggested that the two types of misleading clustering hazard, homogeneous and heterogeneous misleading clus-terings, were very different. We suggest that (i) “homo-geneous misleading clusterings” probably arise from a large probability of independently drawing the same alleles twice from a native population with low genetic diversity and that (ii) “heterogeneous misleading clusterings” probably ran-domly arise from convergence problems in STRUCTURE. For “homogeneous misleading clustering”, the effective size of the native population has the strongest effect: the smaller this effective population size, the higher the risk of obtaining misleading clustering patterns over all STRUC-TURE runs. Such “homogeneous misleading clusterings” occurred principally when the two invasive populations were very alike: they shared a large proportion of alleles, and the FST-based and likelihood assignment-based
meth-ods frequently yielded the same clustering pattern. Accordingly, the number of clusters inferred by the Evan-no’s method was most frequently K = 2, which was not expected given the three-population simulated scenario. Invasive populations encounter founder effects and genetic drift (Simberloff2009; Lawson Handley et al.2011), which are random processes. In this context, the probability of independently drawing the same allele twice from a given native population is directly dependent on its frequency. This probability is equal to the expected homozygosity of the considered allele, and is therefore rather low when the number of allele is high, but can actually get large when the diversity is limited. As a matter of fact, “homogeneous misleading clusterings” were observed with datasets in which the native population displayed a very low expected heterozygosity, implying that there were only one or a few highly frequent alleles at each locus (Allendorf1986).
The interpretation of“heterogeneous misleading cluster-ings” is less clear-cut, but several lines of evidence suggest the involvement of convergence issues in STRUCTURE runs. Indeed,“heterogeneous misleading clusterings” at K = 2 most often occurred when the best K value was undoubtedly 3, which corresponds to the true number of population. More generally, this category of misleading clusterings was associated with a better ability to differ-entiate the three populations. This may explain why the proportion of “heterogeneous misleading clusterings” was higher for a larger number of loci, for which more infor-mation is available to properly differentiate populations (Evanno et al. 2005; Waples and Gaggiotti 2006; Hubisz et al.2009). This is indeed entirely consistent with what is observed in the context of genome-scale phylogenies in which a larger amount of data is known to exacerbate the potential for bias to be misleading when the model used to
describe the data is not properly chosen (Phillips et al.2004; Rodríguez-Ezpeleta et al. 2007; Kumar et al. 2012). Besides, for 10 and 20 simulated loci, the proportion of “heterogeneous misleading clusterings” was positively related to bottleneck severity, which accentuates differences between populations. Overall, we suggest that “hetero-geneous misleading clustering” probably results from a convergence problem in the MCMC procedure of STRUCTURE: when an inappropriate number of clusters is imposed—here K = 2 whereas the data are more consistent with K= 3—multimodalities are often observed (Pritchard et al. 2000; Jakobsson and Rosenberg 2007), and sometimes, by chance, a large proportion of misleading clustering events occur in the various runs, resulting in “heterogeneous misleading clusterings”. The important role of randomness is further supported by the weak asso-ciation between such clusterings and the log-likelihood of the data.
Conclusion and general recommendations
This study was based on a single simple invasion scenario with only three populations. More complex scenarios should be studied in the future, for example by increasing the number of native populations, including admixture or isolation by distance, or manipulating divergence times, but this study constitutes a crucialfirst step, providing impor-tant information about the use of clustering methods in the context of biological invasions.
We found that STRUCTURE yielded misleading results, but at a low frequency. However, our results suggest that some situations should be analyzed with care. First, inva-sion biologists should be very cautious if the diversity of the native population is low: independent introductions from a single source population with low genetic diversity are likely to produce genetic signals similar to that expected for serial introductions. Such misleading results are difficult to spot, as they are consistent with the results of other meth-ods, such as FST- or assignment likelihood-based methods.
In this context, quantitative methods may be very useful. Approximate Bayesian calculation, for example, has proven to be very powerful in a very similar context (Guillemaud et al. 2010). Second, multimodal STRUCTURE results should be interpreted very cautiously, particularly if large numbers of loci are used. This is sobering news, because many published studies interpret STRUCTURE results at different K values, including those displaying genuine multimodality. This problem is not specific to the explora-tion of introducexplora-tion routes and has much wider implicaexplora-tions (Meirmans 2015). Multimodality is often a sign of poor convergence of STRUCTURE runs, and is therefore likely to lead to results of limited biological meaning. In such situations, other methods (e.g., FST-based, assignment
likelihood-based or principal component analysis) may make it possible to determine whether the STRUCTURE results are misleading or not. Also, the log-likelihood of the data estimated by the software may help to reject a mean-ingless clustering, but this statistic should be interpreted with great care (Jakobsson and Rosenberg 2007). More generally, it is important to keep in mind that STRUCTURE results have to be interpreted cautiously (Pritchard et al.
2010) and, in the context of invasion routes inferences, it should rather be used as a tool to clarify the scenery and decrease the number of genetic units from a large number of population samples to a few main clusters before quantita-tive analyses, such as approximate Bayesian computation, are performed (Lombaert et al.2014).
Data accessibility
Simulated datasets, STRUCTURE outputs and the home-made PERL pipeline used to simulate, analyze, and post-process the data were deposited at Zenodo: https://doi.org/ 10.5281/zenodo.1002658.
Acknowledgements We thank Margarita Correa, Arnaud Estoup, Thibaut Malausa, and Ferran Palero for fruitful comments and dis cussions. We also thank Alexandre Dehne Garcia for assistance with the computer cluster.
Author contributions E.L., T.G., and E.D. conceived and designed the study. E.D. wrote the scripts and ran the simulations and analyses. E.L. and E.D. analyzed the data. E.L., T.G., and E.D. wrote the paper.
Compliance with ethical standards
Conflict of interest The author declares that they have no competing interests.
References
Allendorf FW (1986) Genetic drift and the loss of alleles versus het erozygosity. Zoo Biol 5:181 190
Anderson EC, Dunham KK (2008) The influence of family groups on inferences made with the program Structure. Mol Ecol Resour 8:1219 1229
Ascunce MS, Yang CC, Oakey J, Calcaterra L, Wu WJ, Shih CJ et al. (2011) Global invasion history of thefire ant Solenopsis invicta. Science 331:1066 1068
Bolte S, Fuentes V, Haslob H, Huwer B, Thibault Botha D, Angel D et al. (2013) Population genetics of the invasive ctenophore Mnemiopsis leidyi in Europe reveal source sink dynamics and secondary dispersal to the Mediterranean Sea. Mar Ecol Prog Ser 485:25 36
Ciosi M, Miller NJ, Kim KS, Giordano R, Estoup A, Guillemaud T (2008) Invasion of Europe by the western corn rootworm, Dia brotica virgifera virgifera: multiple transatlantic introductions with various reductions of genetic diversity. Mol Ecol 17:3614 3627
Cordero D, Delgado M, Liu B, Ruesink J, Saavedra C (2017) Popu lation genetics of the Manila clam (Ruditapes philippinarum) introduced in North America and Europe. Sci Rep 7:39745
Cornuet J M, Pudlo P, Veyssier J, Dehne Garcia A, Gautier M, Leblois R et al. (2014) DIYABCv2.0: a software to make approximate Bayesian computation inferences about population history using single nucleotide polymorphism, DNA sequence and microsatellite data. Bioinformatics 30:1187 1189
Cristescu ME (2015) Genetic reconstructions of invasion history. Mol Ecol 24:2212 2225
Dieni A, Brodeur J, Turgeon J (2016) Reconstructing the invasion history of the lily leaf beetle, Lilioceris lilii, in North America. Biol Invasions 18:31 44
Estoup A, Guillemaud T (2010) Reconstructing routes of invasion using genetic data: why, how and so what? Mol Ecol 19:4113 4130
Estoup A, Jarne P, Cornuet JM (2002) Homoplasy and mutation model at microsatellite loci and their consequences for population genetics analysis. Mol Ecol 11:1591 1604
Evanno G, Regnaut S, Goudet J (2005) Detecting the number of clusters of individuals using the software STRUCTURE: a simulation study. Mol Ecol 14:2611 2620
Excoffier L, Lischer HEL (2010) Arlequin suite ver 3.5: a new series of programs to perform population genetics analyses under Linux and Windows. Mol Ecol Resour 10:564 567
Falush D, Stephens M, Pritchard JK (2003) Inference of population structure using multilocus genotype data: Linked loci and corre lated allele frequencies. Genetics 164:1567 1587
Fontaine MC, Gladieux P, Hood ME, Giraud T (2013) History of the invasion of the anther smut pathogen on Silene latifolia in North America. New Phytol 198:946 956
Frantz AC, Cellina S, Krier A, Schley L, Burke T (2009) Using spatial Bayesian methods to determine the genetic structure of a con tinuously distributed population: clusters or isolation by distance? J Appl Ecol 46:493 505
Genton BJ, Shykoff JA, Giraud T (2005) High genetic diversity in French invasive populations of common ragweed, Ambrosia artemisiifolia, as a result of multiple sources of introduction. Mol Ecol 14:4275 4285
Guillemaud T, Beaumont MA, Ciosi M, Cornuet JM, Estoup A (2010) Inferring introduction routes of invasive species using approx imate Bayesian computation on microsatellite data. Heredity 104:88 99
Guillemaud T, Blin A, Le Goff I, Desneux N, Reyes M, Tabone E et al. (2015) The tomato borer, Tuta absoluta, invading the Mediterranean Basin, originates from a single introduction from Central Chile. Sci Rep 5:8371
Guillemaud T, Ciosi M, Lombaert E, Estoup A (2011) Biological invasions in agricultural settings: Insights from evolutionary biology and population genetics. C R Biol 334:237 246 Hubisz MJ, Falush D, Stephens M, Pritchard JK (2009) Inferring weak
population structure with the assistance of sample group infor mation. Mol Ecol Resour 9:1322 1332
Jakobsson M, Rosenberg NA (2007) CLUMPP: a cluster matching and permutation program for dealing with label switching and mul timodality in analysis of population structure. Bioinformatics 23:1801 1806
Jarne P, Lagoda PJL (1996) Microsatellites, from molecules to populations and back. Trends Ecol Evol 11:424 429
Kalinowski ST (2011) The computer program STRUCTURE does not reliably identify the main genetic clusters within species: simu lations and implications for human population structure. Heredity 106:625 632
Keller SR, Taylor DR (2008) History, chance and adaptation during biological invasion: separating stochastic phenotypic evolution from response to selection. Ecol Lett 11:852 866
Kumar S, Filipski AJ, Battistuzzi FU, Kosakovsky Pond SL, Tamura K (2012) Statistics and truth in phylogenomics. Mol Biol Evol 29:457 472
Lachmuth S, Durka W, Schurr FM (2010) The making of a rapid plant invader: genetic diversity and differentiation in the native and invaded range of Senecio inaequidens. Mol Ecol 19:3952 3967 Lawson Handley L J, Estoup A, Evans DM, Thomas CE, Lombaert E, Facon B et al. (2011) Ecological genetics of invasive alien spe cies. Biocontrol 56:409 428
Lombaert E, Guillemaud T, Cornuet JM, Malausa T, Facon B, Estoup A (2010) Bridgehead effect in the worldwide invasion of the biocontrol harlequin ladybird. PLoS One 5:e9743
Lombaert E, Guillemaud T, Lundgren J, Koch R, Facon B, Grez A et al. (2014) Complementarity of statistical treatments to recon struct worldwide routes of invasion: the case of the Asian lady bird Harmonia axyridis. Mol Ecol 23:5979 5997
Mack RN, Simberloff D, Lonsdale WM, Evans H, Clout M, Bazzaz FA (2000) Biotic invasions: causes, epidemiology, global con sequences, and control. Ecol Appl 10:689 710
Mallez S, Castagnone C, Espada M, Vieira P, Eisenback JD, Harrell M et al. (2015) Worldwide invasion routes of the pinewood nema tode: What can we infer from population genetics analyses? Biol Invasions 17:1199 1213
Meirmans PG (2015) Seven common mistakes in population genetics and how to avoid them. Mol Ecol 24:3223 3231
Papura D, Burban C, van Helden M, Giresse X, Nusillard B, Guille maud T et al (2012) Microsatellite and mitochondrial data pro vide evidence for a single major introduction for the neartic leafhopper Scaphoideus titanus in Europe. PLoS One 7:e36882 Pascual M, Chapuis MP, Mestres F, Balanya J, Huey RB, Gilchrist
GW et al. (2007) Introduction history of Drosophila subobscura in the New World: a microsatellite based survey using ABC methods. Mol Ecol 16:3069 3083
Phillips MJ, Delsuc F, Penny D (2004) Genome scale phylogeny and the detection of systematic biases. Mol Biol Evol 21:1455 1458 Porras Hurtado L, Ruiz Y, Santos C, Phillips C, Carracedo A, Lareu MV (2013) An overview of STRUCTURE: applications, para meter settings, and supporting software. Front Genet 4:98 Pritchard JK, Stephens M, Donnelly P (2000) Inference of population
structure using multilocus genotype data. Genetics 155:945 959 Pritchard JK, Wen W, Falush D (2010) Documentation for structure
software: Version 2.http://pritch.bsd.uchicago.edu.
Puechmaille SJ (2016) The program STRUCTURE does not reliably recover the correct population structure when sampling is uneven: subsampling and new estimators alleviate the problem. Mol Ecol Resour 16:608 627
R Development Core Team (2015) R: a language and environment for statistical computing. R Foundation for Statistical Computing, Vienna, Austria.https://www.R project.org/.
Rannala B, Mountain JL (1997) Detecting immigration by using multilocus genotypes. Proc Natl Acad Sci USA 94:9197 9201 Raymond M, Rousset F (1995a) An exact test for population differ
entiation. Evolution 49:1280 1283
Raymond M, Rousset F (1995b) Genepop (version. 1.2), a population genetics software for exact tests and ecumenicism. J Hered 86:248 249
Rewicz T, Wattier R, Grabowski M, Rigaud T, Bącela Spychalska K (2015) Out of the black sea: phylogeography of the invasive killer shrimp Dikerogammarus villosus across Europe. PLoS One 10: e0118121
Robert S, Ravigne V, Zapater MF, Abadie C, Carlier J (2012) Con trasting introduction scenarios among continents in the world wide invasion of the banana fungal pathogen Mycosphaerella fijiensis. Mol Ecol 21:1098 1114
Roderick GK, Navajas M (2003) Genes in new environments: genetics and evolution in biological control. Nat Rev Genet 4:889 899 Rodríguez Ezpeleta N, Brinkmann H, Roure B, Lartillot N, Lang BF,
Philippe H (2007) Detecting and overcoming systematic errors in genome scale phylogenies. Syst Biol 56:389 399
Rodríguez Ramilo ST, Toro MA, Wang J, Fernández J (2014) Improving the inference of population genetic structure in the presence of related individuals. Genet Res (Camb) 96:e003
Rodríguez Ramilo ST, Wang J (2012) The effect of close relatives on unsupervised Bayesian clustering algorithms in population genetic structure analysis. Mol Ecol Resour 12:873 84 Sanz N, Araguas RM, Vidal O, Diez del Molino D, Fernández Ceb
rián R, García Marín JL (2013) Genetic characterization of the invasive mosquitofish (Gambusia spp.) introduced to Europe: population structure and colonization routes. Biol Invasions 15:2333 2346
Schwartz MK, McKelvey KS (2009) Why sampling scheme matters: the effect of sampling scheme on landscape genetic results. Conserv Genet 10:441 452
Simberloff D (2009) The role of propagule pressure in biological invasions. Annu Rev Ecol Evol Syst 40:81 102
Smith O, Wang J (2014) When can noninvasive samples provide sufficient information in conservation genetics studies? Mol Ecol Resour 14:1011 1023
Tepolt CK, Darling JA, Bagley MJ, Geller JB, Blum MJ, Grosholz ED (2009) European green crabs (Carcinus maenas) in the northeastern Pacific: genetic evidence for high population connectivity and current mediated expansion
from a single introduced source population. Divers Distrib 15:997 1009
Thibault I, Bernatchez L, Dodson JJ (2009) The contribution of newly established populations to the dynamics of range expansion in a one dimensionalfluvial estuarine system: rainbow trout (Oncor hynchus mykiss) in Eastern Quebec. Divers Distrib 15:1060 1072 Waples RS, Gaggiotti O (2006) What is a population? An empirical evaluation of some genetic methods for identifying the number of gene pools and their degree of connectivity. Mol Ecol 15:1419 1439
Yu X, He T, Zhao J, Li Q (2014) Invasion genetics of Chromolaena odorata (Asteraceae): extremely low diversity across Asia. Biol Invasions 16:2351 2366
Zhang B, Edwards O, Kang L, Fuller S (2014) A multi genome ana lysis approach enables tracking of the invasion of a single Rus sian wheat aphid (Diuraphis noxia) clone throughout the New World. Mol Ecol 23:1940 51
Zhou H X, Zhang R M, Tan X M, Tao Y L, Wan F H, Wu Q et al. (2015) Invasion genetics of woolly apple aphid (Hemiptera: Aphididae) in China. J Econ Entomol 108:1040 1046
Zhu BR, Barrett SCH, Zhang DY, Liao WJ (2017) Invasion genetics of senecio vulgaris: loss of genetic diversity characterizes the invasion of a selfing annual, despite multiple introductions. Biol Invasions 19:1 13