HAL Id: hal-03020416
https://hal.archives-ouvertes.fr/hal-03020416
Submitted on 24 Nov 2020HAL is a multi-disciplinary open access
archive for the deposit and dissemination of sci-entific research documents, whether they are pub-lished or not. The documents may come from teaching and research institutions in France or abroad, or from public or private research centers.
L’archive ouverte pluridisciplinaire HAL, est destinée au dépôt et à la diffusion de documents scientifiques de niveau recherche, publiés ou non, émanant des établissements d’enseignement et de recherche français ou étrangers, des laboratoires publics ou privés.
Decrease in social cohesion in a colonial seabird under a
perturbation regime
Meritxell Genovart, Olivier Gimenez, Albert Bertolero, Rémi Choquet, Daniel
Oro, Roger Pradel
To cite this version:
Meritxell Genovart, Olivier Gimenez, Albert Bertolero, Rémi Choquet, Daniel Oro, et al.. Decrease in social cohesion in a colonial seabird under a perturbation regime. Scientific Reports, Nature Publishing Group, 2020, 10 (18720). �hal-03020416�
1
Decrease in social cohesion in a long-lived species under a perturbation
1
regime
2
Genovart, M.
a,b *, Gimenez, O.
c, Bertolero, A.
d, Choquet, R.
c, Oro, D.
a,b,
3
Pradel, R.
c4 5 6
a CEAB (CSIC), Accés Cala Sant Francesc 14, 17300 Blanes, Spain
7
b IMEDEA (CSIC-UIB), Miquel Marquès 21, 07190 Esporles, Spain
8
c CEFE, CNRS, Univ. Montpellier, Univ. Paul Valéry Montpellier 3, EPHE, IRD,
9
34293 Montpellier, France 10
d Associació Ornitològica Picampall de les Terres de l’Ebre, 43580 Deltebre, Spain
11 12
* Corresponding author: m.genovart@csic.es
13 14 15
2 Abstract
16
1. Environmental perturbations may have a strong impact on the dynamics of a 17
population and their understanding may help to mitigate the effects of global 18
change. In social animals, social interactions can influence behavioural 19
processes and can play an important role on populations’ resilience. However 20
little is known about the effects of perturbations on the strength of social 21
cohesion that keep group-living animals connected. 22
2. To explore the strength of social cohesion and its dynamics under perturbations, 23
we studied an ecological system involving a colonial, long-lived species living 24
in a site experiencing a shift to a perturbed regime. This regime, caused by the 25
invasion of predators, led an Audouin’s gull Larus audouinii colony to hold 26
from 70% to only 3% of the total world population in only one decade (32% 27
mean annual decline). Birds breed aggregated in discrete and annually changing 28
patches within colonies, which allowed us to disentangle whether annual 29
aggregations were random or resulted from social ties among individuals. Our 30
goals were 1) to uncover if there were long-term social ties between individuals 31
and 2) to examine whether the perturbation regime affected social cohesion. 32
3. We explored social cohesion by means of contingency tables and by modeling 33
interdependencies among observations within the Social Network Analysis 34
framework, using additive and multiplicative effects (AME) and accounting for 35
missing data. We analysed 25 years of monitoring with an individual capture-36
recapture database of more than 3,500 individuals. 37
4. We showed that there are social ties between individuals over the years. 38
Furthermore, social cohesion strongly decreased after entering the perturbation 39
regime. We propose that sociality and individual behavioural heterogeneity play 40
3
a major role driving dispersal between sites and thus population dynamics in 41
social animals. 42
5. Perturbations may lead not only to changes in individuals’ behaviour and fitness 43
but also to a change in populations’ social cohesion. The demographic 44
consequences of the breaking down of social ties are still not well understood, 45
but they can be critical for population dynamics of social species. Further studies 46
considering individual heterogeneity, sociality and different types of 47
perturbations should be carried out to improve our understanding on the 48
resilience of social species. 49
50
Keywords: Audouin’s gull, colonial species, decision-making, non-linear response, 51
perturbations, resilience, social cohesion, social network analyses. 52
4 Introduction
53
Ecosystems are subject to perturbations, both natural and human induced, affecting 54
individuals, populations and communities. When they are strong or are maintained 55
through time, these perturbations may cause a shift between stable states at the level of 56
both individual and population and even lead to population collapses and extinctions 1,2.
57
Understanding how individuals and populations will respond to these perturbations is 58
critical both from a ‘pure’ ecological standpoint and also from an applied point of view 59
to mitigate the effects of global change 3–5. Population dynamics may be directly
60
affected by these perturbations through a decrease in demographic parameters such as 61
survival or fecundity, or by a change, immediate or delayed, on individual behaviour, 62
such as an increase in dispersal 6. We define population resilience as the maximal pulse
63
perturbation a population can tolerate or absorb without going extinct 1,7. In social
64
animals, social behavioural processes, such as information sharing and decision-65
making, add another dimension to understanding the resilience of populations facing 66
perturbations. For instance, the amount of social information can be enhanced not only 67
by positive density-dependence, but also by social cohesion 8–11. Social cohesion favor
68
the exchange of private information and consequently reduce uncertainty in resource 69
acquisition (e.g. shelter against predators, food, mates) or in decision-making in the face 70
of disturbances, such as dispersal to non-perturbed or less perturbed sites 6,12–14. Thus,
71
the structure of a group may affect social interactions, information transfer, and 72
collective decisions 15. Some recent studies also show that spatial cohesion may be risk
73
sensitive, and that responses may differ depending on the risk and the social group 16.
74
However, little is known about the effects of environmental perturbations on the 75
cohesion of social groups in empirical studies of social animals 17.
5
The analysis of social relationships in animal populations may include a range of social 77
dynamics, from simple and ephemeral contacts, to permanent and strong bonds between 78
individuals 11,18–20. Coloniality is a life-history strategy where individuals show a social
79
link among conspecifics by breeding in large and dense groups 21,22. However, many
80
colonial species are philopatric, thus this link may not necessarily reflect individual 81
social ties but a shared tendency to breed in the same birthplace. This tendency may 82
result from the need to share information about resources, especially when they are 83
patchy and more unpredictable, or it may result from the advantages of social defence 84
against predators 23,24. A challenge lies in disentangling whether annual association
85
between individuals is only due to philopatry, or also due to the existence of a social ties 86
within groups of individuals over time 25. Social ties between neighbouring pairs in
87
breeding colonies are rarely considered in behavioural and ecological studies 26 and, if
88
true, such associations may suggest the evolution of social cohesion for exploiting the 89
evolutionary advantages of social living (including social information sharing) for 90
individual fitness prospects. 91
Social network theory, which originated in sociology to study human relationships and 92
social organization 9,27,28 now provides both a conceptual framework and the analytical
93
tools to explore social cohesion and social processes in animal populations 29–33.
94
Network theory is now being simultaneously developed in a number of fields, including 95
statistical physics, sociology, molecular biology, and computer science. As a result, the 96
field is changing at a rapid pace. While not all developments can or should be applied 97
toward the study of animal societies 34, this rush of novel ideas from outside disciplines
98
is enriching behavioural ecology 35.
99
To assess the existence of social cohesion and its dynamics under perturbations, we 100
studied an ecological system involving a colonial, social vertebrate (the Audouin’s gull 101
6
Larus audouinii) living in a site experiencing a shift to a perturbed regime. Interestingly 102
from a social point of view, the species breeds aggregated in spatially-discrete patches 103
within large colonies. Each breeding season, some patches go extinct and some are 104
colonized 36, forcing individuals to breed in patches different from the ones they were
105
born in or they bred in the previous year. These colonization-extinction processes may 106
allow us to disentangle whether social aggregation among individuals is an annual 107
random association, or it rather results from social cohesion among individuals over the 108
years. 109
An extensive long-term individual monitoring program has been carried out since 1988 110
at the Ebro Delta, including the main breeding site for the species, the Punta de la 111
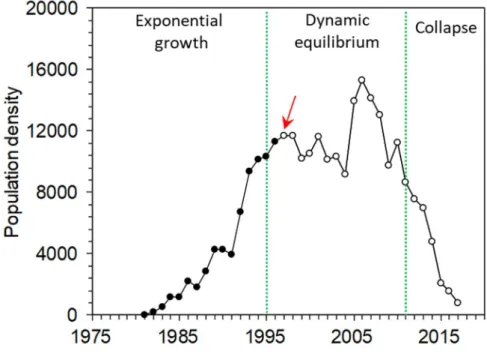
Banya 37. At the study site, population dynamics has undergone different phases: an
112
initial growing phase after site colonization, a stable phase of dynamic equilibrium, and 113
a final transition phase to population collapse 17,38 (Figure 1). This collapse was due to
114
the arrival of terrestrial predators, and led this colony to hold from 70% to only 3% of 115
the total world population in only a decade (32% mean annual decline) 36,37 (Figure 1).
116
Most predators were foxes, but also badgers and other mesocarnivores. Predators 117
invaded the site likely due to their increasing densities in recent decades 39 and the
118
attractiveness of the site in terms of food availability and lack of competition. The 119
perturbation regime caused changes in the spatial distribution of patches at the site, 120
changes in age structure, decrease in fecundity and a progressively increase of dispersal 121
to other sites 6,36. The response of this population to predators has been not immediate
122
probably due to strong philopatry, high site-suitability inertia and social behavioural 123
processes, such as conspecific attraction 17. This raise in dispersal was caused by social
124
processes, as social copying 17, however it remains to assess how social cohesion among
125
individuals, if occurred, was affected by dispersal processes. One possibility is that 126
7
dispersal would broke social cohesion by individual heterogeneity in the willingness to 127
disperse 40. In contrast, social cohesion can be maintained over time when dispersal
128
occurs collectively at the scale of social groups to the same sites 25,41.
129
Taking advantage of the long-term monitoring of this long-lived species, the knowledge 130
of its population dynamics, and the use of tools recently developed in the Social 131
Network Analysis (SNA) framework, we specifically addressed the following 132
questions: 1) is there any long-term social ties between individuals breeding in the same 133
patch? and 2) have perturbations, in this case a perturbation regime, affected social 134
cohesion? We finally discuss the role and consequences of social cohesion in population 135
dynamics and resilience in social species. 136
137
138
Figure 1. Number of breeding pairs in the Punta de la Banya colony from colonization 139
in 1981 to 2017. The observed phases in the population dynamics (growth, dynamic 140
equilibrium and collapse) are separated by green lines, which are identified by 141
chronological clustering analysis 38. Red arrow indicates the arrival of predators to the
8
colony (open dots for the time series). We compared the period 2002-2010 with the 143
period 2011-2017 corresponding to the dynamic equilibrium and collapse phases 144 respectively. 145 146 Results 147
We analysed a total of 1,610,922 dyadic interactions during the first period (2002-2011) 148
and 368,142 during the second period (2012-2017). 149
When assessing the social ties with the contingency table approach during the period of 150
stability, the assumption that breeding aggregations in Audouin’s gull were at random 151
was rejected, and those individuals that bred together during the sub-period 2002-2006 152
had a higher probability of breeding together during the sub-period 2007-2011 (𝜒 = 153
64.685, P < 0.0001). When randomly reducing sample size of the data set, results were 154
still statistically significant in more than 95% of the cases (1000 randomizations). 155
Accordingly, when assessing the social ties with dependent regression terms in the 156
AME function, we showed that the probability of breeding together during the second 157
sub-period (2007-2011) depended on whether they have bred previously together in the 158
first sub-period (2002-2006), with a statistically significant coefficient of regression 159
parameter (Table 1; Figure 2). When analysing this data set with permutated data, we 160
concluded that there was indeed a non-random association of individuals within the 161
patches, with our statistic being among the 5% extreme values. 162
When we analysed the social ties during the transition to collapse phase, we observed 163
that the probability of breeding together during the period 2012-2017 did not depend on 164
whether they have bred together the five previous years (χ2 =1.957, p-value = 0.162)
165
and we could not reject the hypothesis of a random association between individuals. In 166
addition, the SNA approach showed that breeding aggregations in Audouin’s gull 167
9
during the transition phase did not depend on whether they have bred together the five 168
previous years (Table 1; Figure 2). 169
170 171
Stable period Transition to collapse period pmean psd z-stat p-value pmean psd z-stat p-value intercept -1.467 0.087 - 16.808 0.000 -0.231 0.018 -12.629 0.000 .dyad 6.420 0.328 19.576 0.000 -0.004 0.022 -0.188 0.851 172
Table 1. Results of the AME regression function to test if there were social ties between 173
individuals while breeding during the stable period and during the transition phase to 174
collapse period. The alternative hypothesis is that individuals aggregate annually at 175
random for breeding. “.dyad”: coefficient of the dependent regression term considering 176
the previous dyadic relationship between individuals; “pmean”: posterior mean 177
estimate; “psd”: posterior standard deviation; “z-stat “: nominal z-score. 178
179 180
10
a) b)
181
b) Figure 2. Graphical representation of social networks by the association 182
between individuals of Audouin’s gulls in breeding patches comparing a) the 183
stability phase (2002-2011) and b) the transition phase to colony collapse (2012-184
2017) (see Figure 1). Each node represents an individual and each edge links 185
those individuals that have bred together in the same patch. We used the half-186
weight association index (HWI) to estimate the strength of relationship between 187
pairs of individuals an index more suitable when not all individuals within each 188
group have been identified 42,43.
189 190 191
Discussion 192
By studying a particular ecological system of a colonial long-lived species that 193
experiences a perturbation regime, we showed that social ties among individuals persist 194
over unperturbed years and that perturbations may decrease social cohesion in animal 195
populations. 196
11
The characteristic breeding behaviour of the study species that aggregates in patches 197
that change annually, allowed us to show that individuals do not annually breed 198
aggregated at random but rather there is some group stability, with individuals 199
establishing social ties that persist over time. Our study system resembles what it was 200
recorded for Slender-billed gulls (Chroicocephalus genei), a colonial breeder with weak 201
inter-annual breeding-site fidelity: some individuals bred together across breeding 202
seasons and some social groups showed tenacity despite the colony often moving every 203
year 41. Group stability can emerge as a product of network self‐organization, but may
204
provide the necessary conditions for the evolution of other social processes 44,45. Our
205
results would support the idea that social aggregation during breeding would provide 206
other advantages than the mere defence against predators 46,47, such as social
207
information sharing (e.g.48,49). Social information sharing is crucial for decision-making
208
in risky behaviours, such as dispersal, and previous studies showed that the perturbed 209
regime in our study site caused dispersal to other sites, including colonization of new 210
habitats 36,50. In our case study, sociality may have played a major role driving dispersal
211
and thus population dynamics, both during the exponential growth after colonization 212
and the collapse after the perturbation regime. This idea is also reinforced with a 213
mechanistic dynamical model that shows that population dynamics of Audouin’s gulls 214
at the study site can only be explained by dispersal runaway caused by social copying 215
17.
216
The importance of social information compared to private information increases under 217
perturbations, even when the quality of social information does not increase compared 218
to a non-perturbed regime 51,52. For instance, Maldonado et al. 53 show that experimental
219
disturbances applied to a social bird may impact its foraging efficiency by social 220
instability caused by the split of social groups. In colonial birds, breeding failure, which 221
12
is a proxy of environmental stress, may trigger splitting of the social groups (e.g. 41). At
222
demographic level, the alteration of social network structure may affect the behaviour of 223
populations. For instance, under stress conditions, sociality may operate through 224
feedback loops such as social copying for dispersal, causing non-linear population 225
dynamics and playing a critical role on the resilience of populations (e.g. 17). We
226
showed here that after a perturbation, not only the number of individuals in the 227
population may decrease (by increased mortality or dispersal) but also its social 228
cohesion, likely reducing but also altering the information transfer within the social 229
network composed by those individuals that remain in the site where perturbation 230
occurs. Among other demographic processes, dispersal may alter social connections of 231
both individuals remaining and those dispersing, with consequences for social network 232
structure 40. The perturbation regime suffered by the study population has likely
233
triggered a social transition 54 in collective behaviour from philopatric to dispersal and
234
with the fast diffusion of innovations such as the colonization of harbours by large 235
number of individuals, a habitat safe from predators never occupied before 50. Previous
236
studies have shown that responses of populations to perturbations may also depend on 237
individual personalities in the population 55–57. For example, dispersers are different
238
from non-dispersing individuals for a suite of phenotypic traits, including their 239
behavioural profile 58–60. Heterogeneities in personalities for dispersal decision-making
240
may have also played a role in our studied population, with most individuals dispersing 241
to other sites after a period of disturbance, while some individuals remaining 242
philopatric. This change may have also further consequences for social network 243
stability, as performance in social groups may improve with heterogeneity in individual 244
personalities 60,61.
13
Our study opens new research avenues about resilience of social populations under 246
perturbations; if perturbations affect social cohesion and heterogeneity in personalities 247
in the population, we may wonder whether this population would be equally resilient to 248
future perturbations. Additionally, in our study population, sociality seemed to operate 249
not right after the first perturbation episode but after cumulative maintained perturbation 250
50; would the type of perturbation, either pulse or in regime 62 influence the response of
251
social groups? We have shown here that a regime perturbation may decrease social 252
cohesion in animal populations, but further studies should be carried out to improve our 253
understanding on the demographic consequences of the breaking down of social ties 254
under perturbations for population dynamics and resilience in social species. 255
256
Material and Methods 257
Study species and study area 258
The Audouin’s gull is a long-lived seabird with more than 80% of the global population 259
breeding in the western Mediterranean 260
(http://www.iucnredlist.org/details/22694313/0;37. The species was critically
261
endangered until the early 80’s, when it colonized a new site, the Punta de la Banya in 262
the Ebro Delta (Figure 2). Here, the large availability of both suitable breeding habitat 263
and food resulted in a rapid and exponential growth, ending with the site holding more 264
than 70% of the total world population in 2006. The global population dynamics was 265
mainly driven by this colony and after the exponential growth, the species was 266
downgraded to a conservation category of “least concern” 63. However, the Punta de la
267
Banya colony is now collapsing and even if the species is colonizing new sites, the 268
global population is decreasing at a 5% annual rate 37. In 1997, first carnivores (mainly
14
foxes, but also badgers, beech martens and least weasels) arrived at Punta de la Banya, 270
and since then the site has been perturbed by the presence of carnivores. 271
Annual censuses of breeding pairs at every patch within colonies at the Ebro Delta area 272
have been carried out since colonization in 1981 to 2017 (Figure 1, 3 and Table S1). In 273
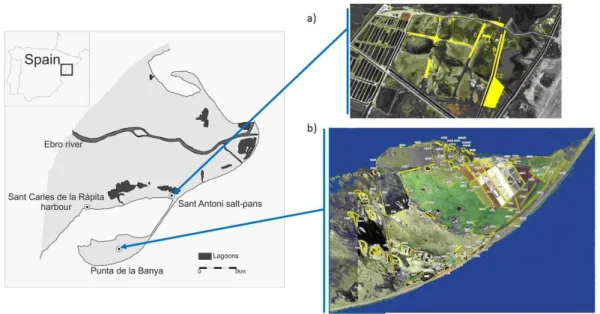
the Ebro Delta there are three colonies: Punta de la Banya, colonized in 1981 and 274
occupied throughout the study period, Sant Carles de la Ràpita harbour, occupied since 275
2011 to 2015, and Sant Antoni, occupied from 2013 up to now (Figure 3, Figure S1). 276
Within colonies, individuals are distributed in patches 64. As patch location may change
277
from one year to another, we annually geolocalized, mapped and defined the breeding 278
patches (Figure 3 and S2). 279
280
Figure 3. Map of the study area comprising the 3 main colonies and the distribution of 281
patches within colonies during the study period at a) Sant Antoni and b) Punta de la 282
Banya. Sant Carles de la Rápita colony is considered to have only one patch. 283
284
The species is monogamous, there is assortative mating by age, and from an 285
evolutionary point of view is a bet-hedger, laying commonly 3 eggs, although few 286
15
chicks survive, except in years with high food availability, when the strength of density-287
dependence is low 65.
288
Individual data 289
During 1988-2017 a total of 30,290 individuals were captured and ringed as chicks at 290
the Punta de la Banya 66,67. From 2002 to 2017, resightings were made using spotting
291
scopes from a distance all over the western Mediterranean with a total of 63,106 292
resights in the study area and 5,593 different individuals resighted. Each year we 293
recorded the breeding patch for each individual. To make sure that individuals were 294
breeding and that they did so in a particular patch, we only selected those individuals 295
seen during the breeding season in a particular patch showing unequivocal breeding 296
behaviour. Specifically, individuals making alarm calls, incubating eggs or with chicks. 297
After this selective filter, our final database included 3,548 individuals. 298
SNA framework 299
Our social network, defined as the observed pattern of breeding association, was 300
constructed taking individuals (N=3548) as the nodes of the network and each edge 301
dyad (i.e. pair of individuals) representing the fact that individuals breed in the same 302
patch. We ended with a global sociomatrix, i.e. the matrix representation of the dyadic 303
relationships among individuals, of 3,548* 3,548. Edges showed if two individuals bred 304
in the same patch at least once in a certain period (see below). The network was not 305
directional. Based on previous results on population dynamics, and on the population 306
size of this species and colony 37,50, we divided our dataset in two main periods: a period
307
defined as “stable phase” from 2002 to 2011, and a period of “transition phase to 308
collapse”, from 2012 to 2017 (Figure 1). 309
We used the recently developed AME function from the AMEN package 68,69, that can
310
be applied to binary, ordinal, and continuous network data. This new approach is a 311
16
random-effects regression model; uses an iterative Markov chain Monte Carlo (MCMC) 312
algorithm that provides Bayesian inference of the parameters in the social relations 313
regression model (SRM;70) using additive and multiplicative effects and combining the
314
linear regression model with the covariance structure of the SRM 69. The AME method,
315
not currently used in research on animal social networks is also able to cope with 316
missing and censored data, our data set complying with the assumption that individuals 317
are missing at random. Coping with missing data is highly relevant when analysing 318
sociality on wild populations, as detection rate for individuals is almost always 319
imperfect, and properly controlling for missed observations is a very important step in 320
social network analysis 71,72. To create and visualize our networks we used the packages
321
Amen 68, Asnipe 73, gdata 74 and igraph in R 75.
322
Are there social ties that persist over time? 323
We investigated if individuals create social ties that persist over time longer than one 324
breeding occasion by means of two approaches: i) contingency tables and ii) the 325
inclusion of time dependent regression terms in the AME modelling framework 68 (see
326
previous section). We used both methods because this is the first application of the 327
AME approach in an ecological context. We analysed data of the period of stability, 328
from 2002 to 2011, dividing this period into two sub-periods of five years (2002-2006 329
and 2007-2011). In the contingency table approach, we tested if the probability of 330
breeding together at least once during the second sub-period was independent of having 331
bred together at least once in the first period. We built a 3x3 table of frequencies, 332
showing the frequencies of two individuals breeding or not together at least once during 333
the second sub-period depending on whether they bred together or not at least once 334
during the first sub-period, and pulling apart those dyads with missing data. We then 335
tested for deviation of random frequencies by Chi Square test. 336
17
With the SNA approach, we analysed the social ties between individuals using the AME 337
function provided in the Amen package in R and including data from the first period 338
(five previous years) as predictors of association during the second sub-period. We 339
considered that this time window was not too large to include important death events, 340
but large enough to account for the imperfect detection of individuals. To achieve 341
convergence, we increased the number of iterations to 100,000 from the default value of 342
10,000 and lengthened the burn-in period to 500. 343
Had perturbations affected social cohesion in this species? 344
To assess if perturbations affected social structure in this species, we analysed as 345
previously, with both the contingency table approach and the SNA approach, the social 346
ties during the period of “transition phase to collapse” (2012-2017). To do so, we tested 347
if the probability of breeding together in this phase (2012-2017) was independent of 348
having bred together during five previous years (2007-2011). We then compared these 349
results from those previously observed during the “stability phase”. 350
A potential concern was the reduced power during the collapse period because the 351
number of individuals decreased from the stability period. In order to have a similar 352
power in both analyses, we performed the contingency table analysis during the stability 353
period by drawing at random a number of observed associations equal to the number of 354
observed associations during the collapse. We did this repeatedly (1000 times) and 355
calculated which percentage of times the resulting chi-square was significant at the 5% 356
level. 357
Regarding the SNA approach, it is advised 76 to do permutations on the raw data prior to
358
the analysis and compare the result of some relevant statistic obtained with the original 359
data to the distribution of the same statistic over the permutations. We chose the 360
regression coefficient of the association of a dyad on the previous association of the 361
18
same dyad as our statistic of social cohesion. This statistic is provided by the function 362
ame of the package amen 68. We calculated this statistic on the original data. Then,
363
within each year, we rearranged randomly the individuals among the patches, keeping 364
the same number of individuals within each patch. We did this 200 times and calculated 365
each time the regression coefficient. Then, we situated the value of the regression 366
coefficient from the original data among the distribution of regression coefficients from 367
the permutated data and examined how extreme it was. If it was among the 5% extreme 368
values, we concluded that there was indeed a non-random association of individuals 369
within the patches. 370
371 372
Acknowledgements 373
We would like to thank all the people who have helped with the fieldwork in the Ebro 374
delta over the years, particularly Julia Piccardo, Toni Curcó and the technical staff and 375
volunteers at the Ebro Delta Natural Park. We would also like to thank Peter Hoff, for 376
his advices and solving an analytical problem we encountered while using the AMEN R 377
package. We also thank the Regional Government of Catalonia, for permits to access 378
the study sites. Elisabeth Rochon corrected the English. Funding came from the Spanish 379
Ministry of Science (CGL2017-85210), grant PICS INTERACT n°07699 (2016, CSIC-380
CNRS). MG was partially supported by the European Union (MINOUW Project, 381
H2020-634495) and the Spanish Ministry of Science (CGL2017-85210). We have no 382
conflict of interest to declare. 383
384
Authors’ contributions 385
19
MG conceived the idea; MG, OG, RP and RC designed methodology; MG, DO and AB 386
collected the data; MG analysed the data; MG led the writing of the manuscript. All 387
authors critically contributed to the drafts and gave final approval for publication. 388 389 390 Data accessibility 391 392
Data is available via CSIC repository. 393
394 395
References 396
1. Dai, L., Korolev, K. S. & Gore, J. Relation between stability and resilience 397
determines the performance of early warning signals under different environmental 398
drivers. Proc. Natl. Acad. Sci. 112, 10056–10061 (2015). 399
2. Dakos, V., Carpenter, S. R., van Nes, E. H. & Scheffer, M. Resilience indicators: 400
prospects and limitations for early warnings of regime shifts. Philos. Trans. R. Soc. 401
B Biol. Sci. 370, 20130263–20130263 (2014). 402
3. Colchero, F. et al. The diversity of population responses to environmental change. 403
Ecol. Lett. (2018) doi:10.1111/ele.13195. 404
4. Coulson, T. et al. Data from: Modeling adaptive and nonadaptive responses of 405
populations to environmental change. (2017) doi:10.5061/dryad.4c117. 406
5. Donohue, I. et al. Navigating the complexity of ecological stability. Ecol. Lett. 19, 407
1172–1185 (2016). 408
6. Fernandez-Chacon, A. et al. When to stay, when to disperse and where to go: 409
survival and dispersal patterns in a spatially structured seabird population. 410
Ecography 36, 1117–1126, (2013). 411
7. Holling, C. S. Resilience and Stability of Ecological Systems. Annu. Rev. Ecol. Syst. 412
4, 1–23 (1973). 413
20
8. Barrett, L., Henzi, S. P. & Lusseau, D. Taking sociality seriously: the structure of 414
multi-dimensional social networks as a source of information for individuals. 415
Philos. Trans. R. Soc. B Biol. Sci. 367, 2108–2118 (2012). 416
9. Centola, D. How Behavior Spreads: the Science of Complex Contagions. (2018). 417
10. Firth, J. A. Considering Complexity: Animal Social Networks and Behavioural 418
Contagions. Trends Ecol. Evol. 35, 100–104 (2020). 419
11. Kerth, G., Perony, N. & Schweitzer, F. Bats are able to maintain long-term social 420
relationships despite the high fission-fusion dynamics of their groups. Proc. R. Soc. 421
B Biol. Sci. 278, 2761–2767 (2011). 422
12. Rosenthal, S. B., Twomey, C. R., Hartnett, A. T., Wu, H. S. & Couzin, I. D. 423
Revealing the hidden networks of interaction in mobile animal groups allows 424
prediction of complex behavioral contagion. Proc. Natl. Acad. Sci. 112, 4690–4695 425
(2015). 426
13. Snijders, L., Blumstein, D. T., Stanley, C. R. & Franks, D. W. Animal Social 427
Network Theory Can Help Wildlife Conservation. Trends Ecol. Evol. 32, 567–577 428
(2017). 429
14. Webber, Q. M. R. & Vander Wal, E. An evolutionary framework outlining the 430
integration of individual social and spatial ecology. J. Anim. Ecol. 87, 113–127 431
(2018). 432
15. Sueur, C. & Mery, F. Social Interaction in Animals: Linking Experimental 433
Approach and Social Network Analysis. (Frontiers Media SA, 2017). 434
16. LaBarge, L. R., Allan, A. T. L., Berman, C. M., Margulis, S. W. & Hill, R. A. 435
Reactive and pre-emptive spatial cohesion in a social primate. Anim. Behav. 163, 436
115–126 (2020). 437
21
17. Oro, D. Perturbation, social feedbacks, and population dynamics in social animals. 438
(Oxford Univerity Press, 2020). 439
18. Firth, J. A. & Sheldon, B. C. Experimental manipulation of avian social structure 440
reveals segregation is carried over across contexts. Proc. R. Soc. B Biol. Sci. 282, 441
20142350–20142350 (2015). 442
19. Genton, C. et al. How Ebola impacts social dynamics in gorillas: a multistate 443
modelling approach. J. Anim. Ecol. 84, 166–176 (2015). 444
20. Leu, S. T., Farine, D. R., Wey, T. W., Sih, A. & Bull, C. M. Environment modulates 445
population social structure: experimental evidence from replicated social networks 446
of wild lizards. Anim. Behav. 111, 23–31 (2016). 447
21. Brown, C. R. The ecology and evolution of colony-size variation. Behav. Ecol. 448
Sociobiol. 70, 1613–1632 (2016). 449
22. Rolland, C., Danchin, E. & de Fraipont, M. The evolution of coloniality in birds in 450
relation to food, habitat, predation, and life-history traits: a comparative analysis. 451
Am. Nat. 151, 514–529 (1998). 452
23. Clode, D. Colonially breeding seabirds: Predators or prey? Trends Ecol. Evol. 8, 453
336–338 (1993). 454
24. Hoogland, J. L. & Sherman, P. W. Advantages and Disadvantages of Bank Swallow 455
(Riparia riparia) Coloniality. Ecol. Monogr. 46, 33–58 (1976). 456
25. Shizuka, D. et al. Across-year social stability shapes network structure in wintering 457
migrant sparrows. Ecol. Lett. 17, 998–1007 (2014). 458
26. Brandl, H. B., Griffith, S. C., Farine, D. R. & Schuett, W. Wild zebra finches that 459
nest synchronously have long‐term stable social ties. J. Anim. Ecol. 1365-460
2656.13082 (2019) doi:10.1111/1365-2656.13082. 461
22
27. Moreno, J. L. Who shall survive?: A new approach to the problem of human 462
interrelations. (Nervous and Mental Disease Publishing Co, 1934). 463
doi:10.1037/10648-000. 464
28. Scott, J. Social Network Analysis. Sociology 22, 109–127 (1988). 465
29. Croft, D. P., James, R. & Krause, J. Exploring Animal Social Networks. (Princeton 466
University Press, 2008). 467
30. Farine, D. R. Structural trade‐offs can predict rewiring in shrinking social networks. 468
J. Anim. Ecol. 1365-2656.13140 (2019) doi:10.1111/1365-2656.13140. 469
31. Farine, D. R. & Whitehead, H. Constructing, conducting and interpreting animal 470
social network analysis. J. Anim. Ecol. 84, 1144–1163 (2015). 471
32. Ward, A. & Webster, M. Sociality: The Behaviour of Group-Living Animals. 472
(Springer International Publishing, 2016). 473
33. Whitehead, H. Analyzing Animal Societies Quantitative Methods for Vertebrate 474
Social Analysis. (2014). 475
34. James, R., Croft, D. P. & Krause, J. Potential banana skins in animal social network 476
analysis. Behav. Ecol. Sociobiol. 63, 989–997 (2009). 477
35. Hasenjager, M. J. & Dugatkin, L. A. Chapter Three - Social Network Analysis in 478
Behavioral Ecology. in Advances in the Study of Behavior (eds. Naguib, M. et al.) 479
vol. 47 39–114 (Academic Press, 2015). 480
36. Payo-Payo, A. et al. Predator arrival elicits differential dispersal, change in age 481
structure and reproductive performance in a prey population. Sci. Rep. 8, 1971 482
(2018). 483
37. Genovart, M., Oro, D. & Tenan, S. Immature survival, fertility, and density 484
dependence drive global population dynamics in a long-lived species. Ecology 99, 485
2823–2832 (2018). 486
23
38. Almaraz, P. & Oro, D. Size-mediated non-trophic interactions and stochastic 487
predation drive assembly and dynamics in a seabird community. Ecology 92, 1948– 488
1958 (2011). 489
39. Martínez‐Abraín, A., Jiménez, J. & Oro, D. Pax Romana: ‘refuge abandonment’ and 490
spread of fearless behavior in a reconciling world. Anim. Conserv. 22, 3–13 (2019). 491
40. Shizuka, D. & Johnson, A. E. How demographic processes shape animal social 492
networks. Behav. Ecol. arz083 (2019) doi:10.1093/beheco/arz083. 493
41. Francesiaz, C. et al. Familiarity drives social philopatry in an obligate colonial 494
breeder with weak interannual breeding-site fidelity. Anim. Behav. 124, 125–133 495
(2017). 496
42. Ginsberg, J. R. & Young, T. P. Measuring association between individuals or 497
groups in behavioural studies. Anim. Behav. 44, 377–379 (1992). 498
43. Cairns, S. J. & Schwager, S. J. A comparison of association indices. Anim. Behav. 499
35, 1454–1469 (1987). 500
44. Cantor, M. & Farine, D. R. Simple foraging rules in competitive environments can 501
generate socially structured populations. Ecol. Evol. 8, 4978–4991 (2018). 502
45. Cantor, M. et al. Animal social networks: revealing the causes and implications of 503
social structure in ecology and evolution. https://osf.io/m62gb (2019) 504
doi:10.32942/osf.io/m62gb. 505
46. Anderson, D. J. & Hodum, P. J. Predator Behavior Favors Clumped Nesting in an 506
Oceanic Seabird. Ecology 74, 2462–2464 (1993). 507
47. Oro, D. Colonial Seabird Nesting in Dense and Small Sub-Colonies: An Advantage 508
against Aerial Predation. The Condor 98, 848–850 (1996). 509
24
48. Gil, M. A., Hein, A. M., Spiegel, O., Baskett, M. L. & Sih, A. Social Information 510
Links Individual Behavior to Population and Community Dynamics. Trends Ecol. 511
Evol. 33, 535–548 (2018). 512
49. Lewanzik, D., Sundaramurthy, A. K. & Goerlitz, H. R. Insectivorous bats integrate 513
social information about species identity, conspecific activity and prey abundance to 514
estimate cost–benefit ratio of interactions. J. Anim. Ecol. 88, 1462–1473 (2019). 515
50. Payo-Payo, A. et al. Colonisation in social species: the importance of breeding 516
experience for dispersal in overcoming information barriers. Sci. Rep. 7, (2017). 517
51. Arganda, S., Pérez-Escudero, A. & Polavieja, G. G. de. A common rule for decision 518
making in animal collectives across species. Proc. Natl. Acad. Sci. 109, 20508– 519
20513 (2012). 520
52. Pérez-Escudero, A. & Polavieja, G. G. de. Adversity magnifies the importance of 521
social information in decision-making. J. R. Soc. Interface 14, 20170748 (2017). 522
53. Maldonado-Chaparro, A. A., Blumstein, D. T., Armitage, K. B. & Childs, D. Z. 523
Transient LTRE analysis reveals the demographic and trait-mediated processes that 524
buffer population growth. Ecol. Lett. 21, 1693–1703 (2018). 525
54. Pruitt, J. N. et al. Social tipping points in animal societies. Proc R Soc B 285, 526
20181282 (2018). 527
55. Dall, S. R. X., Houston, A. I. & McNamara, J. M. The behavioural ecology of 528
personality: consistent individual differences from an adaptive perspective. Ecol. 529
Lett. 7, 734–739 (2004). 530
56. Doering, G. N., Scharf, I., Moeller, H. V. & Pruitt, J. N. Social tipping points in 531
animal societies in response to heat stress. Nat. Ecol. Evol. 2, 1298–1305 (2018). 532
57. Wolf, M., van Doorn, G. S., Leimar, O. & Weissing, F. J. Life-history trade-offs 533
favour the evolution of animal personalities. Nature 447, 581–584 (2007). 534
25
58. Clobert, J., Le Galliard, J.-F., Cote, J., Meylan, S. & Massot, M. Informed dispersal, 535
heterogeneity in animal dispersal syndromes and the dynamics of spatially 536
structured populations. Ecol. Lett. 12, 197–209 (2009). 537
59. Cote, J., Clobert, J., Brodin, T., Fogarty, S. & Sih, A. Personality-dependent 538
dispersal: characterization, ontogeny and consequences for spatially structured 539
populations. Philos. Trans. R. Soc. B Biol. Sci. 365, 4065–4076 (2010). 540
60. Fogarty, S., Cote, J. & Sih, A. Social Personality Polymorphism and the Spread of 541
Invasive Species: A Model. Am. Nat. 177, 273–287 (2011). 542
61. O’Shea-Wheller, T. A., Masuda, N., Sendova-Franks, A. B. & Franks, N. R. 543
Variability in individual assessment behaviour and its implications for collective 544
decision-making. Proc. R. Soc. B Biol. Sci. 284, 20162237 (2017). 545
62. Nimmo, D. G., Mac Nally, R., Cunningham, S. C., Haslem, A. & Bennett, A. F. 546
Vive la résistance: reviving resistance for 21st century conservation. Trends Ecol. 547
Evol. 30, 516–523 (2015). 548
63. IUCN. Larus audouinii: BirdLife International: The IUCN Red List of Threatened 549
Species 2018: e.T22694313A132541241. (2018) doi:10.2305/IUCN.UK.2018-550
2.RLTS.T22694313A132541241.en. 551
64. Genovart, M., Jover, L., Ruiz, X. & Oro, D. Offspring sex ratios in subcolonies of 552
Audouin’s gull, Larus audouinii , with differential breeding performance. Can. J. 553
Zool. 81, 905–910 (2003). 554
65. Oro,D. Audouin’s gull account. in The Birds of Western Palearctic (ed. 555
Ogilvie,M.A.) 47–61 (Oxford University Pres, 1998). 556
66. Genovart, M., Pradel, R. & Oro, D. Exploiting uncertain ecological fieldwork data 557
with multi-event capture-recapture modelling: an example with bird sex assignment. 558
J. Anim. Ecol. 81, 970–977 (2012). 559
26
67. Oro, D., Tavecchia, G. & Genovart, M. Comparing demographic parameters for 560
philopatric and immigrant individuals in a long-lived bird adapted to unstable 561
habitats. Oecologia 165, 935–945 (2010). 562
68. Hoff, P. D. Additive and multiplicative effects network models. ArXiv180708038 563
Stat (2018). 564
69. Minhas, S., Hoff, P. D. & Ward, M. D. Inferential Approaches for Network 565
Analyses: AMEN for Latent Factor Models. ArXiv161100460 Stat (2016). 566
70. Warner, R. M., Kenny, D. A. & Stoto, M. A new round robin analysis of variance 567
for social interaction data. J. Pers. Soc. Psychol. 37, 1742–1757 (1979). 568
71. Gimenez, O. et al. Inferring animal social networks with imperfect detection. Ecol. 569
Model. 401, 69–74 (2019). 570
72. Hoppitt, W. J. E. & Farine, D. R. Association indices for quantifying social 571
relationships: how to deal with missing observations of individuals or groups. Anim. 572
Behav. 136, 227–238 (2018). 573
73. Farine, D. R. Animal social network inference and permutations for ecologists in R 574
using asnipe. Methods Ecol. Evol. 4, 1187–1194 (2013). 575
74. Warnes G.R. et al gdata: various R programming tools for data manipulation. R 576
package version 2.18.0. https://CRAN.R-project.org/package=gdata (2017) 577
75. Csardi, Gabor; Tamas N. The igraph software package for complex network 578
research. InterJournal (2006). 579
76. Farine, D. R. A guide to null models for animal social network analysis. Methods 580
Ecol. Evol. 8, 1309–1320 (2017). 581