HAL Id: hal-00904897
https://hal.archives-ouvertes.fr/hal-00904897
Submitted on 10 May 2019
HAL is a multi-disciplinary open access archive for the deposit and dissemination of sci-entific research documents, whether they are pub-lished or not. The documents may come from teaching and research institutions in France or abroad, or from public or private research centers.
L’archive ouverte pluridisciplinaire HAL, est destinée au dépôt et à la diffusion de documents scientifiques de niveau recherche, publiés ou non, émanant des établissements d’enseignement et de recherche français ou étrangers, des laboratoires publics ou privés.
Multiresolution X-ray CT Imaging of Fiber Reinforced
Composite Materials
Marius Costin, Samuel Legoupil, Delphine Lazaro-Ponthus, Valerie
Kaftandjian
To cite this version:
Marius Costin, Samuel Legoupil, Delphine Lazaro-Ponthus, Valerie Kaftandjian. Multiresolution X-ray CT Imaging of Fiber Reinforced Composite Materials. International Symposium on Digital Indus-trial Radiology and Computed Tomography, Jun 2011, Berlin, Germany. pp.Mo 4.2. �hal-00904897�
Multiresolution X-ray CT Imaging of Fiber
Reinforced Composite Materials
Marius COSTIN*, Samuel LEGOUPIL*,
Delphine LAZARO-PONTHUS** and Valérie KAFTANDJIAN***
*
CEA, LIST, LITT, 91191 Gif-sur-Yvette, France
**
CEA, LIST, LM2S, 91191 Gif-sur-Yvette, France
***
INSA Lyon, CNDRI, 69621 Villeurbanne, France
Abstract. We present an X-ray CT imaging method adapted to complex samples
such as fiber reinforced composites, for which different spatial resolutions are needed to resolve the structures at different size scales: the whole sample, groups of fibers, individual fibers and matrix material. We developed an efficient algorithm which uses two sets of tomographic data acquired in a zoom-in CT configuration and which outputs a bi-resolution image.
The method was validated on simulated data and we present experimental results for two different samples.
1. Introduction
The characterization of fiber reinforced composites is primordial in the development phase especially when new manufacturing techniques and new materials are used. Optical techniques are normally employed for their characterization, but these are destructive and may be time consuming. The use of X-ray computed tomography (CT) for the 3D characterization is a good alternative because it is a fast and non-destructive technique. But the direct use of industrial X-ray CT devices may not give the expected results because of the high complexity of the samples with details of different sizes.
We developed a method which adapts the acquisition and the reconstruction so that we recover a multiresolution image which permits a more accurate analysis for a region of interest (ROI) since it has a higher spatial resolution. The next section details our approach together with the reconstruction algorithm and in section 4 we present experimental results for two samples.
2. Method
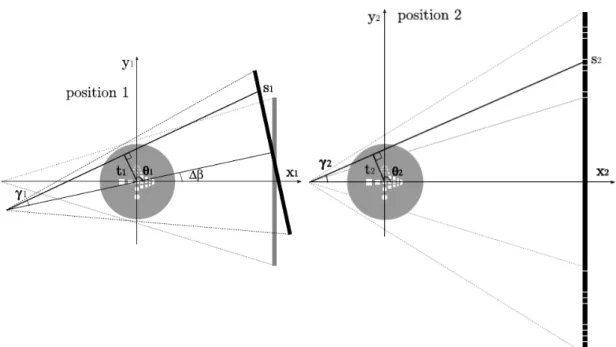
In a zoom-in CT setup [1-4] we acquire two sets of projection data which we denote P1 and P2 respectively. The two positions and the notations used in the following are indicated in
fig. 1.
International Symposium on
Fig. 1. Notations for the two acquisition positions in a zoom-in setup.
2.1 The Approximate Single Detail Image Reconstruction(ASDIR) algorithm
Our reconstruction algorithm [4] employs the filtered back-projection (FBP) idea and consists of four steps:
#1 Sinogram creation. By contrast to other approaches which combine the 2D
projections, we combine the two data sets by processing the sinograms denoted p1(β1,s1)
and p2(β2,s2) respectively. We build a larger sinogram which we denote by p and this
process can be considered as an extension of the truncated projections acquired at the zoomed position. Assuming a detector of N1 pixels, we create a virtual detector of N2
pixels, with N2 = zr·N1 and where zr represents the ratio between the magnification factors
at the two positions. The central part of the extended sinogram p is a point by point copy of the sinogram p2 while the exterior points are computed from p1 with relations derived with
geometrical arguments. The formula used to create the enlarged sinogram is:
2 2 ), , ( 2 ), , ( ) , ( 2 1 1 1 1 1 2 2 2 , 2 2 N s N s p N s s p s p s s (1) where 1 2 2 2 2 2 1 cos sin arcsin SO SO D d D (2) 1 2 2 1 cos sin arcsin tan SO SO SD D d D D s (3) and (4) . (5) 2 2 2 2 2 2 arctan 2 arctan SO SO D s D s 2
The extended sinogram is weighted and filtered similarly to the first part of the FBP algorithm.
#2 Wavelet transform of the sinogram. The second step consists of a
transformation of the extended sinogram with a 1D discrete wavelet transform (DWT) applied row-wise.
#3 Multiscale backprojections. The set of approximation wavelet coefficients
obtained in the previous step is backprojected and a first sub-image IA is obtained. A second
sub-image IROI is obtained by backprojecting the part of the extended sinogram
corresponding to the ROI.
#4 Final image recovery. In the last step we create the multiresolution image from the two sub-images from the previous step. We first create a 2D separable wavelet decomposition by using IA and by setting the detail coefficients to zero. This image is
transformed with a 2D inverse DWT and the second sub-image is superposed at the position of the ROI.
2.2 Algorithm validation
We validated our approach on simulated data generated with CIVA 10 [5] with two CAD objects. The spatial resolution was estimated on the reconstructed images inside and outside the ROI and corresponds to the expectations. The systematic error due to the approximations made in the combination of the sinograms is very small. A detailed analysis was performed with noisy data and the result was that the systematic error is insignificant compared to the photonic noise.
3. Results on experimental data
We present our results for two objects, both samples of fiber reinforced composites. We performed only a basic analysis of the reconstructed images in order to prove the capabilities of our method.
3.1 Samples
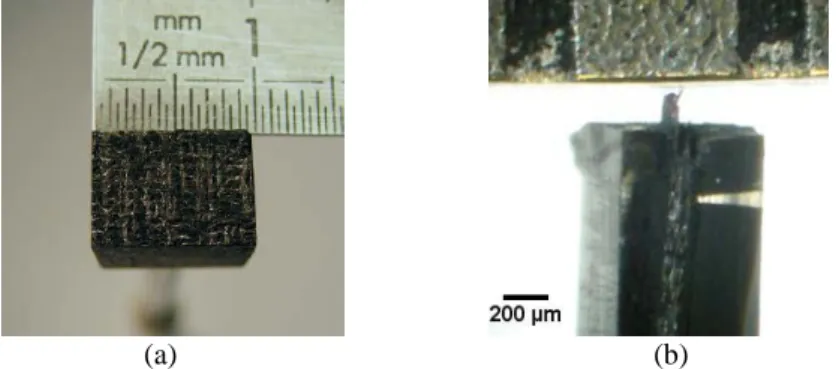
The first sample denoted “SN1” and displayed in Fig 1(a) is a parallelepiped measuring 10.0×11.2×7.2 mm with an average density of 1.73 g/cm3. It is a material made of coated carbon fibers in a ceramic matrix.
(a) (b) Fig. 2. (a) SN1 sample; (b) Sa sample.
The second sample referred as “Sa” is a tissue of carbon fibers reinforced with a matrix made of SiC nanoparticles. The fibers have a diameter of 7 μm and they are packed in so called tows of about 2000 fibers each. The tows are woven in a multi-layer interlacing
arrangement. The imaged sample displayed in Fig 1(b) was fixed in a resin and cut into a parallelepiped of 0.60×0.75×3.45 mm and its average density amounts to 1.29 g/cm3.
3.2 X-ray CT systems
Since the two samples contain details of different sizes and in order to test our method on various systems, we used two CT devices depicted in fig. 3. The SN1 sample was imaged on a micro-CT device consisting of a microfocus X-ray generator (FXE-160.50), a precision turntable and a flat-panel detector consisting of a photodiode array coupled to a CsI scintillator. Its size is about 12×12 cm and the nominal pixel size is 50 μm.
The second device is a nanotomograph (Skyscan 2011) composed of a sub-micrometer X-ray source, a very high precision turntable and an intensified CCD detector of 1280×1024 pixels of 10 μm.
(a) (b) Fig. 3. (a) Micro-CT; (b) Nano-CT.
3.3 Experimental results and analysis
The SN1 sample was imaged with the micro-CT system at an accelerating voltage of 60 kV. A number of 360 projections were acquired at the first position for which the magnification factor was 5 and 1440 projections at the second position with a magnification factor of 20. The projections were cropped to 1536×512 pixels and hence the complete reconstructed volume was 6144×6144×512 voxels of 2.5 μm in size. The ROI was centered and had a diameter of 3.84 mm. With these parameters the voxel-to-object ratio computes to 1:4880.
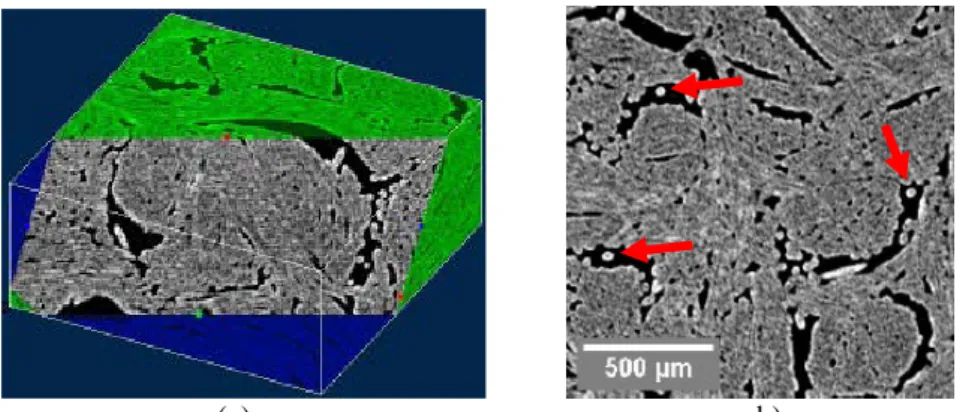
The ASDIR reconstruction was very good, the sharp images inside the ROI enable to identify singular or groups of fibers as exemplified with arrows in Fig 2(b).
(a) b)
Fig. 4. ASDIR reconstruction of the SN1 sample: (a) oblique cut through the volume; (b) cropped CT slice inside the ROI.
We calculated the porosity as an area ratio for 32 CT slices of the reconstructed volume. It was calculated independently for the whole volume and it amounts to 17.9 ± 0.2% and for the ROI only its value was computed to 17.5 ±0.4 %. The good agreement between the two values proves that the low resolution is sufficient to estimate the porosity but smaller details such as fibers can only be analyzed at the higher spatial resolution obtained for the ROI.
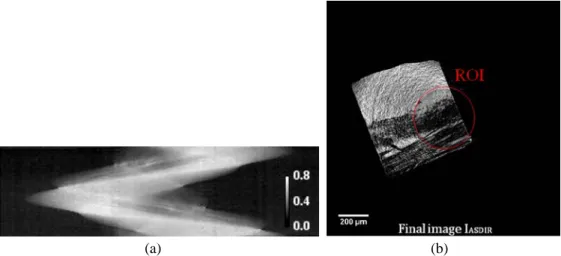
The Sa sample was imaged on the nano-CT device using an accelerating voltage of 40kV. As in the previous case 360 and 1440 projections were acquired but the magnification factors were 8.5 and 34 respectively. The effective area of a projection was 1280×256 pixels and the whole reconstructed volume was 5120×5120×256 voxels of 0.3 μm. The ROI had a diameter of 381 μm and because it was chosen off-centered, the voxel-to-object ratio had a smaller value than for the previous sample, with a value of about 1:3300.
(a) (b)
Fig. 5. ASDIR reconstruction of the Sa sample: (a) extended sinogram; (b) ASDIR image.
Because this sample vas fixed in a resin the obtained contrast is worse than for the SN1 sample. The smaller diameter of the carbon fibers and the manufacturing process makes this sample more difficult to image and analyze. We were able however to individualize independent fibers inside the ROI. The porosity was calculated similarly to the previous case over 32 CT slices. It amounts to 25.4% ±0.1% for the whole image and 37.7% ±1.0% for the high resolution region. This high difference is normal since the sample is non-homogenous and we deliberately chose a ROI with a lower filling of the matrix material. The output images can be used not only for the porosity computation but also for estimation of other parameters like the form factor or the orientation distribution.
4. Conclusion
We introduced an original approach for X-ray CT imaging of complex samples. The particularity of our approach stands in the combination of the two sets of data with an analytical formula and the subsequent wavelet processing which has several advantages. An important aspect is that we need to backproject only a fraction of the total points of the enlarged sinogram and therefore we are able to reconstruct very large volumes in a fast manner. Because the final image recovery is a fast operation and can be done on the fly, an important reduction of storage requirements can be obtained. Another important aspect is that our wavelet processing is equivalent to a low-pass filter and hence in the case of experimental data the noise is reduced. A limitation of our approach is that in this form the combination is performed on parallel planes and the reconstruction as a whole is only pseudo 3D.
The most important aspect is that with our method we obtained a voxel-to-object ratio of about 1:5000, which is about 5 times better than the ratio obtained with a standard industrial CT device. Moreover the algorithm is flexible and even higher ratios can be obtained by adjusting the acquisition parameters.
References
[1] I.K. Chun, My.H. Cho, S.C. Lee, Mi.H. Cho, and S.Y. Lee. X-ray micro-tomography system for small-animal imaging with zoom-in imaging capability. Phys. Med. Biol, 49:3889–3902, 2004.
[2] J. Wiegert, M. Bertramb, J. Wulff, D. Schäferb, J. Weeseb, T. Netschc, H. Schombergc, and G. Roseb. 3D ROI imaging for cone-beam computed tomography. International Congress Series, 1268:7–12, 2004. [3] G. Tisson, P. Scheunders, and D. Van Dyck. 3D region of interest X-ray CT for geometric magnification
from multiresolution acquisitions. In Proceedings of the 2004 IEEE International Symposium on BioMed. Imaging: From Nano to Macro, Arlington, VA, USA, pages 567–570, 2004.
[3] M. Costin, D. Lazaro-Ponthus, S. Legoupil, Ph. Duvauchelle, V. Kaftandjian. A 2D multiresolution image reconstruction method in X-ray computed tomography. Journal of X-Ray Science and Technology, 19(2):229-247, 2011.
[5] http://www-civa.cea.fr, 2011.