Original Article
Nephrology
Dialysis
Transplantation
T-lymphocyte activation in steroid-sensitive nephrotic syndrome in
childhood
T. J. Neuhaus
1'
4, V. Shah
2, R. E. Callard
3and T. M. Barratt
1-
4Divisions of 'Clinical Sciences (Medical Unit), 2Biochemistry and Genetics (Biochemistry Unit) and 3Cell and Molecular Biology (Cellular Immunology Unit), Institute of Child Health, London; and 4Renal Unit, Hospital for Sick Children, Great Ormond Street, London, UK.
Abstract. We undertook a sequential study in 29 chil-dren with steroid-sensitive nephrotic syndrome (SSNS) off treatment to seek evidence for T-cell activation in relapse. T-cell subsets and activation markers were analysed using two-colour flow cytometry. Soluble IL2 receptor (sIL2R) was measured in serum and urine by enzyme-linked immunosorbent assay (ELISA). Fifteen children were examined in remission and subsequent relapse (group A) and fourteen remained in remission (group B). In group A the proportion of CD4+ cells expressing the activation marker CD25 (alpha-chain of the IL2 receptor) increased significantly from remis-sion to relapse: CD4+25+ cells rose from 5.6 to 7.0% of total lymphocytes, and from 15.8 to 19.1% of CD4+ lymphocytes (paired t test: P< 0.0005 and < 0.001 respectively). No correlations were found between CD4+25+ cells and plasma albumin or cholesterol concentrations. SIL2R concentration in serum did not change in relapse, but increased significantly in urine from 272 to 592 U/mg creatinine (P<0.01). No signi-ficant difference was found in remission between groups A and B. We conclude that early relapse in SSNS is associated with activation of CD4+ (T-helper) cells which is not secondary due to the nephrotic state itself. Key words: child; steroid-sensitive nephrotic syndrome; T-lymphocyte activation
Introduction
Steroid-sensitive nephrotic syndrome and minimal-change nephrotic syndrome (MCNS) in childhood have been associated with several in-vivo and in-vitro abnormalities of T lymphocytes [1], including decreased delayed hypersensitivity [2] and reduced responsiveness of lymphocytes to mitogens [2,3]. Relapse may be triggered by a viral upper respiratory
Correspondence and offprint requests to: Thomas J Neuhaus MD,
University Children's Hospital, Steinwiesstr. 75, 8032 Zurich Switzerland.
tract infection or an allergic event, whereas measles infection, which is known to inhibit T-cell function [4], is associated with remission [5]. The clinical response of SSNS to immunosuppressive treatment is also further evidence for an immune pathogenesis.
Monoclonal antibodies have been used to identify T-cell activation and T-cell subsets in peripheral blood in relapse in SSNS, but with inconclusive results so far. Some authors found no changes (compared to patients in remission or normal controls) in CD2+/CD3+ (total T cells), CD4+ (T-helper cells) and CD8+ (cytotoxic/suppressor T cells) subsets [6,7], whereas others reported a decrease in CD3 + and CD4+ cells [8]. CD25 (or Tac) is the a-chain of the IL2 receptor; it is expressed on activated T cells and associ-ates with the beta and gamma chain to form the high affinity IL2 receptor [9]. CD25 showed a slight propor-tional increase in CD3 [10], but was unchanged in two other studies [7,8]. Expression of DR (MHCII) has been reported to be increased in CD8+ cells [8] and decreased in CD3+ and CD4+ cells [10]. Subsets of patients in remission off treatment did not differ significantly from controls [6,8]. Increased expression of CD25 has also been found on cultured and stimu-lated lymphocytes [11]. Elevated soluble IL2 receptor (sIL2R) has been recorded in various conditions associ-ated with immune activation [12]. In SSNS increased levels have been shown in serum and urine [13,14].
However, these studies in SSNS differed in design: some included patients both on and off treatment and only two studies examined changes sequentially in relapse and remission [10,13], the former showing increased CD3+25+ and CD4+L-selectin+ cells in relapse. A previous preliminary study from our unit, analysing different patients in different stages of SSNS, on and off treatment, had shown a slight increase in CD4+25+ lymphocytes and serum sIL2R in relapse [15]. Lymphocyte subsets vary considerably between individuals and are age-related [16]. Immunosuppressive treatment also affects the expres-sion of the surface markers and the composition of lymphocyte subsets [17,18].
We therefore designed a prospective trial to follow individual patients with SSNS off treatment sequen-tially in remission and in early relapse. The primary hypothesis to be tested was that CD4+ cells were activated in relapse, compared to remission, expressing CD25. Secondly we analysed other lymphocyte activa-tion markers and subsets.
Subjects and methods
Patients. SSNS was defined according to the International
Study for Kidney Disease in Childhood [19]. Children with a stable remission (>6 months) were considered for entry into the study. They were on maintenance treatment (cyclo-sporin A, levamisole or alternate-day steroids), which was due to be stopped to assess the tendency to relapse. Criteria for admission were: (I) normal plasma creatinine, (2) minimal-change histology (MCNS) if biopsy had been performed, (3) off cyclosporin A, levamisole and steroids for >2 weeks, (4) off cyclophosphamide for >6 months, and (5) no overt infection at time of investigation. Between November 1992 and January 1994, 260 patients with SSNS attended the Nephrotic Clinic. From this group, 29 children were eligible for the study. None of this group had been included in the previous study [15]. Informed consent was obtained. The patients were seen at intervals of 1-2 weeks, on five occasions, unless they relapsed earlier. If a relapse occurred (2 days^2+ proteinuria on dipstick testing and urine albumin/creatinine ratio >1.0mg/mg; normal <0.1), the child was investigated within the next 48 h (i.e. on day 3 or 4 after onset of proteinuria) to disentangle primary effects from possibly secondary effects related to the nephrotic state itself. Subsequently, standard relapse treatment with predni-solone was commenced. The study protocol was approved by the Ethical Committee of our hospital.
Surface phenotyping of peripheral blood lymphocytes using monoclonal antibodies. Peripheral blood was collected in the
morning in heparinized tubes and analysed within 4 h. The following lymphocyte subsets were analysed: CD19+ (B cells), CD3 + (total T cells), CD4+ (T-helper cells) and CD8 + (cytotoxic/suppressor T cells). On all T-cell subsets the fol-lowing markers were measured: CD25, DR and CD54 (ICAM-1: intercellular adhesion molecule 1) which are expressed on activated cells [20]; L-selectin (LAM-1: leuko-cyte adhesion molecule 1) reported to be decreased during activation [21]; CD45RA (naive T cells) and CD45RO (memory T cells) [20]. All antibodies except CD45RO (Serotec, Oxford, UK) and CD54 (Dako, Bucks, UK) were purchased from Becton-Dickinson (BD), Oxford, UK. Monoclonal antibodies labelled with either fluorescein isothi-ocyanate (FITC) or phycoerythrin (PE) were added to the heparinized whole blood. The cells were incubated with antibody for 10 min at room temperature, then the red blood cells were lysed with FACS Lysing Solution (BD). The cells were washed twice and analysed immediately using a FACScan flow cytometer. The lymphocyte population was gated using forward and 90 ° angle light scatter. Cells staining positive for FITC, PE or both were expressed as percentages using FACScan Lysis II analysis program (BD).
Serum and urine soluble interleukin 2 receptor (sIL2R).
SIL2R was measured using an ELISA test kit (Cellfree, T Cell Diagnostics, MA, USA). In addition sIL2R was ana-lysed in 11 age-matched healthy controls attending the Dental Clinic at our Hospital. The samples were stored at — 70 °C until required. The assay was performed according to the kit
manufacturer's instructions. In brief, a murine monoclonal antibody to human IL2R was precoated onto polystyrene microtitre wells. Standards and samples were added to the wells followed by addition of a horseradish-peroxidase con-jugated anti IL2R monoclonal antibody binding to a second epitope. Unbound components were removed by washing. O-phenylenediamine was added to the wells, the reaction was terminated by addition of sulphuric acid and absorbance read at 490 run. A standard curve was prepared from the IL2R standards and unknown values determined from the standard curve. The sensitivity of the assay was 24 U/ml. Cholesterol and triglyceride concentrations (Kodak Ektachem) were also measured.
Statistical methods. A paired t test was performed to
determine the significance of difference between the mean of results in remission and the result in relapse; the results were expressed as mean difference and 95% confidence interval. An unpaired / test was used to analyse the difference in the sIL2R data between patients and controls; the results were expressed as mean ± SD.
Results
Fifteen patients relapsed during the study with a mean urine albumin/creatinine ratio of 7.9 mg/mg. Their median age was 11.5 years (range 6.6-17.0); 12 were males and three females. At study entry they had been off treatment for a median period of 2 weeks (range 2-48) and had a median of 3 (range 1-5) investigations during remission. The last treatment had consisted of cyclosporin A (8 children), steroids (5), and levami-sole (2).
Lymphocyte subsets. There was no difference between
remission and relapse in CD3+ cells (68% versus 67.9), CD4+ (35.8% versus 37.1), CD8+ (35.1% versus 34.4) and CD19+ (17.3% versus 17.7). However, there was a highly significant increase in the proportion of CD4+ cells expressing CD25 in relapse (Table la; Figures la and lb). To test whether CD25 expression was gradu-ally increased in remission prior to relapse, we also compared the last investigation in remission with relapse (median interval 2 weeks): There was also a significant increase (Table lb). The sequential data of eight patients (all had at least three investigations in remission) are shown in Figures 2a and 2b. Comparing the first with the last investigation in remission (median interval 4 weeks), there was even a decrease: %CD4+25+ 6.4 versus 5.4, and %CD25+ per CD4+ 18.4 versus 14.0. However, there was again a significant increase in relapse: %CD4+25+ 6.9, and %CD25+ per CD4+ 18.9 (/><0.02 and <0.005 respectively).
In addition to CD25 we examined a range of other T-cell markers. The subsets CD3+25+ (5.8 versus 7.3), CD3+DR+ (4.6 versus 5.5), CD3+LAM1+ (36.7 versus 44.6), CD4+LAM1 + (20.8 versus 25.5) and CD8+DR+ (2.8 versus 3.5) showed a small but statist-ically significant (P<0.05) increase in relapse. All other subsets did not differ between remission and relapse (data not shown).
Soluble IL2 receptor. There was no difference in
serum between remission and relapse (713 + 505 U/ml versus 710 + 409 U/ml). However, there was a
signiric-1350
Table la. Expression of CD4+25+ in remission (mean of all investigations) and relapse (« = 15)
CD marker %4 + 25 + %25+ per 4 + 4+25+ (109/l) Mean of remission 5.6 15.8 0.140 Mean of relapse 7.0 19.1 0.167 Mean difference 1.4 3.3 0.027 95% Confidence interval 0.8-1.9 1.6-5.1 0.001-0.053 P < 0.0005 < 0.001 <0.05 (% 4+25 + : % of total lymphocytes; % 25+ per 4+; % 25+ of total CD4+).
Table lb. Expression of CD4+25+ in remission (last investigation) and relapse (« = 15)
CD marker %4+25 + % 25+ per 4 + 4+25+ (109/l) Mean of remission 5.5 14.9 0.130 Mean of relapse 7.0 19.1 0.167 Mean difference 1.5 4.2 0.037 95% Confidence interval 0.8-2.2 2.0-6.4 0.001-0.073 P < 0.0005 <0.001 <0.05 u-8 6 -4 2 Reiapse * A • 1 1 A y"^ — 1 1 • A • • / / ./lineofkfertrty • yy IVtean of Rerrission 1 1 (a) (b) 10 25 20 15 10 5 i FBapse A A yy / A • • • III , A • 1 1 yS line cf ictertrty fvtean of Ftem'sson 1 i 10 15 20 25 30
Fig. la. Percentage of CD4+25+ lymphocytes. Mean of remission
versus relapse. Last treatment: cyclosporin A • (n = 8), steroids A (n = 5), levamisole • (n = 2).
Fig. lb. Percentage of CD25+ per CD4+ lymphocytes. Mean of
remission versus relapse, (symbols, see Figure la).
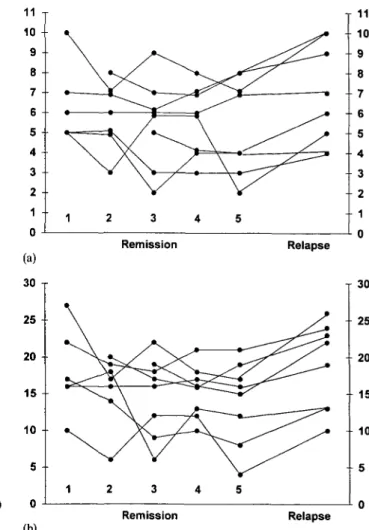
11 10 9 8 7 6 5 4 3 2 1 0 (a) 30 -r 25 20 15 10 5 0 (b) Remission Relapse Remission Relapse 11 10 9 8 7 6 5 4 3 2 1 0 30 25 20 15 10
Fig. 2a. Percentage of CD4+25+ lymphocytes. Sequential data in
remission (3-5 investigations) and relapse (M = 8).
Fig. 2b. Percentage of CD25+ per CD4+ lymphocytes. Sequential
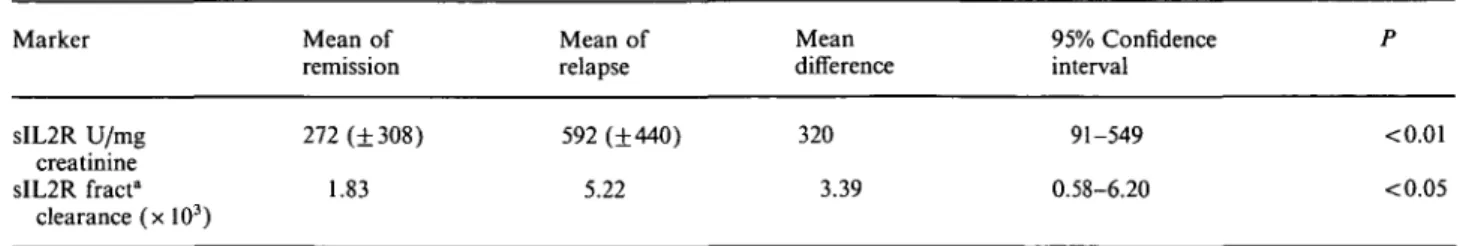
Table 2. Soluble IL2 receptor (sIL2R) in urine {n= 15) Marker Mean of remission Mean of relapse Mean difference 95% Confidence interval sIL2R U/mg creatinine sIL2R fracta clearance (x 103) 272 (±308) 1.83 592 (±440) 5.22 320 3.39 91-549 0.58-6.20 <0.01 <0.05
(SD in parentheses). "Fractional clearance: [urine sIL2R ( U / m l ) x plasma creatinine (mg/ml)]: [serum sIL2R ( U / m l ) x urine creatinine (mg/ml)].
ant increase in the urinary excretion (Table 2). There was a positive correlation between the fractional clear-ance of sIL2R and albumin (r = 0.56, P<0.05), but no correlation between serum or urine sIL2R and CD4+25+ cells. Serum and urine concentrations of sIL2R did not differ between patients in remission and controls (serum: 724 + 215 U/ml, urine: 360 + 372 U/mg creatinine).
Plasma lipids and albumin. These were also measured
as the changes in CD4+25+ might be secondary due to the nephrotic state itself. Mean cholesterol concen-tration (mmol/1) rose from 4.55 (normal range 3.1-5.4) to 6.86 in relapse (P<0.05), triglycerides were unchanged and mean albumin (g/1) dropped from 42 to 31 (P<0.005), though with only three patients in the 'nephrotic range' of < 25 g/1. There were no correlations between cholesterol or albumin and CD4+25+ T cells.
Patients in sustained remission. Fourteen patients
remained in remission during the study and had five investigations. There were no significant differences in the lymphocyte results for this group compared with the patients who subsequently relapsed: CD3+ 72.6%, CD4+ 39%, CD8+ 34%, CD4+25+ 5.4%, and CD25 + per CD4+ 14.2%). The sequential data for %>CD4+25+ are shown in Figure 3 (mean of first and last investigation: 5.6 and 5.4%> respectively). The treatment before study entry differed only in cyclospo-rin A (1/14 patients versus 8/15 of'relapsers'; P<0.05, Fisher's exact test), but not in steroids, levamisole, or cyclophosphamide (4, 7, and 2 patients, respectively).
Fig. 3. Percentage of C D 4+2 5+ lymphocytes. Sequential data in patients («=14) with sustained remission (five investigations).
Discussion
We performed a longitudinal study in SSNS to analyse T-cell activation. The proportion of CD4+ cells expressing the activation marker CD25 was increased in early relapse compared both with the mean of sequential investigations and with the last observation in remission, immediately prior to relapse. These find-ings indicate T-helper cell activation. The absolute changes were not large, but—by performing a paired, sequential study—the results were highly significant. The absolute lymphocyte count is often unreliable, and T-cell subset data is best expressed in percentages [22]. In remission, variability between patients was con-sistently greater than within patients. Therefore signi-ficant changes might be missed if different patients are analysed in remission and relapse. Immunosuppressive treatment reduces the number of circulating T lympho-cytes, with T cells more affected than B cells; in vivo studies with single-dose corticosteroids showed a tran-sient effect lasting less than 24 h [18]. All patients had been on long-term immunosuppression, but had been off treatment for at least 2 weeks when investigated. No significant adaptive changes in subsets (in particu-lar no increase in the expression of CD25) were observed during the sequential analysis in remission, which took on average 4 weeks, suggesting that there was no longer-lasting effect of the immunosuppression. Yet we cannot rule out an increase immediately before relapse as the last investigation in remission was (on average) 2 weeks before relapse.
Are these statistical changes of clinical significance? In SSNS, remission is induced and maintained by immunosuppressive treatment. Steroids and cyclospo-rin A inhibit the IL2/IL2R activation pathway [17,23]. Injection of supernatant from stimulated T lympho-cytes [24] or T lymphocyte hybridomas [25] from patients in relapse into rats induces transient pro-teinuria and loss of the glomerular polyanion. These clinical and experimental observations are consistent with our findings and suggest that activated T lympho-cytes are involved in the pathogenesis of SSNS.
This is the first study showing longitudinal data for sIL2R in remission and subsequent relapse, both in serum and urine. In contrast to previous studies, including one from our unit, we could not confirm increased serum concentrations of sIL2R [13,15]. All our patients were in early relapse and highly nephrotic,
demonstrating a significant urinary loss of sIL2R. This makes the interpretation of serum sIL2R inconclusive. Urinary sIL2R excretion was positively correlated with albumin excretion. SIL2R is smaller than albumin (molecular weight 35-46 kDa versus 66), but has almost the same pi (5.05 versus 4.9) [14]. Although the tubular handling of sIL2R is unknown, the urinary loss could be due to enhanced glomerular filtration. No correlation was found between serum sIL2R con-centration and the proportion of activated T helper cells (CD4+25+).
It has been suggested that some of the T cell altera-tions in SSNS are epiphenomena of the nephrotic state. Lipoproteins possess immunomodulatory properties in
vitro: At lower concentrations they induce T-cell
activa-tion with increased CD25 and DR expression [26], at higher concentrations they suppress mitogenesis [27]. The latter may explain (at least in part) the decreased blastogenic response in SSNS [2,3]. In relapse the plasma cholesterol was significantly raised, but only three patients had a plasma albumin in the nephrotic range; there were no correlations between albumin or cholesterol and CD4+25+ cells. It is therefore unlikely that the T-cell activation is caused by changes in albumin or lipids.
CD3 + , CD4+ and CD8+ subsets were similar in remission and relapse and were within the range of age-related controls [16]. The observed increases in CD3+25 +, CD3+DR+, and CD8+DR + cells in relapse are consistent with T cell activation, but these data need further confirmation. We analysed 22 lymphocyte subsets; this implies, apart from the primary hypo-thesis, a 0.68 probability (1-0.9522) of getting at least one spuriously significant result at the 5% level. In contrast to previous in-vitro data [21], but consistent with clinical data in SSNS [10], we found a rise in CD3+LAM1 + and CD4+LAM1 + during T-cell activa-tion in relapse.
We conclude that relapse of SSNS is associated with activation of CD4+ (T-helper) cells, expressing CD25. Our results suggest that this activation is not secondary due to the nephrotic state itself. However, the precise role of activated T-helper cells in the pathogenesis of SSNS is still unclear.
Acknowledgements. TJN was supported by the Karl Reiser and Heinrich Paur Fund, Zurich and by the Jubilaumsstiftung Rentenanstalt, Zurich.
References
1. Schnaper HW. The immune system in minimal change nephrotic syndrome. Pediatr Nephrol 1989; 3: 101-110
2. Fodor P, Saitiia MT, Rodriguez E, Gonzalez B, Schlesinger L. T-cell dysfunction in minimal-change nephrotic syndrome of childhood. Am J Dis Child 1982; 136: 713-717
3. Schulte-Wissermann H, Lemmel E-M, Reitz M, Beck J, Straub E. Nephrotic syndrome of childhood and disorder of Tcell function. Eur J Pediatr 1977; 124: 121-128
4. Joffe MI, Rabson AR. Dissociation of lymphokine production and blastogenesis in children with measles infections. Clin Immunol Immunopathol 1978; 10: 335-343
5. Blumberg RW, Cassady HA. Effect of measles on the nephrotic syndrome. Am J Dis Child 1947; 73: 151-168
6. Herrod HG, Stapleton FB, Trouy RL, Roy S. Evaluation of T lymphocyte subpopulations in children with nephrotic syndrome. Clin Exp Immunol 1983; 52: 581-585
7. Tejani A, Suthanthiran M, Pomrantz A. A randomized con-trolled trial of low-dose prednisone and ciclosporin versus high-dose prednisone in nephrotic syndrome of children. Nephron 1991; 59: 96-99
8. Fiser RT, Arnold WC, Charlton RK, Steele RW, Childress SH, Shirkey B. T-lymphocyte subsets in nephrotic syndrome. Kidney Int 1991; 40: 913-916
9. Taniguchi T, Minami Y. The IL-2/IL-2 receptor system: a current overview. Cell 1993; 73: 5-8
10. Kobayashi K, Yoshikawa N, Nakamura H. T-cell subpopula-tions in childhood nephrotic syndrome. Clin Nephrol 1994; 41: 253-258
11. Topaloglu R, Saatci U, Arikan M, Canpinar H, Bakkaloglu A, Kansu E. T-cell subsets, interleukin-2 receptor expression and production of interleukin-2 in minimal change nephrotic syndrome. Pediatr Nephrol 1994; 8: 649-652
12. Rubin LA, Nelson DL. The soluble interleukin-2 receptor: Biology, function and clinical application. Ann Intern Med 1990; 113: 619-627
13. Mandreoh M, Beltrandi E, Casadei-Maldini M, Mancini R, Zucchelli A, Zucchelh P. Lymphocyte release of soluble IL-2 receptors in patients with minimal change nephropathy. Clin Nephrol 1992; 37: 177-182
14. Bock GH, Ongkingco JR, Patterson LT, Ruley J, Schroepfer LR, Nelson DL. Serum and urine soluble interleukin-2 receptor in idiopathic nephrotic syndrome. Pediatr Nephrol 1993; 7: 523-528
15. Hulton SA, Shah V, Byrne MR, Morgan G, Barratt TM, Dillon MJ. Lymphocyte subsets and interleukin 2 receptor expression in childhood nephrotic syndrome. Pediatr Nephrol 1994; 8: 135-139
16. Erkeller-Yuksel FM, Deneys V, Yuksel B et al. Age-related changes in human blood lymphocyte subpopulations. J Pediatr 1992; 120: 216-222
17. Boumpas DT, Anastassiou ED, Older SA, Tsokos GC, Nelson DL, Balow JE. Dexamethasone inhibits human interleukin 2 but not interleukin 2 receptor gene expression in vitro at the level of nuclear transcription. J Clin Invest 1991; 87: 1739-1747 18. ten Berge RJM, Sauerwein RW, Yong SL, Schellekens PTA. Administration of prednisolone in vivo affects the ratio of OK.T4/OKT8 and the LDH-isoenzyme pattern of human T lymphocytes. Clin Immunol Immunopathol 1984; 39: 91-103 19. International Study of Kidney Disease in Children. Early
identi-fication of frequent relapsers among children with minimal change nephrotic syndrome. J Pediatr 1982; 101: 514-518 20. Akbar AN, Salmon M, Janossy G. The synergy between naive
and memory T cells during activation. Immunol Today 1991; 12: 184-188
21. Kanof ME, James SP. Leu-8 antigen expression is diminished during cell activation but does not correlate with effector func-tion of activated T lymphocytes. J Immunol 1988; 140: 3701-3706 22. Fahey JL. Doing it right: Measuring T cell subsets by flow
cytometry. Clin Immunol Immunopathol 1990; 55: 171-172 23. Emmel EA, Verweij CL, Durand DB, Higgins KM, Lacy E,
Crabtree GR. Cyclosporin A specifically inhibits function of nuclear proteins involved in T cell activation. Science 1989, 246: 1617-1620
24. Maruyama K, Tomizawa S, Shimabukuro N, Fukuda T, Johshita T, Kuroume T. Effects of supernatants derived from T lymphocyte culture in minimal change nephrotic syndrome on rat kidney capillaries. Nephron 1989; 51: 73-76
25. Koyama A, Fujisaki M, Kobayashi M, Igarashi M, Narita M. A glomerular permeability factor produced by human Tcell hybridomas. Kidney Int 1991; 40: 453-460
26. Frostegard J, Wu R, Giscombe R, Holm G, Lefvert AK, Nilsson J. Induction of T-cell activation by oxidized low density lipopro-tein. Arteriosclerosis 1992; 12: 461-467
27. Traill KN, Huber LA, Wick G, Jurgens G. Lipoprotein inter-actions with T cells: an update. Immunol Today 1990; 11:411-417 Received for publication: 24.8.94