Assessment of different sources of variation in the antibody responses to specific malaria antigens in children in Papua New Guinea
8
0
0
Texte intégral
(2) 580. INTERNATIONAL JOURNAL OF EPIDEMIOLOGY. The importance of both environmental and genetic factors influencing the regulation of humoral immune responses in general has been known for a long time.19–24 In malaria research, the majority of studies have been concentrated on associations between MHC genes and immune responses to specific malaria antigens.18,25–28 A limited number of twin studies also demonstrated genetic regulation of immune responses to specific malaria antigens in Liberia, Madagascar29 and The Gambia.30,31 In addition, family studies assessed the relative contribution of environmental in relation to genetic components in immune responses to specific malaria antigens in Papua New Guinea (PNG).(unpublished observations),32 Overall, most of these studies have concentrated on immune adults and on measures of immune responses at a single time point. Since children are the actual target group for vaccination and they suffer most from infection and disease, they should be included in such an analysis. Variability in the antibody acquisition may be just as relevant as variation in the final levels attained. In addition, examining longitudinal data would be useful since temporal individual variation in immune responses to specific malaria antigens has been demonstrated in children,33 but was small in adults. This study reports on the quantification of the relative contribution of environmental and genetic factors in the regulation of immune responses to specific malaria antigens, measured at different time points, in children. Variance component analysis was conducted in order to assess genetic and environmental components in the antibody responses and to estimate antibody variation over time within each individual. Estimates of variance components were then used to calculate heritabilities. In addition, inter- and intra-class correlations of antibody responses to specific malaria antigens within relative groups were assessed.. Materials and Methods Study area and population The data were collected and processed within the Malaria Vaccine Epidemiology and Evaluation Project (MVEEP) of the PNG Institute of Medical Research.34 This project is based in the Wosera area in the East Sepik Province of PNG, where malaria is highly endemic and transmitted throughout the year. Plasmodium falciparum, P. vivax and P. malariae are the common parasite species in this area. The malaria epidemiology of the study area has been described earlier.35,36 For this study, we analysed data from three cross-sectional surveys (October–November 1992, March 1993 and July 1993). There were no clear seasonal patterns to malaria transmission during this period. Within these surveys, blood samples were collected from 236 children aged between 0.5 and 15 years old in two adjoining study villages, Kunjingini 1 and Apusit, comprising all available children whose parents gave consent. The house of residence was recorded for each child. In addition, P. falciparum densities were assessed by microscopy and recorded as number of parasites per 200 white blood cells. Further details of field work are given by Al-Yaman et al.14 Structured questionnaires were used in order to gather information on genetic relationships in the study population of the MVEEP. All present and willing adults were asked about their first- and second-degree relatives. Validation of familial relationships of adults was conducted using HLA class I and II. information as stated previously.32 Additional interviews were performed in order to confirm the familial relationships between children and their parents in the study area. Therefore, all present parents were visited at their houses and asked again about the names and ages of their putative genetic children. This information was then cross-checked with data already available. Genetic relationships of only three children from two families did not match previous data. With additional questioning, they could be assigned to the appropriate families.. Malaria antigens Schizont extract was prepared from the FUP (FalciparumUganda-Palo Alto) strain as described earlier.12,14 RESA was a recombinant protein expressed in Escherichia coli as described in Al-Yaman et al.6 Three different recombinant proteins of MSP2— two full length constructs FC27 and 3D7 and one MSP2 (3D7) with the repetitive part deleted d3D7—were used as described previously.13 The parasite-derived MSP1 molecule and two recombinant antigens of MSP1, 195A and Bvp42 were used, which were described earlier.11,12,37,38 SPf66 was a synthetic peptide as described previously.28,39. Humoral responses Indirect enzyme-linked immunosorbent assays (ELISA) were performed in order to measure antibodies against schizont extract, MSP1, MSP2, RESA and SPf66 (description by AlYaman et al.6,11–14,39). Antibody units were assessed by comparison of optical densities measured at 405 nm with a standard curve derived from a twofold serial dilution of a standard hightitre serum pool. Detailed description of the prevalence and distributions of antibody responses has been given by Al-Yaman et al.6,11–14,39. Statistical analysis Prior to all analyses, normal score transformations40 were applied to all immune responses for each survey separately. Parasite density was log-transformed preceding all analysis. For descriptive purposes, the mean antibody responses were calculated for each individual over the three surveys, before assessing differences between sexes and villages and correlation with age, and parasite density. The effects of age, sex, village and parasite density were assessed by fitting an analysis of variance model to normalized data, allowing for repeated measurements on the same child with a random effect. In order to quantify the relative contribution of genetic and environmental factors in antibody responses to specific malaria antigens, variance component analysis was performed using the FISHER program.41 Hence, the overall variation in antibody responses against each antigen was partitioned into genetic and non-genetic variance. The genetic variance is the sum of the additive genetic (AV) and dominance variance (DV). Whereas the AV is the variation deriving from additive effects of individual alleles at one or more loci, the DV is the variation due to dominance deviation from additivity at the same locus.42 Dominance variance contributes only to relatives who share both alleles IBD (identical by descent).43 The non-genetic variance consists of the house variance (HV), within child variance (WCV) and the remaining non-genetic variance (NGV). The HV describes the variation in the antibody responses which is explained by living in the same house, and.
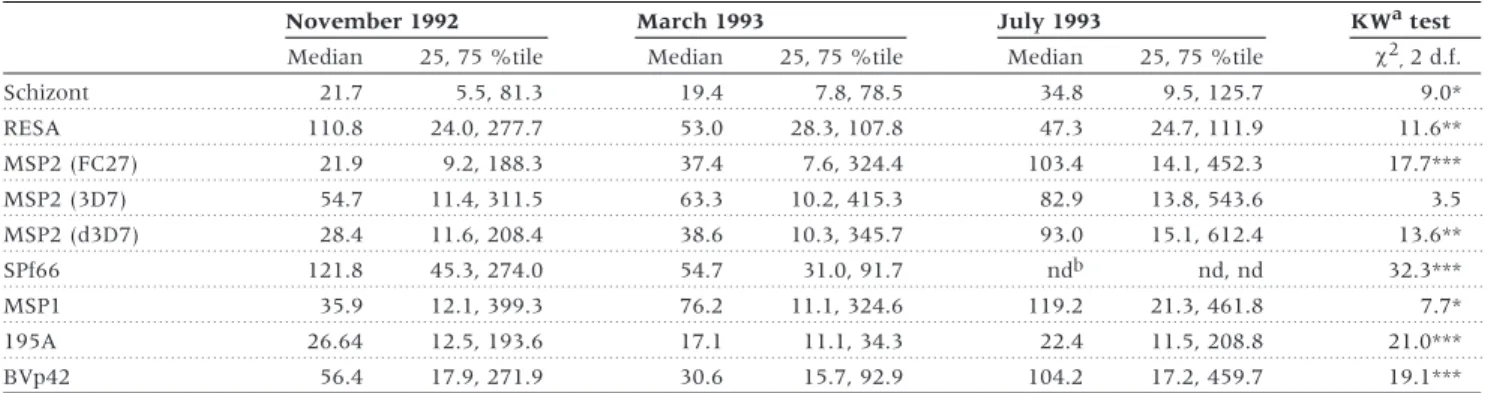
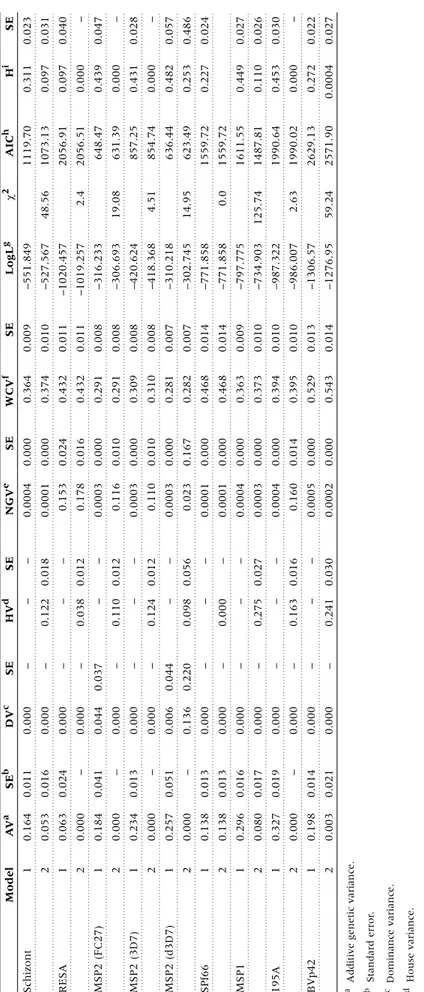
(3) VARIATION IN ANTIBODY RESPONSE TO MALARIA. is implemented into the variance component model as described previously.44 The variation in the antibody responses against a specific antigen between surveys is quantified by WCV. Preceding variance component analysis data were corrected for age, village and parasite density using multiple regression for each trait separately. The measured antibody responses of each survey were treated as three separate traits, which were analysed at the same time. To assess the goodness-of-fit, likelihood ratio tests (LRT) were performed between two models, as minus twice the difference of the log-Likelihood (lnL). The degrees of freedoms (d.f.) for the LRT statistic is defined as the difference in the number of estimated parameters in the two models. In addition, Akaike’s information criterion (AIC)45 was calculated as AIC = –2ln(L) + 2 (no. of parameters) where the smallest AIC represents the most parsimonious model. Broad sense heritabilities were then calculated as the proportion of genetic variance and total phenotypic variance as follows: (AV + DV)/(AV + DV + HV + BCV + WCV). The asymptotic standard errors (SE) of the heritability were estimated according to formulae described elsewhere.46 Familial correlations were estimated using the FCOR procedure with equal weight to pairs of the statistical software SAGE (Statistical Analysis for Genetic Epidemiology).47 For this analysis, we used the adjusted expected values of antibody. Table 1 Number of relative pairs used in variance component analysisa Kinship. No. of pairs. No. of pairs living in the same house. Full sibs. 0.25. 191. 183. Half sibs. 0.125. 13. 7. Avuncular. 0.125. 8. 7. 0.0625. 327. 0. 539. 197. Types of relatives. Cousins TOTAL no. of pairs. The number of relative pairs refers to the numbers of pairwise combinations of children of the same family who had immunological data, and which could therefore be included in the analyses. a In this analysis only relative pairs were used where each relative had. responses measured for all three surveys. For the total number of relative pairs present see Table 5.. 581. responses out of the variance analysis adjusted for repeated measurements (see first paragraph of this section). The data were adjusted for age, village and parasite densities. The significance levels of the correlation coefficients were assessed from formulae described by Zar.48. Results Overall, 34 distinct families were constructed, using information on parents, grandparents and great-grandparents of the children. The number of children assessed per family varied from 2 to 25, while three families had only one child assessed. The number of informative relative pairs, which have immune responses measured for all three surveys and have house numbers assigned, are listed in Table 1. Some 36.5% of all relative pairs lived in the same household. The majority of these relative pairs were full-sib pairs and none of them were cousin pairs (Table 1). The distributions of the antibody responses against different malaria antigens for each survey are summarized in Table 2. Antibody responses varied within and between surveys depending on the antigen. The median antibody responses against schizont extract, all MSP2 antigens and MSP1 increased from November 1992 to July 1993, but decreased for antibody responses against RESA and SPf66. The antibody responses against 195A and BVp42 were higher in November and July than in March. Overall, antibody responses differed significantly between the surveys, except for the antibody response against MSP2 (3D7) (Table 2). The effect of age, sex, village and parasite densities on antibody responses against the specific malaria antigens (Table 3) was assessed, in order to determine which of the covariates needed to be included in subsequent analysis. All antibody responses increased significantly with age and infection level, independent of the specific malaria antigen. In addition, antibody responses against schizont extract, 195A and BVp42 were significantly higher in females than in males. The median antibody responses against all antigens were higher in Apusit, which reflects the higher parasite prevalence in this village. These differences between the two main study villages were significant for antibody responses against RESA, SPf66, MSP1 and 195A.. Table 2 Distribution of antibody responses against specific malaria antigens in three surveys November 1992 Median Schizont RESA. March 1993. 25, 75 %tile. Median. 21.7. 5.5, 81.3. 110.8. 24.0, 277.7. July 1993 25, 75 %tile. KWa test c2, 2 d.f.. 25, 75 %tile. Median. 19.4. 7.8, 78.5. 34.8. 9.5, 125.7. 9.0*. 53.0. 28.3, 107.8. 47.3. 24.7, 111.9. 11.6** 17.7***. MSP2 (FC27). 21.9. 9.2, 188.3. 37.4. 7.6, 324.4. 103.4. 14.1, 452.3. MSP2 (3D7). 54.7. 11.4, 311.5. 63.3. 10.2, 415.3. 82.9. 13.8, 543.6. 3.5. MSP2 (d3D7). 28.4. 11.6, 208.4. 38.6. 10.3, 345.7. 93.0. 15.1, 612.4. 13.6**. SPf66. 121.8. 45.3, 274.0. 54.7. 31.0, 91.7. ndb. nd, nd. 32.3***. MSP1. 35.9. 12.1, 399.3. 76.2. 11.1, 324.6. 119.2. 21.3, 461.8. 7.7*. 195A. 26.64. 12.5, 193.6. 17.1. 11.1, 34.3. 22.4. 11.5, 208.8. 21.0***. 56.4. 17.9, 271.9. 30.6. 15.7, 92.9. 104.2. 17.2, 459.7. 19.1***. BVp42. a Kruskal-Wallis test (c2 approximation). b Not done.. *** P , 0.0001, ** P , 0.001,* P , 0.01..
(4) 582. INTERNATIONAL JOURNAL OF EPIDEMIOLOGY. Table 3 Sex and village differences in median antibody responses against the specific malaria antigens and their correlation with age and infection status a Sex differences. Village differences. Male. Infectionb Apusit. Age. Female. Kunjingini 1. Median. (25, 75 %tile). Median. (25,75 %tile). rSPc. Schizont. 26.5. (8.3, 83.8). 72.1. (12.5, 148.1)*. 0.66***. 0.27**. 51.3. (12.5, 95.8). 26.8. (8.3, 109.0). RESA. 74.7. (37.0, 161.0). 101.9. (42.3, 305.6). 0.41***. 0.39**. 103.7. (56.6, 266.0). 57.7. (27.6, 149.1)**. MSP2 (FC27). 71.3. (10.6, 331.9). 110.4. (15.6, 393.1). 0.58***. 0.37***. 127.3. (14.2, 409.3). 58.1. (10.6, 281.6). MSP2 (3D7). 67.2. (12.9, 392.4). 156.1. (22.3, 509.3). 0.63***. 0.38***. 116.3. (14.5, 498.5). 68.8. (13.1, 384.5). MSP2 (d3D7). 60.6. (13.3, 352.5). 162.0. (15.6, 477.6). 0.60***. 0.34***. 97.0. (13.9, 433.5). 60.6. (13.4, 401.2). SPf66d. 92.7. (49.0, 182.8). 94.3. (47.2, 252.7). 0.41e***. 0.33e***. 118.3e. (56.6, 235.7). 78.3. (39.6, 225.4)*. MSP1. 60.5. (16.7, 329.3). 136.3. (19.4, 714.7). 0.52***. 0.36**. 146.0. (31.5, 968.2). 53.9 (13.5, 288.7)***. 195A. 21.1. (12.7, 109.4). 56.8. (15.0, 520.6)*. 0.45***. 0.28**. 66.6. (16.2, 441.3). 20.8. (12.0, 71.4)***. BVp42. 66.5. (19.1, 208.1). 180.3. (28.6, 474.6)**. 0.44***. 0.28***. 103.7. (21.9, 275.1). 110.5. (21.4, 461.6). 106. 235. 235. Sample size (N). 129. rSPc Median (25, 75 %tile). Median. (25, 75 %tile). 114. 119. a One child was excluded from the analysis because response measurements to one or more antigens were missing in each survey. b Ln(parasite densities +1); parasite densities = 0 included. c Spearman rank correlation coefficient. d Antibody response against SPf66 only measured during two surveys. e N = N-3. +two children lived in two other villages. *** P , 0.001, ** P , 0.01, * P , 0.05 (significance levels after multiple regression analysis with corrections for repeated measurements analysis).. The results of the variance component analysis, quantifying different sources of variation, are shown in Table 4. For each antibody response, two models are represented: model 1 without the house effect included and model 2 with the house effect included. Most importantly, the majority of the total phenotypic variance could be explained by the within-child variation of antibody responses between surveys in all models. If the house effect was ignored (model 1) then the remaining variation due to other non-genetic factors was very small, except for the antibody response against RESA. In addition, genetic variance, mainly additive genetic variance, was present for antibody responses against all malaria antigens. The heritability varied from 9.7 up to 48.2%, depending on the different antigens (Table 4). However, when a house effect was included in the analysis (model 2), most or all of the genetic variance could be explained by living in the same house, except for the antibody response against SPf66, where there was no house effect present. Consequently, heritability was reduced for the antibody response against schizont extract, MSP2 (d3D7), MSP1 and BVp42 or disappeared completely for RESA, MSP2 (FC27), MSP2 (3D7) and 195A (Table 4). As a special case for the antibody response against MSP2 (d3D7), genetic variation could be mainly explained by dominance variance and partly by house variation. This suggests that the genetic variation was highly confounded by the sharing of common environments by closely related relatives. Comparing the fit of the two models showed that the model with the house effect included (model 2) fitted better for antibody responses against schizont extract, MSP2 (FC27), MSP2 (d3D7), MSP1 and BVp42, but there was no difference in the fit between model 1 or 2 for antibody responses against RESA, MSP2 (3D7), 195A and SPf66. In order to assess familial correlations of antibody responses in different relative pairs, intra-class correlation coefficients were. estimated (Table 5). Antibody responses against all antigens were significantly correlated in full-sib pairs. The correlations in cousin pairs were positive for the antibody responses against all antigens, but were only significant for antibody responses against schizont extract, MSP2 (FC27), SPf66 and MSP1. In half-sib and avuncular pairs the pattern shown was not uniform: there was strong negative correlation in half-sib pairs in immune responses against RESA, MSP2 (3D7) and MSP2 (d3D7). In addition, there was a much higher positive correlation in avuncular pairs than in full-sib pairs in antibody responses against MSP2 (FC27), MSP2 (d3D7), and 195A.. Discussion The aim of the present analysis was to assess the relative contribution of several measurable sources of variation in total IgG responses against schizont extract and specific malaria antigens in children. We used variance component analysis, and were able to partition the variation of total IgG responses into four different sources, including between-survey variation, genetic, house variation and remaining non-genetic variation. These factors contributed by varying amounts to the observed heterogeneity in antibody responses, and the results of the analysis allow us to infer their relative importance in the context of immuno-epidemiological and vaccine studies. The most important source of variation was related to surveying the children at different points in time, which explained at least half of the total variation for each antigen after age, sex and infection status adjustments. This was true even for MSP2 (3D7), where there were no significant differences in the mean antibody responses among surveys. We cannot be sure of the underlying cause of the variation because only three surveys were conducted, and they were each several months apart. One reason is seasonal variation, related to fluctuations in transmission levels.49 This would concur with the results of Taylor.
(5) 2. 0.021. 0.003. i Broad-sense heritability.. h Akaike’s information criterion.. g Log likelihood.. f Within-child variance.. e Non-genetic variance.. d House variance.. c Dominance variance.. b Standard error.. 0.014. –. 0.019. 0.017. 0.016. 0.013. 0.013. –. 0.051. –. 0.013. –. 0.041. –. 0.024. 0.016. 0.011. SEb. 0.198. 0.000. 2. 1. 0.327. 0.080. 2. 1. 0.296. 0.138. 2. 1. 0.138. 0.000. 2. 1. 0.257. 0.000. 2. 1. 0.234. 0.000. 2. 1. 0.184. 0.000. 2. 1. 0.063. 0.053. 2. 1. 0.164. AVa. 1. a Additive genetic variance.. BVp42. 195A. MSP1. SPf66. MSP2 (d3D7). MSP2 (3D7). MSP2 (FC27). RESA. Schizont. Model. Table 4 Results of variance component analysis. 0.000. 0.000. 0.000. 0.000. 0.000. 0.000. 0.000. 0.000. 0.136. 0.006. 0.000. 0.000. 0.000. 0.044. 0.000. 0.000. 0.000. 0.000. DVc. –. –. –. –. –. –. –. –. 0.220. 0.044. –. –. –. 0.037. –. –. –. –. SE. 0.241. –. 0.163. –. 0.275. –. 0.000. –. 0.098. –. 0.124. –. 0.110. –. 0.038. –. 0.122. –. HVd. 0.030. –. 0.016. –. 0.027. –. –. –. 0.056. –. 0.012. –. 0.012. –. 0.012. –. 0.018. –. SE. 0.0002. 0.0005. 0.160. 0.0004. 0.0003. 0.0004. 0.0001. 0.0001. 0.023. 0.0003. 0.110. 0.0003. 0.116. 0.0003. 0.178. 0.153. 0.0001. 0.0004. NGVe. 0.000. 0.000. 0.014. 0.000. 0.000. 0.000. 0.000. 0.000. 0.167. 0.000. 0.010. 0.000. 0.010. 0.000. 0.016. 0.024. 0.000. 0.000. SE. 0.543. 0.529. 0.395. 0.394. 0.373. 0.363. 0.468. 0.468. 0.282. 0.281. 0.310. 0.309. 0.291. 0.291. 0.432. 0.432. 0.374. 0.364. WCVf. 0.014. 0.013. 0.010. 0.010. 0.010. 0.009. 0.014. 0.014. 0.007. 0.007. 0.008. 0.008. 0.008. 0.008. 0.011. 0.011. 0.010. 0.009. SE. –1276.95. –1306.57. –986.007. –987.322. –734.903. –797.775. –771.858. –771.858. –302.745. –310.218. –418.368. –420.624. –306.693. –316.233. –1019.257. –1020.457. –527.567. –551.849. LogLg. 59.24. 2.63. 125.74. 0.0. 14.95. 4.51. 19.08. 2.4. 48.56. c2. 2571.90. 2629.13. 1990.02. 1990.64. 1487.81. 1611.55. 1559.72. 1559.72. 623.49. 636.44. 854.74. 857.25. 631.39. 648.47. 2056.51. 2056.91. 1073.13. 1119.70. AICh. 0.0004. 0.272. 0.000. 0.453. 0.110. 0.449. 0.227. 0.253. 0.482. 0.000. 0.431. 0.000. 0.439. 0.000. 0.097. 0.097. 0.311. Hi. SE. 0.027. 0.022. –. 0.030. 0.026. 0.027. 0.024. 0.486. 0.057. –. 0.028. –. 0.047. –. 0.040. 0.031. 0.023. VARIATION IN ANTIBODY RESPONSE TO MALARIA. 583.
(6) 584. INTERNATIONAL JOURNAL OF EPIDEMIOLOGY. Table 5 Correlations of antibody responses in relative groups of children Siblings. Half-sibs. Avuncular. Cousins. Schizont. 0.33***. –0.12. 0.15. 0.15**. RESA. 0.31***. –0.42*. –0.23. 0.09. MSP2 (FC27). 0.39***. –0.09. 0.61**. 0.14**. MSP2 (3D7). 0.39***. –0.44*. 0.19. 0.07. MSP2 (d3D7). 0.33***. –0.55*. 0.53*. 0.001. SPf66. 0.31***. –0.34. 0.10. 0.29***. MSP1. 0.44***. 0.17. 0.08. 0.17***. 195A. 0.24***. 0.07. 0.47*. 0.09. BVp42. 0.32***. –0.27. –0.11. 0.05. 272. 16. 22. 446. No. of pairs. * P , 0.05, ** P , 0.01, *** P , 0.001.. et al.,33 who showed that antibody responses to MSP1 and MSP2 vary by season in children in The Gambia. The variation is not due to differences in laboratory techniques since all three samples from each child were tested on the same ELISA plate. However, we would anticipate some variability even if bloods were drawn on consecutive days, or if the same samples were tested repeatedly. Whatever the explanation, our results indicate that immune responses measured at a single time point might not always be representative. This could be especially critical when assessing the protective effect of specific immune responses against infection and disease. The second most important source of variation in responses against all antigens and schizont extract, before inclusion of the house effect, was genetic variation. This confirms and extends previous reports which have suggested genetic regulation of antibody responses to RESA,29,32,50–53 MSP2,30,32 MSP130 and SPf66.26,28 However, inclusion of a house effect explained most of the apparent genetic variation, in a manner similar to that found in a previous analysis of total IgG responses against RESA in adults in the same study population.32 It is worth noting that familial aggregation of antibody responses against RESA, MSP2 (3D7) and MSP1 (195A) could not be clearly attributed to either genetic or to house variation, since the models with and without house effect could not be distinguished. The difficulty of separating house and genetic effects might be explained by the fact that the majority of full sibs were living in the same house. This is inevitable when studying children, or most closely related relatives, and cannot be ignored, because individuals who live together are likely to have similar levels of several factors, such as exposure, which can affect the nature and level of immune responses. The inclusion of a house effect in any analysis of immune responses therefore appears to be essential. This variable is easier and cheaper to assess than any definable genetic factor, and seems to account, at least partly, for some of the apparent genetic variation. Additional analysis showed that IgG responses were more correlated in full sibs than cousins for all antigens except for the antibody responses against SPf66, where correlations were similar in both cousins and full-sib pairs. These findings confirm results of the study in adults in the same study area in PNG,32 and on their own are in agreement with a Mendelian genetic model. However, we also found high negative correlations of immune responses in half sib-pairs and high positive correlation. in avuncular pairs for some of the antibody responses, which disagrees with any Mendelian genetic model. This phenomenon may be the result of low numbers of half-sib and avuncular pairs being unrepresentative of the population, and also because all members in these pairs came from only two families. In summary, the lack of a uniform pattern in the correlation coefficients, the low correlations in cousin pairs, and the high degree of aggregation of similar responses in the same houses, indicate that non-genetic factors within houses may be more important determinants of familial clustering than genetic factors. The final source of variation was the remaining non-genetic variation. This was found in the responses to all antigens, although not to the same degree. For antibody responses to schizont extract, SPf66, MSP1 and Bv42 there was very little non-genetic variation with or without the house effect included, indicating that we identified all major sources of variation in responses to these antigens. The non-genetic variation of responses to other antigens was comparatively high when the house effect was included, and always relatively high for RESA. These results indicate that other, non-specified, factors might have played a role in determining individual responses. Variation in exposure is probably important, and like other immuno-epidemiological studies in endemic areas we are not able to distinguish between effects of immunological memory and of continual antigenic challenge. Taken together, the results of this analysis make it clear that temporal variation and familial aggregation, whether determined by house or genetic effects, were the most important sources of variation in total IgG responses to all antigens among the study children. A serious shortcoming of population-based analyses of heritability is that, as in our study, it is often not possible to separate clearly the environmental effects of shared houses from genetic effects. In general, the evaluation of effects of shared houses should be considered an important test of the robustness of estimates of heritability in human parasitic diseases. Since antibody responses to all antigens vary extensively over time, it is debatable whether protective effects of specific immune responses to possible vaccine candidates are best estimated using single measurements for each individual. The heritability of averages of repeated determinations can be much higher than those based on single observations. Overall, causes of temporal variation and clustering need to be addressed when.
(7) VARIATION IN ANTIBODY RESPONSE TO MALARIA. studying immune responses, since ignoring such factors might lead to incorrect inferences or misinterpretation of results.. 585. surface protein-1 in protecting Papua New Guinean children from malaria morbidity. Am J Trop Med Hyg 1996;54:443–48. 13 Al-Yaman F, Genton B, Anders RF et al. Relationship between humoral. Acknowledgements The authors thank the population in the Wosera for their participation in the study. We very much thank Jack Taraika for the antibody measurement, Lawrence Rare and Meza Ginny for fieldwork and Manasseh Baea for logistics. We thank Dr Robin Anders for helpful discussions on immune response assessment in this population. Many thanks to Dr Mark Booth for helpful discussions and comments on the manuscript. RESA and MSP2 were provided by Saramane Pty Ltd (Melbourne, Australia). Schizont extract and MSP1 were provided by Drs Kenton Kramer and Sandra Chang. SPf66 was provided by SmithKline Beecham (Philadelphia, PA, USA). HA Stirnadel was financed by the Swiss National Science Foundation grant No. 3243527.95 and the Rudolf Geigy Stiftung.. response to Plasmodium falciparum merozoite surface antigen-2 and malaria morbidity in a highly endemic area of Papua New Guinea. Am J Trop Med Hyg 1994;51:593–602. 14 Al-Yaman F, Genton B, Anders R et al. Assessment of the role of the. humoral response to Plasmodium falciparum MSP2 compared to RESA and SPf66 in protecting Papua New Guinean children from clinical malaria. Parasite Immunol 1995;17:493–501. 15 Al-Yaman F, Genton B, Taraika J, Anders R, Alpers MP. Cellular. immunity to merozoite surface protein 2 (FC27 and 3D7) in Papua New Guinean children. Temporal variation and relation to clinical and parasitological status. Parasite Immunol 1997;19:207–14. 16 Beck HP, Felger I, Kabintik S et al. Assessment of the humoral and. cell-mediated immunity against the Plasmodium falciparum vaccine candidates circumsporozoite protein and SPf66 in adults living in highly endemic malarious areas of Papua New Guinea. Am J Trop Med Hyg 1994;51:356–64. 17 Hviid L. Peripheral T-cell non-responiveness in individuals exposed. to Plasmodium falciparum malaria. 1995, pp.5–46. (Thesis.). References 1 McGregor IA, Wilson RJM. Specific immunity: acquired in man. In: Wernsdorfer WH, McGregor IA (eds). Malaria—Principles and Practice of Malariology. 1988, pp.559–619. 2 Cohen S, McGregor IA, Carrington S. Gamma-globulin and acquired. immunity to human malaria. Nature 1961;192:733–37.. 18 Riley EM. The role of MHC- and non-MHC-associated genes in. determining the human immune response to malaria antigens. Parasitol 1996;112:39–51. 19 Allansmith M, McClellan B, Butterworth M. The influence of heredity. and environment on human immunoglobulin levels. J Immunol 1969; 102:1504–10.. 3 McGregor IA, Carrington S, Cohen S. Treatment of East African. 20 Klaff MW, Hijmans W. Serum immunoglobulin levels in twins. Clin. P. falciparum malaria with West African gamma-globulin. Trans R Soc Trop Med Hyg 1963;57:170–75.. 21 Kohler PF, Rivera VJ, Eckert ED, Bouchard TJ, Heston LL. Genetic. 4 Bouharoun-Tayoun H, Attanath P, Sabchareon A, Chongsupha-. jaisiddhi T, Druilhe P. Antibodies that protect humans against Plasmodium falciparum blood stages do not on their own inhibit parasite growth and invasion in vitro, but act in cooperation with monocytes. J Exp Med 1990;172:1633–41. 5 Sabchareon A, Burnouf T, Ouattara D et al. Parasitologic and clinical. human response to immunoglobulin administration in falciparum malaria. Am J Trop Med Hyg 1991;45:297–308. 6 Al-Yaman F, Genton B, Falk M et al. Humoral response to Plasmodium. falciparum ring-infected erythrocyte surface antigen in a highly endemic area of Papua New Guinea. Am J Trop Med Hyg 1995;52: 66–71.. Exp Immunol 1969;5:469–77. regulation of immunoglobulin and specific antibody levels in twins reared apart. J Clin Invest 1985;75:883–88. 22 Dunlap NE, Ballinger S, Reed T, Christian JC, Koopman WJ, Briles. DE. The use of monozygotic and dizygotic twins to estimate the effects of inheritance on the levels of immunoglobulin isotypes and antibodies to Phosphocholine. Clin Immunol Immunopathol 1993;66: 176–80. 23 Konradsen HB, Henrichsen J, Wachmann H, Holm N. The influence. of genetic factors on the immune response as judged by pneumococcal vaccination of mono-and dizygotic Caucasian twins. Clin Exp Immunol 1993;92:532–36. 24 Borecki IB, McGue M, Gerrard JW, Lebowitz MD, Rao DC. Familial. 7 Beck HP, Felger I, Genton B et al. Humoral and cell-mediated immun-. resemblance for immunoglobulin levels. Hum Genet 1994;94:179–85.. ity to Plasmodium falciparum ring-infected erythrocyte surface antigen in an adult population exposed to highly endemic malaria. Infect Immun 1995;63:596–600.. 25 Osoba D, Dick HM, Voller A et al. Role of the HLA complex in the. 8 Al-Yaman F, Genton B, Taraika J, Anders R, Alpers MP. Association. 26 Patarroyo ME, Vinasco J, Amador R et al. Genetic control of the. between cellular response (IL-4) to RESA/Pf155 and protection from clinical malaria among Papua New Guinean children living in a malaria endemic area. Parasite Immunol 1997;19:249–54.. immune response to a synthetic vaccine against Plasmodium falciparum. Parasite Immunol 1991;13:509–16.. 9 Riley EM, Allen SJ, Wheeler JG et al. Naturally acquired cellular and. humoral immune responses to the major merozoite surface antigen (PfMSP1) of Plasmodium falciparum are associated with reduced malaria morbidity. Parasite Immunol 1992;14:321–37. 10 Tolle R, Fruh K, Doumbo O et al. A prospective study of the associ-. antibody response to malaria under natural conditions. Immunogenetics 1979;8:323–38.. 27 Dieye A, Heidrich H-G, Rogier C et al. Lymphocyte response in vitro. to Plasmodium falciparum merozoite antigens in donors from a holoendemic area. Parasitol Res 1993;79:629–33. 28 Beck H-P, Felger I, Barker M et al. Evidence of HLA class II associ-. ations with antibody response against the malaria vaccine SPf66 in a naturally exposed population. Am J Trop Med Hyg 1995;53:284–88.. ation between the human humoral immune response to Plasmodium falciparum blood stage antigen gp190 and control of malarial infections. Infect Immun 1993;61:40–47.. 29 Sjöberg K, Lepers JP, Raharimalala L et al. Genetic regulation of. 11 Al-Yaman F, Genton B, Kramer KJ et al. Acquired antibody levels to. 30 Jepson A, Banya W, Sisay-Joof F et al. Quantification of the relative. Plasmodium falciparum merozoite surface antigen 1 in residents of a highly endemic area of Papua New Guinea. Trans R Soc Trop Med Hyg 1995;89:555–59.. contribution of major histocompatibility complex (MHC) and nonMHC genes to human immune responses to foreign antigens. Infect Immun 1997;65:872–76.. 12 Al-Yaman F, Genton B, Kramer KJ et al. Assessment of the role of. 31 Troye-Blomberg M, Fogdell A, el-Ghazali G et al. Analysis of the T-cell. naturally acquired antibody levels to Plasmodium falciparum merozoite. receptor V beta usage in monozygotic and dizygotic twins living in a. human anti-malarial antibodies in twins. Proc Natl Acad Sci USA 1992;89:2101–04..
(8) 586. INTERNATIONAL JOURNAL OF EPIDEMIOLOGY. Plasmodium falciparum endemic area in west Africa. Scand J Immunol 1997;45:541–45.. 42 Weiss KM. Genetic Variation and Human Disease. Cambridge: Cam-. 32 Stirnadel HA, Beck H-P, Alpers MP, Smith TA. Heritability and. 43 Khoury MJ, Beaty TH, Bernice HC. Fundamentals of Genetic Epi-. segregation analysis of immune responses to specific malaria antigens in Papua New Guinea. Genet Epidemiol 1999;17:16–34. 33 Taylor RR, Egan A, McGuinness D et al. Selective recognition of. malaria antigens by human serum antibodies is not genetically determined but demonstrates some features of clonal imprinting. Int Immunol 1996;8:905–15. 34 Alpers MP, Al-Yaman F, Beck HP et al. The Malaria Vaccine Epi-. demiology and Evaluation Project of Papua New Guinea: rationale and baseline studies. P N G Med J 1992;35:285–97. 35 Genton B, Al-Yaman F, Beck H-P et al. The epidemiology of malaria. in the Wosera area, Papua New Guinea, in preparation for vaccine trials. I. Malariometric indices and immunity. Ann Trop Med Para 1995;89:359–76. 36 Genton B, Al-Yaman F, Beck H-P et al. The epidemiology of malaria. in the Wosera area, East Sepik Province, Papua New Guinea, in preparation for vaccine trials. II. Mortality and morbidity. Ann Trop Med Parasitol 1995;89:377–90.. bridge University Press, 1993. demiology. Oxford: Oxford University Press, 1993. 44 Hopper JL, Mathews JD. A multivariate normal model for pedigree. and longitudinal data and the software ‘FISHER’. Aust J Stat 1994;36:153–76. 45 Akaike H. A new look at the statistical model identification. IEEE. Trans Automatic Control 1974;19:716–23. 46 Armitage P, Berry G. Statistical Methods in Medical Research. Oxford:. Blackwell Scientific Publications, 1994. 47 SAGE. Statistical Analysis for Genetic Epidemiology, Release 3.1. Computer. program package available from the Department of Epidemiology and Biostatistics, Rammelkamp Center for Education and Research, MetroHealth Campus, Case Western Reserve University, Cleveland. 1998. 48 Zar JH. Biostatistical Analysis. New Jersey: Prentice Hall, 1900. 49 Hviid L, Theander TG. Seasonal changes in human immune. responses to malaria. Parasitol Today 1993;9:26–27.. 37 Hui GS, Chang SP, Gibson H et al. Influence of adjuvants on the. 50 Bjorkman A, Perlmann H, Petersen E et al. Consecutive determina-. antibody specificity to the Plasmodium falciparum major merozoite surface protein, gp195. J Immunol 1991;147:3935–41.. tions of seroreactivities to Pf 155/RESA antigen and to its different repetitive sequences in adult men from a holoendemic area of Liberia. Parasite Immunol 1990;12:115–23.. 38 Chang SP, Gibson HL, Lee-Ng CT, Barr PJ, Hui GS. A carboxyl-. terminal fragment of Plasmodium falciparum gp195 expressed by a recombinant baculovirus induces antibodies that completely inhibit parasite growth. J Immunol 1992;149:548–55. 39 Al-Yaman F, Genton B, Taraika J, Alpers MP. Naturally acquired cellu-. 51 Troye-Blomberg M, Olerup O, Larsson A et al. Failure to detect MHC. class II associations of the human immune response induced by repeated malaria infections to the Plasmodium falciparum antigen Pf155/RESA. Int Immunol 1991;3:1043–51.. lar immune responses to the synthetic malarial peptide SPf66 in children in Papua New Guinea. Trans R Soc Trop Med Hyg 1997;91:709–12.. 52 Riley EM, Olerup O, Troye-Blomberg M. The immune recognition of. 40 Blom G. Statistical Estimates and Transformed Beta Variables. New York:. 53 Migot F, Chougnet C, Perichon B et al. Lack of correlation between. John Wiley & Sons, 1958. 41 Lange K, Weeks D, Boehnke M. Programs for pedigree analysis:. MENDEL, FISHER, and dGENE [letter]. Genet Epidemiol 1988;5:471–72.. malaria antigens. Parasitol Today 1991;7:5–11. HLA class II alleles and immune responses to Pf155/ring-infected erythrocyte surface antigen (RESA) from Plasmodium falciparum in Madagaskar. Am J Trop Med Hyg 1995;52:252–57..
(9)
Figure
Documents relatifs