D I A B E T E S
Direct medical costs of type 2 diabetes and
its complications in Switzerland
IRMGARD SCHMITT-KOOPMANN, MATTHIAS SCHWENKGLENKS, GIATGEN A. SPINAS, THOMAS D. SZUCS *
Background: This paper analyses the direct medical costs of type 2 diabetes and its complications in Switzerland. Methods:
Individual healthcare resource consumption related to type 2 diabetes and its complications was determined retrospectively in
1479 non-incident and non-dying patients over 12 months (1998–1999). Literature-derived attributable risks were used to
correct for non-diabetes related macrovascular disease. Results: A total of 111 primary care physicians from 19 cantons
throughout Switzerland participated. Their diabetic patients on average had 10.3 consultations per year related to this disease
(95% CI: 10.0–10.7). Patients spent on average 2.7 days (95% CI: 2.2–3.3) per year in hospital due to diabetes and
diabetes-related complications. Mean annual type 2 diabetes-related direct medical costs per patient amounted to CHF 3,508
/
€ 2,323 (95% CI: CHF 3,140–3,876 / € 2,080–2,567). They were particularly high in patients with insulin treatment or
with complications. After application of attributable risks and a correction for the use of adjuvant materials, costs were CHF
3,324 /
€ 2,201. Assuming 250,000 patients with type 2 diabetes in Switzerland leads to an estimate of CHF 0.88 billion
spent for this disease and its complications in 1998. This represents a share of about 2.2% of the country’s total healthcare
expenditures. Conclusion: These findings demonstrate the high economic importance of type 2 diabetes and its complications
in Switzerland.
Keywords: cost of illness, economics, Europe, Switzerland, type 2 diabetes
T
ype 2 diabetes mellitus is one of the great challenges in public health. The number of people suffering from diabetes worldwide was estimated by the WHO at 135 million in 1995. This figure was projected to more than double by the year 2025, the reasons being ageing of the population, unhealthy diet, a sedentary lifestyle and subsequent obesity.1,2 In relative terms about 2.1% of the world’s population have diabetes, a number which is expected to increase to 3.0% by 2010.2 Type 2 diabetes accounts for approximately 90% of all cases of diabetes in the world. Besides its increasing health impact the economic burden of diabetes is enormous. A study conducted by the World Bank found that of 1,362 million DALYs lost to all illnesses in 1990, 7.97 million DALYs (0.59%) were lost to diabetes.3 In the USA diabetes is known to be a major source of morbidity, mortality and economic expense.4,5 US direct medical and indirect expenditures attributable to diabetes in 1997 were estimated at $ 98.2 billion.5No empirical studies are available of the healthcare costs of diabetes in Switzerland, apart from a cost-effectiveness analysis of different management strategies for type 1 diabetes and two modelling studies on type 2 diabetes.6–8 Data from other European countries cannot be assumed to be a priori applicable to Switzerland due to differing healthcare and pricing systems. This is even more true for the results of a relatively large number of US studies addressing this subject.
The aim of this study was to determine the direct medical costs of type 2 diabetes mellitus and its complications in Switzerland. A ‘bottom-up’ approach was used, as there are only very few
aggregate healthcare data available in Switzerland. Calculations were based on the costs of the individual units of service performed.
METHODS
Physician and patient sample
From the Swiss Medical Association’s 1998 list, 3,100 primary care physicians were randomly selected and invited to participate if they treated 10 or more diabetes patients. A total of 111 general practitioners and non-subspecialized internists from all over Switzerland provided information extracted from their medical charts. They were asked to include all patients with type 2 diabetes who attended their office during the last 12 months, in order to minimize possible selection biases. Classification of diabetes was left to their judgement and not influenced by the study group.
Data were collected between June 1998 and September 1999. Patients who were newly diagnosed or died within the reviewed time period were excluded to avoid distortions by observations with extreme values. The exclusion of newly diagnosed cases implies a strictly prevalence-based approach.
Patient data and healthcare resource utilization
Diabetes-related healthcare utilization and cost-inducing events were recorded for 12 months retrospectively. Collection of data included gender, age, age at diagnosis, type of treatment, the presence of microvascular complications (neuropathy, nephro-pathy, retinopathy), macrovascular complications (coronary heart disease, cerebrovascular disease, peripheral artery disease), and related events. At the resource use level, recording com-prised diabetes-related medication, consultations, laboratory tests, imaging diagnostics, ambulatory procedures, hospital stays, and home healthcare. Insurance and employment status were also recorded, as well as the number of working days lost. The use of adjuvant materials like glucose monitoring devices, strips and syringes could not be assessed from the medical charts. It was estimated, at the aggregate level, from the experience available in a large Swiss outpatient diabetes unit.
© European Public Health Association 2004; all rights reserved
* I. Schmitt-Koopmann1, M. Schwenkglenks2, G.A. Spinas3, T.D. Szucs2 1 Division of Medical Economics, University Hospital, Zürich, Switzerland (currently none)
2 Hirslanden Research, Zürich, Switzerland
3 Division of Endocrinology and Diabetes, University Hospital, Zürich, Switzerland
Correspondence: M. Schwenkglenks, M.A., M.P.H., European Center
of Pharmaceutical Medicine (ECPM), University Hospital, CH-4031 Basel, Switzerland, tel. +41 61 261 45 83, fax +41 61 261 45 84,
Clinical data
Although resource utilization was the primary interest of this study, selected clinical data, which were felt to be important for further analyses, were also recorded. Parameters included height, weight, last measurements of laboratory parameters (plasma glucose, HbA1c, total cholesterol, HDL-cholesterol, tri-glycerides, serum creatinine, and urine albumin excretion), and the last recorded blood pressure measurement.
Costs
To estimate the economic impact of type 2 diabetes and its complications, direct medical costs were calculated. Prices and charges were used as proxy measures of real costs. All ex-penditures on the resources used were taken into account in-dependently of the payer (patient, third-party, or state). In this sense, a societal perspective of cost assessment was adopted. Direct medical costs comprised expenditures for outpatient care (consultations of general practitioners and specialists, laboratory tests, imaging diagnostics, ambulatory surgeries, prescribed out-patient nursing services and education by nurses), in-out-patient care (hospitalizations, inpatient procedures), and medication. Treatment costs of diabetes-related complications (neuropathy, nephropathy, eye complications, and macroangiopathy) were also included. Services provided by physiotherapists or dieticians and the costs of long-time hospice care could not be assessed. The costs of adjuvant materials were estimated at an aggregate level. All expenditure calculations were based on 1998/1999 prices and tariff lists.
Costs of outpatient care
To estimate the costs induced by consultations of general practitioners, the number of visits was multiplied by the applicable consultation fees. To estimate the expenditures for out-patient care provided by ophthalmologists, the number of diabetes-related visits was multiplied by the sum of charges for the typical services covered.
The number of laboratory tests performed was multiplied by the applicable tariffs.9 The costs of imaging diagnostics (X-rays, Doppler sonography, computer tomography and magnetic resonance imaging), of outpatient eye surgeries, of prescribed home care services, and of diet counsel and education by diabetes nurses were assessed according to the same principles.10,11 Costs of in-patient care
Estimates of in-patient care costs included costs of hospitaliza-tion and of inpatient intervenhospitaliza-tions (PTCA, PTA and bypass surgery) as well as costs of haemodialysis.
Expenditures for hospital care were estimated by multiplying the reported number of hospital days by the average regional cost per in-patient day spent on the general ward of a public hospital.12 Public subsidies to the hospitals were added.
Expenditures for in-patient surgical interventions were cal-culated by multiplying the number of operations with the charges for the respective surgery.10 The corresponding hospital days were accounted for as indicated above. Costs of haemodialysis were calculated from data provided by the Swiss Association for Common Issues in Health Insurance.13
Costs of medication
All prescribed medications with a direct or indirect relation to diabetes were recorded by name and daily dosage if taken regularly or continuously. The yearly dosage of every medication was calculated and finally multiplied by its unit price, using 1999 public prescription prices.14 Non-prescription-based out-of-pocket expenses were not assessed.
Attributable risks
The cost figures resulting from the described procedure are costs of type 2 diabetes and its complications including macrovascular disease, but not all costs of macrovascular disease are diabetes related. The same is true for cataract and cataract surgery. Corrected cost figures were modelled by applying literature-derived diabetes-attributable risks to the costs of CABG surgery and PTCA, to the inpatient costs of patients with macrovascular disease, to the costs of cardiovascular drugs, and to the costs of cataract surgery.15,16 If macrovascular and microvascular disease were present, it was assumed that only half of the hospital days reported were due to the former. Costs of physician consultations were not corrected, as the share of consultations due to macro-vascular disease could not be to judged. Lipid tests were not corrected, as they were assumed to be necessary in all type 2 diabetes patients.
Statistical analysis
Non-stratified and stratified descriptive analyses were performed using SPSS version 10.0.
RESULTS
A total of 111 physicians from 19 cantons throughout Switzer-land participated and provided data on a total of 1479 patients who were currently being treated for type 2 diabetes. Two-thirds (66%) of the patients were seen by a general practitioner, 27% were seen by a doctor without specialization, and 7% by a non-subspecialized internist. On average every physician re-ported data on 13.2 patients (median 15 patients). Overall reporting quality was good, with less than 5% missing values in nearly all variables relevant for cost analysis.
Patient population
The 1479 patients analysed represent a sample of about 0.6% of all Swiss patients with type 2 diabetes. Demographic data are shown in table 1 which shows that 83% (1226) of the patients came from the German speaking part of Switzerland, 16% (239) from the French speaking part, and 1% (14) from the Italian speaking part.
The following labour force participation rates were recorded: full-time employment 26.5%, part-time employment 3.7%, self-employed 7%, not self-employed 16.9%, jobless 1%, pensioners 38.6%, disability pensioners 6.2%.
Information on insurance status was available from 1041 patients. 81% of these patients had basic statutory insurance coverage only, 19% had a supplementary insurance package. Type of treatment was distributed as follows: no specific treat-ment for diabetes was reported in 1.2% (17) of the patients; dietary treatment only was reported in 14.1% (208); while 60.1% Table 1 Demographic data of study population (N=1479)
Value (mean ± SD or %) Age (years) 66 ± 12.3 Male/Female (%) 49.4 / 50.1 German/French/Italian speaking (%) 82.9 / 16.2 / 0.9 Height (cm) 167 ± 9.13 Weight (kg) 81.2 ± 16.55 BMI (m/kg2) 29.4 ± 5.46
Duration of diabetes (years) 9.2 ± 7.04 Family history of diabetes (%) 29.5 Blood glucose (mmol/l, last measurement) 8.86 ± 3.03 HbA1c (%, last measurement) 7.72 ± 1.66
Diet treatment (%) 85.8
Diabetes-related drugs prescribed (%) 93.0
(887) had oral antidiabetic drugs. Insulin was used by 24.6% (364), in part combined with oral antidiabetic agents. Diabetes-related complications were present in 56% of patients (table 2). Macrovascular complications (excluding hyper-tension) were present in 27%. Acute myocardial infarction and stroke affected 2.6% and 2.3% during the last year. Micro-vascular complications were recorded in 43%, neuropathy (in-cluding diabetic foot syndrome) in 23%, nephropathy (in(in-cluding microalbuminuria and proteinuria) in 28%, and eye complica-tions in 13%. Amputacomplica-tions during the last year were reported in 1.6% of cases. As many as 15% of patients were affected by both macrovascular and microvascular complications.
Resource use
Mean annual medical resource utilization of patients with type 2 diabetes is shown in table 3. On average, patients had 10.3 diabetes-related physician consultations per year (95% CI: 10.0– 10.7). In 15.4%, there was at least one hospitalization during the previous year which was due to diabetes or a diabetes-related complication. On average these persons spent 17.8 days in hospital (95% CI: 15.2–20.4), which results in a mean of 2.7 days
(95% CI: 2.2–3.3) for the whole study population. Only every second patient had an ophtalmological control during the observation period. Apart from blood glucose measurements, HbA1c measurements were the most frequently performed laboratory tests.
Costs
Important direct cost factors are summarized in table 4. Mean annual direct medical costs of type 2 diabetes and its com-plications amounted to CHF 3,508 (95% CI: CHF 3,140–3,876) per year. Hospitalization costs, being the largest cost factor by far, contributed 53% of these costs. Medication costs contributed 30%. Ambulatory costs, comprising consultations, outpatient diagnostic and invasive procedures, and home care services by nurses, accounted for 17%.
The cost distribution of diabetes-related medication is charac-terized by a dominance of cardiovascular drugs over antidiabetic agents. The shares of oral antidiabetic drugs and insulin in the total medication costs were 24.7% and 17.3% (42% in total). The share of cardiovascular medications and lipid-lowering drugs was 39.4% and 9.2% (48.6% in total). Antibiotics used for the Table 3 Annual medical resource utilisation in patients with type 2 diabetes (N=1479) Frequency/patient/year Resource Mean 95% CI Physician visits 10.3 10.0–10.7 Ophthalmological controls 0.55 0.51–0.59 Laboratory tests 11.83 11.48–12.18 Plasma glucose 5.81 5.58–6.04 HbA1c 2.02 1.92–2.11 Serum creatinine 1.28 1.20–1.37 Cholesterol 1.05 0.99–1.11 HDL cholesterol 0.71 0.66–0.76 Triglycerides 0.80 0.74–0.85 Urine albumin (24 h) 0.17 0.13–0.20 Prescribed nurse visits 1.29 0.50–2.09 Computer tomographies 0.033 0.02–0.05 MRI 0.011 0.005–0.02 Hospitalizations 0.22 0.18–0.25 Hospital days 2.74 2.22–3.25 Peripheral dilatations 0.014 0.008–0.02 PTCA 0.0095 0.005–0.015
Table 2 Complication frequencies of study population Frequency
Type of complication N %
Coronary heart disease 312 / 1473 21.2 Peripheral arterial insufficiency 157 / 1473 10.7 Macrovascular complications (≥1) 393 / 1473 26.7
Neuropathy 342 / 1461 23.4
Nephropathy (incl.
microalbuminuria and proteinuria) 365 / 1315 27.8
Retinopathy 188 / 1424 13.2
Microvascular complications (≥1) 619 / 1447 42.8
Any complication 816 / 1456 56.0
Both types of complications 215 / 1443 14.9
Myocardial infarction during the
last year 39 / 1473 2.6
Stroke during the last year 34 / 1473 2.3 Amputation during the last year 23 / 1473 1.6
Table 4 Mean type 2 diabetes-related costs (direct, indirect and total) per year per patient in CHF and € (N=1479)
Mean costs 95% CI Attributable risk corrected costs
Cost category CHF € a CHF € a CHF € a
Direct medical costs 3,508 2,323 3,140–3,876 2,080–2,567 3,004 1,990
Drug costs 1,059 701 1,010–1,108 669–734 889 589
Ambulatory costs 592 392 559–625 370–414 558 370
Consultationsb 295 195 282–308 176–191 295 195
Outpatient diagnostic proceduresc 26 17 19–34 13–23 26 17
Outpatient invasive proceduresd 98 65 73–123 48–81 65 43
Laboratory tests 172 114 166–178 110–118 172 114
Hospital care 1,856 1,229 1,509–2,203 999–1,459 1,557 1,031
a: Exchange rate: CHF 1 = € 0.6623 (11.12.2000). b: Including outpatient nursing services.
c: X-rays, Doppler sonography, computer tomography, and magnetic resonance imaging. d: Vitrectomy, laser therapy, and cataract extraction.
treatment of diabetic foot syndromes accounted for 0.5% of the total, and all other medications for 7.6%.
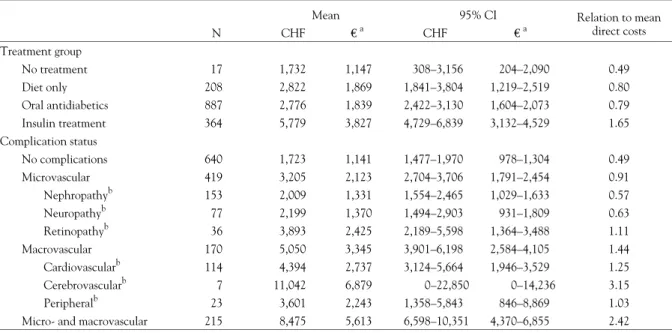
Table 5 shows direct medical costs stratified by treatment type and by the presence of complications. Diet-treated patients cost about 1.6 times more than the few untreated patients in our sample. The costs of diet-treated patients and of patients treated with oral antidiabetic drugs were nearly identical. Compared to these groups, insulin-treated patients were twice as expensive. Cost differences according to complication status were even more distinct. Patients with at least one microvascular complica-tion cost nearly twice as much as patients without complicacomplica-tions. Patients with at least one macrovascular complication (ex-cluding hypertension) cost nearly three times as much, and persons with both types of complications more than four times as much. Within the group of patients with microvascular com-plications, isolated retinopathy was associated with particularly high costs. The same was true for isolated cerebrovascular disease within the group of patients with macrovascular complications. The character of these findings remained unchanged after further stratifying by both treatment type and complication status, by quartiles of the duration of diabetes, and by quartiles of the last measured HbA1c value (data not shown.)
Cost correction for adjuvant materials
The utilization of glucose monitoring strips was estimated at CHF 15 per month. Glucose monitoring devices were assumed to be exchanged every two years. The mean costs of all other adjuvant materials were estimated to be CHF 0.50 per day in those using insulin. These assumptions lead to an estimate of the costs of adjuvant materials of CHF 320 (€ 212) per year. Cost correction by application of attributable risks
Available evidence allows for the assumption that the relative risk of coronary heart disease in persons with diabetes is in the range of 2.5.17–21 This corresponds to an attributable risk of 0.6. The relative risk of stroke can be assumed to be 4, with an attributable risk of 0.75.22–24 Studies on cataract indicated an odds ratio of cataract surgery in persons with compared to persons without diabetes of 1.8 to 2.5. If the rare disease assumption is made, the corresponding relative risk can be estimated to be in the range of 2, and the attributable risk to be in the range of
0.5.25–27 Application to the cost results of this analysis reduces mean inpatient costs to CHF 1,557, mean costs of consultations and outpatient services to CHF 262, mean medication costs to CHF 889, and mean direct costs to CHF 3,004 (table 4). The relative size of the different cost factors is hardly affected. Applying both the attributable risk correction and the correction for the adjuvant materials changes the primary cost estimate to CHF 3,324 (€ 2,201).
Total healthcare expenditures for type 2 diabetes in Switzerland Studies to determine the exact prevalence of type 2 diabetes in Switzerland have not been published. According to an estimate of the Swiss Diabetes Association there are 250,000 patients with type 2 diabetes in Switzerland. Combining this number with the cost figure of CHF 3,508 leads to an estimate of the total 1998 costs of type 2 diabetes and its complications of CHF 0.88 billion, which represents a share of 2.2% of total healthcare expenditures in Switzerland. If the corrected cost figure of CHF 3,324 is used, total costs at this level are CHF 0.83 billion or 2.1% of total healthcare expenditures in Switzerland.
DISCUSSION
Bias and cost measurement issues have to be addressed. Parti-cipation was restricted to physicians treating a minimum of 10 persons with diabetes. At least in part, this explains the low nominal participation rate of 3.6% of the physicians invited. Still, it cannot be ruled out that some selection bias was intro-duced at this level, affecting the ability to generalize the results, but there is no obvious reason to assume a link between physician participation and resource use. Also, some doctors could have chosen not to include their most problematic and expensive cases, which would have resulted in an underestimation of costs. Nevertheless, the representativeness of our sample is supported by the patient characteristics observed (table 1), which are well in the range to be expected from other European studies referring to patients with a known history of type 2 diabetes.28–30 An abstract referring to an epidemiological cross-sectional CODE-2 substudy conducted in Germany reports, among other data, cardiovascular complications in 43% of patients, neuropathy in 23%, and ophthalmological complications in 11%.31 Cardiovascular complications were observed in 23% of Table 5 Mean type 2 diabetes-related direct costs per year per patient in CHF and €, by treatment type and by complication status
Mean 95% CI Relation to mean
direct costs N CHF € a CHF € a Treatment group No treatment 17 1,732 1,147 308–3,156 204–2,090 0.49 Diet only 208 2,822 1,869 1,841–3,804 1,219–2,519 0.80 Oral antidiabetics 887 2,776 1,839 2,422–3,130 1,604–2,073 0.79 Insulin treatment 364 5,779 3,827 4,729–6,839 3,132–4,529 1.65 Complication status No complications 640 1,723 1,141 1,477–1,970 978–1,304 0.49 Microvascular 419 3,205 2,123 2,704–3,706 1,791–2,454 0.91 Nephropathyb 153 2,009 1,331 1,554–2,465 1,029–1,633 0.57 Neuropathyb 77 2,199 1,370 1,494–2,903 931–1,809 0.63 Retinopathyb 36 3,893 2,425 2,189–5,598 1,364–3,488 1.11 Macrovascular 170 5,050 3,345 3,901–6,198 2,584–4,105 1.44 Cardiovascularb 114 4,394 2,737 3,124–5,664 1,946–3,529 1.25 Cerebrovascularb 7 11,042 6,879 0–22,850 0–14,236 3.15 Peripheralb 23 3,601 2,243 1,358–5,843 846–8,869 1.03
Micro- and macrovascular 215 8,475 5,613 6,598–10,351 4,370–6,855 2.42
a: Exchange rate: CHF 1 = € 0.6623 (11.12.2000).
b: Persons with isolated occurrence of the named complication. No other complication.
patients only, but similar shares of patients with microvascular complications. Part of this discrepancy may arise from different definitions, e.g. a possible inclusion of hypertension in the definition of CHD in the CODE-2 substudy. Another part may be due to the fact that our questionnaire explicitly referred to a time interval of 12 months. This may have caused an under-reporting of CHD in patients who were not affected by a CHD-related event during the observation period.
Our method of cost measurement reflects the availability of data in Switzerland. Many cost-of-illness studies in the field of diabetes used ‘top-down’ approaches, particularly in the USA.15,32 They were based on national aggregate databases and on general population surveys of health, healthcare, disability, and mortality. In Switzerland, only very few healthcare data are available on an aggregate level. ‘Bottom-up’ studies are an accepted alternative in this kind of situation, albeit they are subjected to the risks of extrapolation if statements at the popu-lation level are required. In general terms, they allow for more precise cost estimates, as individual utilization patterns are observed directly rather than estimated from aggregate data. On the other hand they tend to be conservative, the main reason being the near-impossibility to measure all potentially relevant consumptions of resources.
In particular, three facts hint at a certain underestimation of the true costs of type 2 diabetes and its complications in this study: 1) physicians may not have had a complete overview of all resource utilizations of their diabetic patients. They may not have learned of some consultations of specialized physicians, and they surely did not record out-of-pocket expenses. Also, physicians’ charts do not document all cost-inducing details of, for example, patients’ inpatient episodes. 2) Services provided by physiotherapists or dieticians and the costs of long-time hospice care could not be taken into account in our calculations. The costs of adjuvant materials such as glucose monitoring
devices and strips could only be estimated. 3) The exclusion of incident and dying cases implies a certain underestimation of costs and a potential limitation of the generalizability of our results to all Swiss patients with type 2 diabetes. However, the results of Brown et al., referring to the costs of US patients with type 2 diabetes during the first eight years after diagnosis, support the expectation that the underestimation induced is relatively small.
Showing the costs of patients with different kinds of isolated diabetic complications (table 5) is illustrative but may, to a certain extent, be misleading. Persons with additional conditions may have different costs with respect to the complication in question. On the other hand, if all persons with this complication are considered, unregarding the presence of other conditions, its relative contribution remains again unclear.
A major point to discuss is the assessment of the costs of diabetes complications in general. The question of the share of diabetes is easily answered with respect to microvascular disease, but not regarding macrovascular disease which is present in the general population as well. Some US studies used epidemiological population-attributable risk formulas to assess the diabetes-related costs of macrovascular disease, but, due to the lack of large databases, reliable attributable risk figures are difficult to generate in Switzerland.5,33 Other studies, like CODE-2, measured total healthcare costs of persons with type 2 diabetes, but the resulting figures are of limited use without a control group.1,28 Including an adequate control group would have been beyond the scope and possibilities of this study. Therefore, diabetes-related costs were measured, and complication costs were included in total. In a second step, literature-derived relative risks were used to estimate the diabetes attributable risks (at the patient level) of macrovascular disease and cataract.15,16 Using these, corrected costs were calculated. These can be viewed as a broad estimate of the costs of type 2 diabetes itself. Table 6 Examples of cost of illness studies in the field of diabetes
Reference Parameter Rubin et al. 19944 American Diabetes Association 19985 Brown et al. 199934 Henrikkson et al. 199830 Detournay et al. 199936 Jönsson 2002 (CODE-2)28 Country and year of reference
USA, 1992 USA, 1997 USA, 8 years from 1988–1995
Sweden, 1994 France, 1998 Eight European countries, 1999 Patient group
Non-institutionalized patients with diabetes Patients with diabetes Incident patients with type 2 diabetes Patients with diabetes Patients with type 2 diabetes Patients with type 2 diabetes Top-down or bottom-up
Bottom-up Bottom-up Bottom-up Top-down Review Bottom-up
Costs measured or assessed Total direct healthcare costs of persons with diabetes Costs of diabetes and attributable complication costs Total direct healthcare costs of persons with diabetes Costs of diabetes and complication costs Total direct healthcare costs of persons with diabetes Total direct healthcare costs of persons with diabetes Source and method of cost measurement
Survey data Diagnostic category data, application of attributable risk procedures HMO electronic medical record data Administrative databases Published materials Medical records, patient questionnaires
Control group Yes Not applicable Yes Not applicable Yes No
Cost estimate (Excess) costs of persons with diabetes Costs of diabetes and its complications (Excess) costs of persons with type 2 diabetes, first 8 years from diagnosis Costs of diabetes and its complications Excess costs of persons with type 2 diabetes (Total direct) costs of persons with diabetes Direct medical costs per person-year Excess US-$ 6,889 = € 7,769a US-$ 2,600 = € 2,923a US-$ 2,257 = € 2,545 SEK 18,600 = € 2,165a FF 10,000 = € 1,524a € 2,834
a: Direct medical costs per person-year calculated from the reference paper. Exchange rates: US-$ 1 = € 1.12780, SEK 1 = € 0.11640, 1 FF = € 0.15240
The characteristics of some important reference studies on the cost of diabetes are summarized in table 6. US studies tend to report higher costs than European studies.4,5,15,33 This can in part be explained by differential characteristics of the US and European healthcare and accounting systems, by methodological differences, and by the way of presentation. The American Diabetes Association (ADA) reported US costs attributable to type 1 and type 2 diabetes in 1997 of US-$ 98.2 billion.5 As in our case, costs were calculated on the basis of a ‘bottom-up’ approach and of attributable risk procedures, but the assessment of resource utilisation was more comprehensive.15 Reported direct medical costs of $ 44.1 billion equal 4.5% of the total US healthcare expenditures in 1997, comprising the costs of diabetes itself and its chronic complications, as well as the costs of an excess prevalence of general medical conditions observed in diabetes patients, which we didn’t measure. Thus, the figure to directly compare our results with is US-$ 19.5 billion only, corresponding to US-$ 2600 per patient with diabetes (according to the prevalence estimate of 3% used in the ADA study), and to 2% of the total 1997 US healthcare expenditures. Obviously these results are well in the same range as ours, especially in relative terms and regarding the fact that the presumably higher costs of type 1 diabetes are included here.
Another frequently cited study is the one by Rubin et al., which estimated that persons with type 1 or type 2 diabetes accounted for 14.6% of total US healthcare expenditures in 1992.4 This figure refers to the total healthcare expenditures caused by persons with diabetes, and not to diabetes-related costs only. Also, it is based on a prevalence estimate of 4.5% which is derived from broad inclusion criteria on the basis of self-reporting. With these facts in mind the difference between the results of Rubin and colleagues and our own estimates looses its out-of-range quality.
Brown et al. conducted an analysis of electronic HMO patient records, assessing the costs of patients with type 2 diabetes during the first eight years after diagnosis.34 They reported yearly excess costs of US-$ 2,257 (€ 2,545) compared to matched nondiabetic patients. Their variation over the period observed was small. Only few single-country cost of illness studies of diabetes have been performed in Europe. Two studies conducted in the UK and Sweden both used a ‘top down approach’ relying on public registries.30,35 The latter reported 1994 costs of about SEK 18,600 (€ 2,000) per person-year. A 1998 French review yielded excess costs of persons with type 2 diabetes of FF 10,000 (€ 1,524).36
The Costs of Diabetes in Europe – Type 2 (CODE-2) study was conducted in eight European countries and, similar to Rubin et al., measured direct healthcare expenditures for people with diabetes instead of diabetes-related expenditures only.28 Thus, somewhat higher cost results than ours are expected. In fact, CODE-2 calculated mean direct per capita healthcare expenditures of € 2,834 per person-year.28
Overall, the results reported in the international literature correspond well with our corrected estimate of CHF 3,324 (€ 2,201).
Our findings that in-patient costs account for the largest single share of direct medical expenditures related to diabetes and that complication status strongly influences per capita costs is con-firmed by virtually all international studies.4,5,15,33,37
The results from CODE-2 are in line with many of our more detailed observations. They confirm that the presence of com-plications is responsible for an impressing increase in per capita costs.28,38 This is particularly true if macro- and microvascular complications are present at the same time.29 In CODE-2 as in our study, hospitalizations are the most important single factor contributing to the direct costs of type 2 diabetes.28 They represent a share of 30–65% of the total direct costs in the CODE-2 countries, compared to 52.9% in Switzerland. Oral antidiabetic drugs account for a proportion of 2–7% in CODE-2
and for 7.4% in the study presented here. Our observation of a dependence of direct costs on treatment type is also mirrored in CODE-2.38
The observation that the costs of diet-treated patients and of patients treated with oral antidiabetic drugs were nearly identical results from distinctly higher inpatient costs in the former group. The difference observed, though, is far from statistical signi-ficance (p=0.55). An artefact may be the most likely explana-tion. Both groups were similar in many respects, and no con-clusive differences favouring the drug-treated group were seen in the number of hospitalisations or the share of complications and revascularization procedures. Outliers were neither playing an important role.
In Switzerland, as in other countries, type 2 diabetes is a disease which not only has an important medical but also an enormous economic impact. It is a challenge for the Swiss as well as any other healthcare system to allocate resources for the prevention of type 2 diabetes and its complications instead of simply accept-ing very high treatment costs for these conditions. Our results confirm this despite their conservative nature. Future studies will have to refine our assessment of direct and especially indirect costs, to get the full picture into view.
This study was supported by an unrestricted, educational grant from Novartis, Switzerland.
REFERENCES
1 Amos AF, McCarty DJ, Zimmet P. The rising global burden of diabetes and its complications: estimates and projections to the year 2010. Diabet Med 1997;14(Suppl.5):S1-85.
2 Bonney RC. Diabetes: therapeutic advances and market opportunities. 1st ed. London: PJB Publications Ltd, 1998.
3 The World Bank. World Development Report (1993). Investing in Health. Oxford: Oxford University Press, 1993.
4 Rubin RJ, Altman WM, Mendelson DN. Healthcare expenditures for people with diabetes mellitus, 1992. J Clin Endocrinol Metab 1994;78(4):809A-F.
5 American Diabetes Association. Economic consequences of diabetes mellitus in the U.S. in 1997. Diabetes Care
1998;21(2):296-309.
6 Palmer AJ, Sendi PP, Spinas GA. Applying some UK Prospective Diabetes Study results to Switzerland: the
cost-effectiveness of intensive glycaemic control with metformin versus conventional control in overweight patients with type-2 diabetes. Schweiz Med Wochenschr 2000;130(27-28):1034-40.
7 Palmer AJ, Weiss C, Sendi PP, et al. The cost-effectiveness of different management strategies for type I diabetes: a Swiss perspective. Diabetologia 2000;43(1):13-26.
8 Gozzoli V, Palmer AJ, Brandt A, Sinas GA. Economic and clinical impact of alternative disease management strategies for secondary prevention in type 2 diabetes in the Swiss setting. Swiss Med Wkly 2001;131:303-10.
9 Eidgenössisches Departement des Inneren. Analysenliste mit Tarif (1998). Bern: Eidgenössisches Departement des Inneren, 1998.
10 Paritätische Kommission Spitalleistungskatalog. Spitalleistungskatalog (1997). Bern: Paritätische Kommission Spitalleistungskatalog, 1997.
11 Spitex-Tarifverträge, Sept. 22nd 1999. Bern: 1999. 12 Konkordat der Schweizerischen Krankenversicherer. Tagestaxen in Heilanstalten (1999). Bern: Konkordat der Schweizerischen Krankenversicherer, 1999.
13 Schweizerischer Verband für Gemeinschaftsaufgaben der Krankenversicherer. SVK Geschäftsbericht (1997). Solothurn: Schweizerischer Verband für Gemeinschaftsaufgaben der Krankenversicherer, 1997.
14 Arzneimittelkompendium der Schweiz (1999). Basel: Documed, 1999.
15 Songer TJ, Ettaro L, Economics of Diabetes Project Panel. Studies on the cost of diabetes. Atlanta: Diabetes Translation Centers of Disease Control and Prevention, 1998.
16 Ray NF, Thamer M, Taylor T, Fehrenbach SN, Ratner R. Hospitalization and expenditures for the treatment of general
medical conditions among the U.S. diabetic population in 1991. J Clin Endocrinol Metab 1996;81(10):3671-9.
17 Lerner DJ, Kannel WB. Patterns of coronary heart disease morbidity and mortality in the sexes: a 26-year follow-up of the Framingham population. Am Heart J 1986;111(2):383-90.
18 Chang M, Hahn RA, Teutsch SM, Hutwagner LC. Multiple risk factors and population attributable risk for ischemic heart disease mortality in the United States, 1971-1992. J Clin Epidemiol 2001;54(6):634-44.
19 Currie CJ, Morgan CL, Peters JR. Patterns and costs of hospital care for coronary heart disease related and not related to diabetes. Heart 1997;78(6):544-9.
20 Folsom AR, Szklo M, Stevens J, Liao F, Smith R, Eckfeldt JH. A prospective study of coronary heart disease in relation to fasting insulin, glucose, and diabetes: the Atherosclerosis Risk in Communities (ARIC) Study. Diabetes Care 1997;20(6):935-42.
21 Gillum RF, Mussolino ME, Madans JH. Diabetes mellitus, coronary heart disease incidence, and death from all causes in African American and European American women: the NHANES I epidemiologic follow-up study. J Clin Epidemiol 2000;53(5):511-8. 22 Rohr J, Kittner S, Feeser B, et al. Traditional risk factors and ischemic stroke in young adults: the Baltimore-Washington Cooperative Young Stroke Study. Arch Neurol 1996;53(7):603-7.
23 Currie CJ, Morgan CL, Gill L, Stott NC, Peters JR. Epidemiology and costs of acute hospital care for cerebrovascular disease in diabetic and nondiabetic populations. Stroke 1997;28(6):1142-6.
24 Stegmayr B, Asplund K. Diabetes as a risk factor for stroke: a population perspective. Diabetologia 1995;38(9):1061-8.
25 Tavani A, Negri E, La VC. Selected diseases and risk of cataract in women: a case-control study from northern Italy. Ann Epidemiol 1995;5(3):234-8.
26 Delcourt C, Cristol JP, Tessier F, Leger CL, Michel F, Papoz L. Risk factors for cortical, nuclear, and posterior subcapsular cataracts: the POLA study. Pathologies Oculaires Liees a l’Age. Am J Epidemiol 2000;151(5):497-504.
27 Rowe NG, Mitchell PG, Cumming RG, Wans JJ. Diabetes,
fasting blood glucose and age-related cataract: the Blue Mountains Eye Study. Ophthalmic Epidemiol 2000;7(2):103-14.
28 Jönsson B. Revealing the cost of Type II diabetes in Europe. Diabetologia 2002;45(7):S5-S12.
29 Liebl A, Neiss A, Spannheimer A, Reitberger U, Wagner T, Gortz A. [Costs of type 2 diabetes in Germany: results of the CODE-2 study]. Dtsch Med Wochenschr 2001;126(20):585-9.
30 Henriksson F, Jonsson B. Diabetes: the cost of illness in Sweden. J Intern Med 1998;244(6):461-8.
31 Goertz A, Liebl A, Neiss A, Spannheimer A, Reitberger U. Evaluation of complications in diabetes type 2 patients: results of CODE-2 [abstract]. Diabetologia 2000;43(Suppl.1):A234.
32 Thom TJ. Economic costs of neoplasms, arteriosclerosis, and diabetes in the United States. In Vivo 1996;10(2):255-9.
33 Ray N, Willis S, Thamer M. Direct and Indirect Costs of Diabetes in the United States in 1992. 1st ed. Alexandria, VA: American Diabetes Association, 1993.
34 Brown JB, Nichols GA, Glauber HS, Bakst AW. Type 2 diabetes: incremental medical care costs during the first 8 years after diagnosis. Diabetes Care 1999;22(7):1116-24.
35 Currie CJ, Kraus D, Morgan CL, Gill L, Stott NC, Peters JR. NHS acute sector expenditure for diabetes: the present, future, and excess in-patient cost of care. Diabet Med 1997;14(8):686-92.
36 Detournay B, Vauzelle-Kervroedan F, Charles MA, et al. Epidemiologie, prise en charge et cout du diabete de type 2 en France en 1998. Diabetes Metab 1999;25(4):356-65.
37 Brown JB, Pedula KL, Bakst AW. The progressive cost of complications in type 2 diabetes mellitus. Arch Intern Med 1999;159(16):1873-80.
38 Bakst A, Wisner CL, Kirsch J, Hood S, Mera R. The Cost of Diabetes in Europe - Type 2 Study: micro- and macrovascular complications and disease progression are primary independent drivers of increased costs in diabetes [abstract]. Diabetologia 2000;43(Suppl.1):A 70.
Received 18 April 2002, accepted 26 November 2002