A Long-Lasting Relaxation of Seismicity at Aswan Reservoir, Egypt, 1982-2001
14
0
0
Texte intégral
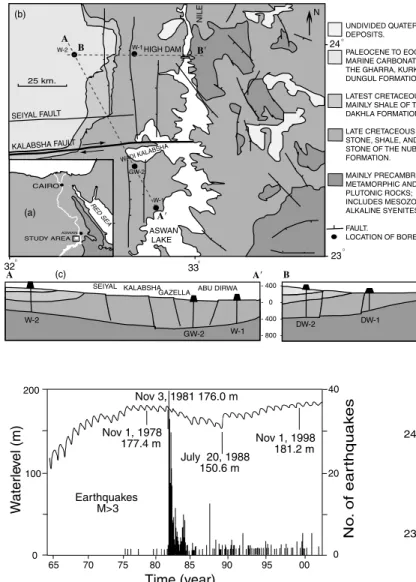
(2) 480. M. Mekkawi, J.-R. Grasso, and P.-A. Schnegg. south fault systems, as well as a regional uplift, characterize the northern part of Lake Aswan (El-Shazly, 1977). Data on these features indicate that right-lateral strike-slip movement is the dominant mechanism along the Kalabsha fault zone. Igneous and metamorphic intrusions are distributed in several localities on the western side of the lake and constitute the main geological formation of the eastern side. Information from the boreholes indicates that the average thickness of the Nubian formation and whole sedimentary column is approximately 500 m (Fig. 2c). Induced Earthquakes. (b) 6. 7 5. Mediterranean sea 4. 0. -. 30. Cairo. 1. Egypt. Libya. 3. 2. ed. R a. se. 10. Aswan 8. -. 25. 0. -. Sudan. 0. -. 20. 9. 35. 0. Figure 1.. (a) Distribution of earthquake epicenters around Egypt for the time period 1900–1998. Lines denote the major tectonic elements (adapted from ElSayed et al. [2001]). (b) Seismogenic zones with focal mechanisms in Egypt and its vicinity (adapted from El-Sayed et al. [2001]). 1, Gulf of Aqaba-Levant; 2, Northern Red Sea–Gulf of Suez; 3, Suez–Cairo– Alexandria; 4, Eastern Mediterranean–Cairo–Fayourn; 5, Mediterranean costal; 6, Cyprus; 7, Crete; 8, Gill el-keber; 9, Aswan; 10, Qena zone.. from Late Cretaceous to Eocene (Fig. 2b). Overlying the Nubian formation in some places are the Kurkur and Gurra formations. The Quaternary is represented by calcite and Nile deposits (Issawi, 1978, 1982). Geomorphologically, the area is flat with relief varying from 150 to 350 m. The topography is complicated by structural faults and also by the presence of several alkali granites and a syenite ring complex. Tectonic features dominated by east–west and north–. Reservoir-induced seismicity (RIS) is the triggering of earthquakes by the physical processes that accompany the impoundment of large reservoirs. Gupta (1992) listed 33 cases of RIS that triggered M ⬎4 earthquakes. Roeloffs (1988) and Simpson et al. (1988) have suggested how some reservoirs can induce earthquakes immediately upon filling due to elastic stress changes and after a delay as a result of pore pressure and fluid diffusion. The filling of large reservoirs modifies the tectonic stress regime, either by increasing the vertical stress through the effect of loading or by increasing the pore pressure, which results in a decrease of the effective normal stress. The net effect on existing fault zones is to increase or decrease stresses depending on the orientation and the geometry of the reservoir and the fault system (Snow, 1972; Gupta and Rastogi, 1976; Bell and Nur, 1978; Roeloffs, 1988). The mechanics of RIS involve a complex interaction between shear stress, normal stress, and pore pressure. In the case of strike-slip faulting of the Aswan area (Fig. 1), water loading and pore pressure tend to decrease fault stability, increasing the seismic activity on these faults (e.g., Roeloffs, 1988). Kebeasy et al. (1982) suggested that the Aswan reservoir seismicity is reservoir triggered. The major event up to now in the Aswan area is the M 5.4 14 November 1981 earthquake (Fig. 3). This event was preceded by events on 9 November (M 3.6 and 4.2) and one event on 11 November (M 4.5). It was followed by an extended sequence of aftershocks (e.g., Simpson et al., 1990). Using the recordings from regional stations, the Aswan mainshock was located at a depth of 18–20 km (e.g., Simpson et al., 1990). The Aswan reservoir is shallow by world standards, with a maximum depth of 70 m being confined to the narrow channel of the Nile River. The water level in the embayment where the earthquakes have occurred is less than 10 m. Simpson et al. (1990) suggested that the flooding of the porous Nubian sandstone beneath the embayment (Fig. 2) created an effective load whose impact greatly exceeded that of the reservoir itself. The mainshock location, the linear trends of aftershock location, and the focal mechanisms all argue for the seismicity to be related to the Kalabsha fault, an ancient right-lateral strike-slip structure that extends west from the Nile channel (Figs. 3, 4, 5). This suggestion gained credence in 1982 following the occurrence of a remarkable seismic sequence in August 1982 during the seasonal increase in the.
(3) 481. NILE. A Long-Lasting Relaxation of Seismicity at Aswan Reservoir, Egypt, 1982–2001. (b). Figure 2.. (a) Location map of the study area and basement distribution (after Said [1962]). (b) Regional geological and tectonic settings of Aswan area. (c) Borehole location (after Issawi [1969, 1978]).. N UNDIVIDED QUATERNARY DEPOSITS.. A B. W-2. W-1 HIGH. DAM. 24. B⬘. O. PALEOCENE TO EOCENE MARINE CARBONATES OF THE GHARRA, KURKUR, AND DUNGUL FORMATIONS.. 25 km.. LATEST CRETACEOUS ROCKS, MAINLY SHALE OF THE DAKHLA FORMATION.. SEIYAL FAULT LT KALABSHA FAU I WAD. AB KA L. LATE CRETACEOUS SANDSTONE, SHALE, AND IRONSTONE OF THE NUBIAN FORMATION.. SHA. GW-2. MAINLY PRECAMBRIAN METAMORPHIC AND PLUTONIC ROCKS; INCLUDES MESOZOIC ALKALINE SYENITES.. CAIRO W-1. D RE r r R. A⬘. SE. (a). A. FAULT. LOCATION OF BOREHOLES.. ASWAN LAKE. ASWAN. STUDY AREA. O. 23. NMR O. O. 32 A. 33. (c). B. A⬘. B⬘. - 400 -. I. ABU DIRWA. I. SEIYAL KALABSHA GAZELLA. -. I. - 0. I. - 400 -. DW-1. I. W-2. I. W-1. DW-2. - 800 I. GW-2. I I. Earthquakes M>3. I. UMS 23°. LA K E. 20. 24°. A S W A N. 100. Nov 1, 1998 181.2 m. Aswan City HIGH DAM ARSC KUR MAN NMR AHD SKD KRL GRW GMR KSR GAL WKL WAL NAL. I. July 20, 1988 150.6 m. I. Nov 1, 1978 177.4 m. I. 40. Nov 3, 1981 176.0 m. No. of earthquakes. NMAS. 0. 0 65. 70. 75. 80. 85. 90. 95. 00. KHF. Figure 3. Water level (in meters) relative to sea level and seismicity (M ⱖ3) on Aswan Lake (1965– 2002). The 110-m level corresponds to the lake floor.. I. Time (year). 22°. ADN. I. Waterlevel (m). 200. Seismic station I. I. I. II. I. The historical activity in Aswan starts 2600 years ago, when earthquake damage was reported in 600 B.C. and A.D. 967 and 1899 in Luxor, 200 km north of Aswan. It is worth mentioning that an earthquake damaged the temple at Abu Simbel, 230 km south of Aswan, in 1210 B.C. (Maamoun et al., 1984). Before 1981, information on seismicity in the Aswan region was limited by the lack of local seismographs. The first short-period seismographs installed in Aswan were the SMK Soviet instruments, in 1975. Although the operation of the stations was irregular prior to 1981, M ⬎2.5 events. 32°. I. The Aswan Seismic Catalog. 31°. 33°. I. reservoir level. Simpson et al. (1988) identified the 1981 sequence that occurred in the Aswan reservoir area 15 years after the impoundment started as delayed reservoir-triggered seismicity. This long-lasting seismic episode, which has been active since 1982, was still active in 2001.. 34°. Figure 4. Seismograph network around Aswan Lake (adapted from Kebeasy and Tealeb [1997]). were recorded, 13 events taking place during the August 1980–August 1981 period (Simpson et al., 1990; Kebeasy and Gharib, 1991). This was confirmed by Gibowicz et al. (1982), who reported that a few small shocks (M ⬍3) were detected in the southwest part of Lake Aswan in January 1981 during a reconnaissance survey. After flooding of the eastern segment of the Kalabsha fault in the 1978–1981 period, the seismicity that is still going on began in this zone (Figs. 3, 5). A telemetry network (Aswan Seismograph Network [ASN]) was established around this northern part of Aswan Lake in July 1982. Each field station is equipped with a single-component vertical seismometer (mod. S13), an amplifier/VCO, radio telemetry, and a solar battery. Since 1989,.
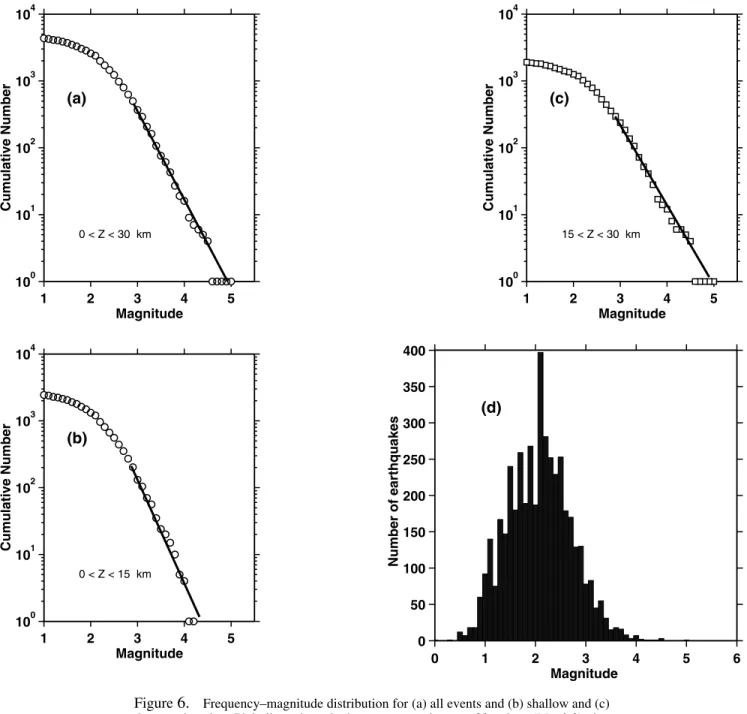
(4) 482. M. Mekkawi, J.-R. Grasso, and P.-A. Schnegg. A. main shock of 14 Nov. 1981.. 23.6. K2. V. *. GAZELLE FAULT. ABU DIRWA. K1. 23.2 32.2. K5. K3. KALABSHA FAULT. 23.4. DABUD FAULT. 32.6. 32.4. As wa nL ak e. SEIYAL FAULT. ARAQ. Latitude. 23.8. KHOR EL-RAM LA. L EL-B. (a). Aswan High Dam. KURKUR FAULT. GEBE. 24.0. K4. 32.8. 33.0. Longitude -. 10 -. (b) main shock of 14 Nov. 1981.. * V. Depth (km). 0. 20 -. I. 30 32.2. I. I. 32.6. 32.4. I. 32.8. I. 33.0. Longitude -. 10 -. Water Level and Seismicity Rate in the Aswan Reservoir Area. (c) main shock of 14 Nov. 1981.. V. Depth (km). 0. 20 -. *. I. 30 23.2. contains about 4500 events (1.0 ⬍ Ml ⬍ 5.4). The seismicity is concentrated along the easternmost section of Kalabsha fault, particularly at the intersection between the north–south and east–west fault systems (Fig. 5). The easternmost segment of the Kalabsha fault is located beneath a large area covered by water and extends over more than 150 km. It consists of several segments forming a conjugate fault pattern. The seismicity is concentrated in main cluster zones. The K1 cluster, located on the Kalabsha fault, is the only deep cluster with depths greater than 15 km. The seismicity of the other zones is characterized by shallow depths (⬍15 km), and it is localized on the north–south fault system intersecting the Kalabsha fault (Simpson et al., 1990; Kebeasy and Gharib, 1991). Because our objective is to analyze the seismicity pattern over time, we must determine for which magnitude range the Aswan catalog is complete. This is usually performed by examining the magnitude–frequency distribution of earthquakes. The Gutenberg–Richter (1956) relationship of the frequency–magnitude distribution is defined as logN ⳱ a ⳮ bM, where N is the cumulative number of earthquakes and a and b are constants. In Figure 6d, and using the evolution of b-values with magnitude and time, the magnitude completeness is in the 2.2–2.8 range. In order to have a trade-off between a minimum of data for a statistical analysis and catalog completeness, we use two threshold values. For space and time analysis we use the M ⱖ 2.2, and for analysis in the energy domain we bound our data to M ⱖ2.8.. I. I. I. I. 23.4. 23.6. 23.8. 24.0. Latitude. Figure 5. (a) The spatial distribution of earthquakes in the Aswan area, M ⬎ 2.2 The seismicity is concentrated in main cluster zones: Gebel Marawa (K1), Khore El-Ramla (K2), East Gebel Marawa (K3), Abu Dirwa (K4), and an old stream zone (K5). (b,c) Vertical cross sections for M ⱖ2.2 events. The black arrow locates the hypocenters of the 14 November 1981 M 5.4 mainshock.. the ASN has consisted of 13 field stations. The seismic data are recorded at the Aswan Regional Seismological Center, southwest of Aswan City (Fig. 4). The data listed in the Aswan catalog have been recorded by at least four stations. Using the Hypo71 code (Lee, 1990), estimates of location errors are on the order of a few kilometers. The earthquake catalog of the ASN (1982–2001). Several studies have shown similarities between the temporal distribution of seismicity and reservoir level following the construction of the High Dam (e.g., Simpson et al., 1990; Kebeasy and Gharib, 1991, Awad and Mizoue, 1995). They concluded that the increase in seismic activity was linked to water-level variation. When the water recovered away from zone K1 (Fig. 5), seismicity decreased. When comparing water level and seismicity in the 1982– 2001 period (Fig. 7), the correlation between level fluctuations and seismicity is difficult to assess. As an example, the gradual decrease of the seismicity rate in the 1982–1988 period could be correlated to the simultaneous decrease of the water level. However, such a decrease of seismicity over time after an M 5.4 event is the generic aftershock sequence for most natural earthquakes (Omori, 1894). Analysis of seismicity rate in the 1982–1990 period by Mahmoud et al. (1998) confirms the exponent value of the Omori law close to unity, that is, a standard value for tectonic earthquakes (Utsu et al., 1995). Accordingly, the observed decrease of the seismicity rate in the 1982–1988 period below Aswan reservoir can be expected as from a natural seismicity pattern, without any requirement for water-level decrease. In order to characterize the link between water level and seismicity rate, we study the annual correlation between.
(5) 483. A Long-Lasting Relaxation of Seismicity at Aswan Reservoir, Egypt, 1982–2001 4. 4. 10. 10. 3. Cumulative Number. Cumulative Number. 3. 10. (a) 2. 10. 1. 10. 10. (c) 2. 10. 1. 10. 0 < Z < 30 km. 15 < Z < 30 km. 0. 0. 10. 10 1. 2. 3 4 Magnitude. 5. 1. 4. 2. 3 4 Magnitude. 5. 400. 10. 350. (d) Number of earthquakes. Cumulative Number. 3. 10. (b) 2. 10. 1. 10. 0 < Z < 15 km. 300 250 200 150 100 50. 0. 10. 1. 2. 3 4 Magnitude. 5. 0 0. 1. 2. 3 Magnitude. 4. 5. 6. Figure 6. Frequency–magnitude distribution for (a) all events and (b) shallow and (c) deep earthquakes. Plain lines show the least-square estimates of b-values (M ⱖ2.8), that is, 1.4 Ⳳ 0.11, 1.5 Ⳳ 0.03, and 1.3 Ⳳ 0.03, repectively. Estimates of b-values from maximum likelihood confirm a significative change of b-values with depth (see text for details). (d) Histogram of magnitude. The large peak value close to M 2.1 argues for the catalog completeness to be above M 2.1. Accordingly we used M ⱖ2.2 on Figures 5–12 when analyzing temporal and spatial seismicity patterns. For the energy pattern (b-value), we restrict our catalog to M ⱖ2.8. water-level variations and seismicity. The water level is characterized by an annual cycle with a high in November– December and a low in July–August. The correlation is carried out for all events, shallow events, and deeper earthquakes (Fig. 8) and for magnitudes greater than 2.2. The Aswan seismicity is separated into shallow and deep seismic zones (Fig. 5). Shallow events have focal depths between 0.1 and 15 km; deep events extend from 15 to 30 km. In Figure 8 we observed a phase shift between the two time. series, that is, a time delay between water level, the hypothesized cause, and earthquakes. The time delays are 2 and 4 months for shallow and deep seismicity, respectively. In the frequency domain, well-resolved peaks of water level and seismicity are shown at 1 yrⳮ1 (Fig. 9). The strongest seismicity peak is obtained for the deepest events in the earliest period. This peak value weakens for the deep and shallow events in the 1989–2001 period (Fig. 10). The analysis presented here only deals with long-term harmonic changes in.
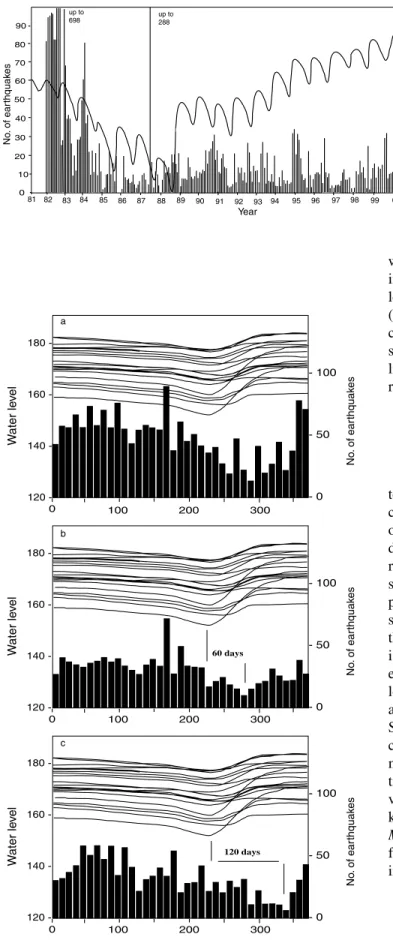
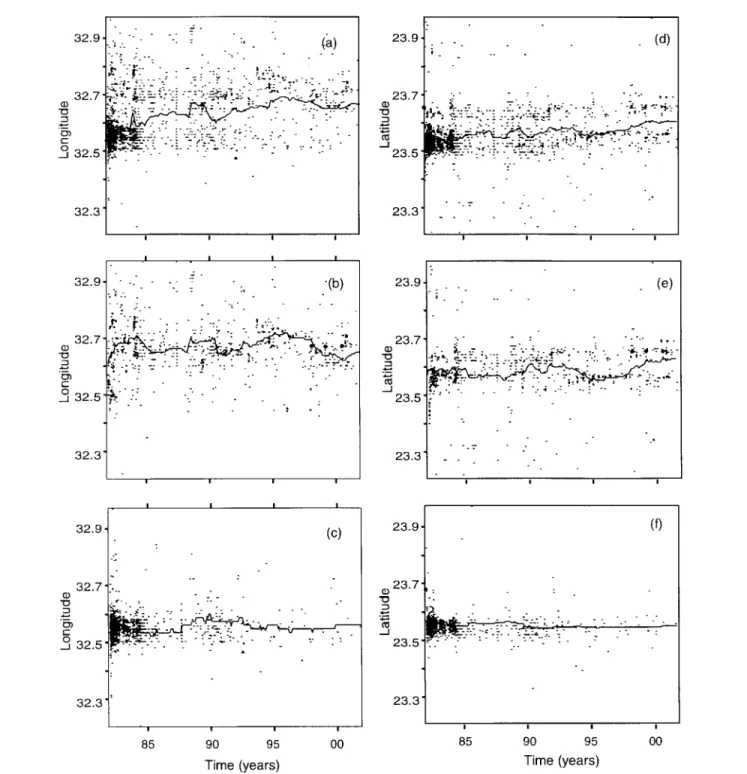
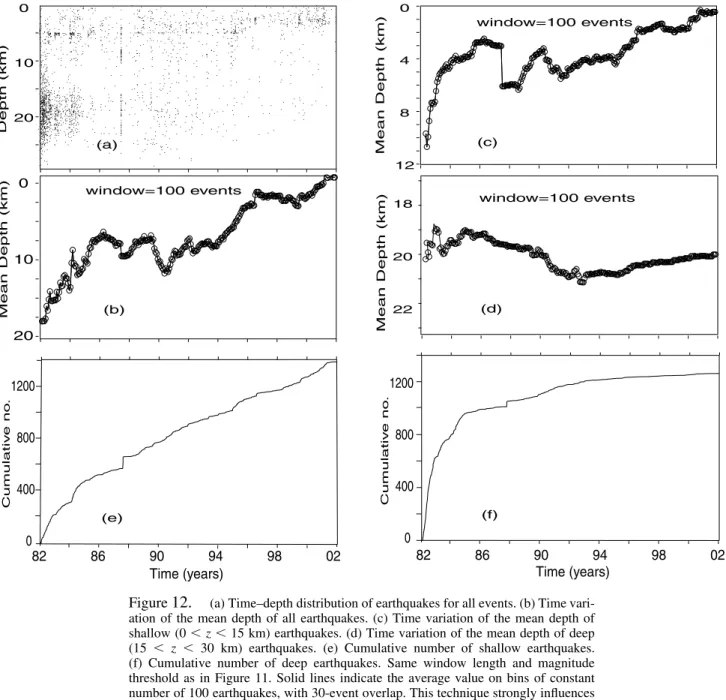
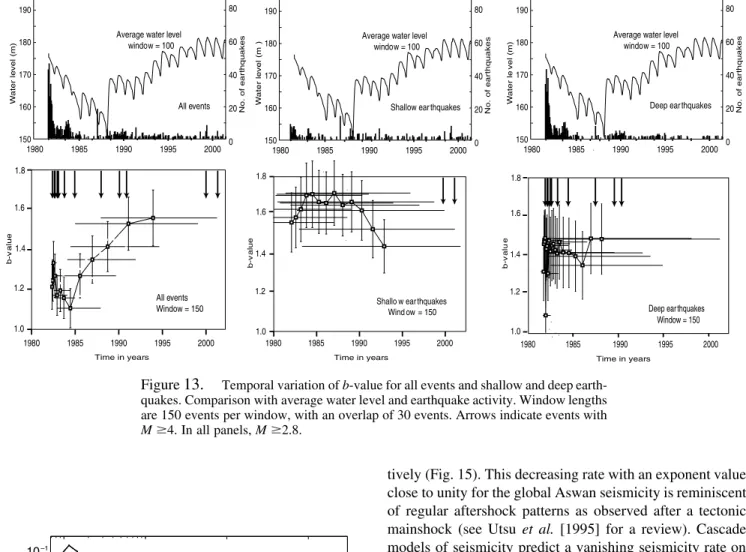
(6) 484. M. Mekkawi, J.-R. Grasso, and P.-A. Schnegg. up to 698. 90. Figure 7.. Monthly seismicity rate (M ⱖ2.2) and water level (in meters) during the 1982–2001 period.. up to 288. 185. 180. 70 60. 175. 50 170. 40. Lake level. No. of earthquakes. 80. 165. 30 20. 160. 10 155. 0. 81 82. 83. 84. 85. 86. 87. 88. 89. 90. 91. 92. 93. 94. 95. 96. 97. 98. 99. 00. 01. Year. a. - 50. 100. 200. -. -. -. -. -. -. 120 0. -. 140 -. -. Water level. - 100 160 -. No. of earthquakes. 180 -. -0. 300. b. - 50. 100. 200. -. -. -. -. -. -. 120 0. -. 60 days. 140 -. -. Water level. - 100 160 -. No. of earthquakes. 180 -. -0. 300. c. 120 days. - 50. 100. 200. -. -. -. -. -. -. 120 0. -. 140 -. -. Water level. - 100 160 -. -0. 300. Figure 8. Correlation between seismicity rate per 10 days (histogram) and water level (lines) during 20 years for (a) all events and (b) shallow and (c) deep earthquakes.. No. of earthquakes. 180 -. water depth, that is, three cycles per year, 100 days or longer, in Figures 9–10. We cannot detect the influence of the water level on a shorter timescale. Simpson and Negmatullaev (1981) and Simpson et al. (1990) suggested that abrupt changes in water level as short as days can influence the seismicity rate and can provide an additional indicator of the link between water level and seismicity at Nurek and Aswan reservoirs.. Evolution of the Seismicity Patterns during the Period 1982–2001 To evaluate the seismicity patterns, we used statistical techniques, such as average spatial behavior, fractal spatial clustering, and b-value change over time. The major trend of hypocenter locations over time is the change of average depth (Figs. 11–12). A robust decrease in average depths is resolved for all events during the 1982–2001 period, with a slower decrease rate in the 1986–1994 period. In this latter period, the average depth for deep events increases at the same rate the shallow-event depth decreases. Accordingly, the observed migration of hypocenters toward shallow depth is driven by shallow events. In Figure 12, the cumulative event rate suggests a roughly constant seismicity rate of shallow events, whereas the deep events decrease through time as a relaxation law typical of aftershocks, as suggested by Simpson et al. (1990). To analyze the evolution in spatial clustering, we tentatively used the correlation integral method (Grassberger and Procaccia, 1983). Large fluctuations in the exponent of the correlation function values prevent extracting any robust pattern on the whole period (Mekkawi et al., 2002). In the energy domain, in the range 2.8 ⬉ M ⬍ 4.8, the Gutenberg–Richter distribution is recovered for the Aswan seismicity. The b-values are estimated by using the maximum likelihood method of Aki (1965): b ⳱. 1 ln(10)(具M典 ⳮ Mmin). where 具M典 is the average magnitude and Mmin ⳱ 2.8, the smallest considered magnitude. Estimates of the b-values from maximum likelihood are 1.2 Ⳳ 0.04, 1.4 Ⳳ 0.08, and.
(7) 485. A Long-Lasting Relaxation of Seismicity at Aswan Reservoir, Egypt, 1982–2001. 800 -. 1 Ⳳ 0.09 for all, shallow events, and deep events, respectively. These values argue for a change in the b-values with depth. This result is confirmed by the b-value estimates from least-square regression as 1.4 Ⳳ 0.11, 1.5 Ⳳ 0.03, and 1.30 Ⳳ 0.03 for all, shallow events, and deep events, respectively (Fig. 6). The time evolution of b-values for shallow and deep events is different as well. The b-value for deep events remains roughly constant but decreases up to 1985, whereas the b-value of shallow events increases in the 1982–1985 period and decreases after 1988 (Fig. 13).. 400 -. Discussion. 1600 -. (a) Power spectrum. 1200 -. 0 -I 0.5. I. I. I. I. I. 1.0. 1.5. 2.0. 2.5. 3.0. 1600 -. (b) Power spectrum. 1200 -. 800 -. 400 -. 0 -I 0.5. I. I. I. I. I. 1.0. 1.5. 2.0. 2.5. 3.0. 1600 -. (c) Power spectrum. 1200 -. 800 -. 400 -. 0 -I 0.5. I. I. I. I. I. 1.0. 1.5. 2.0. 2.5. 3.0. Frequency (year-1). Figure 9.. Amplitude Fourier spectra of the water level (solid line) and the seismcity rate (dashed line) during the period 1982–2001 for (a) all events and (b) shallow and (c) deep earthquakes. For all diagrams, we use a 128-day window.. Because the Aswan seismicity source is located directly beneath the second-largest man-made reservoir in the world, several authors have suggested that this seismicity is induced by the reservoir impoundment (Kebeasy et al., 1982; Simpson, 1986). In order to test the influence of water-level change on the long-term seismicity pattern, we analyze the statistical property of Aswan seismicity on the 1982–2001 period. First, the seismicity response over time is depth dependent. The Aswan seismicity has been previously proposed to be localized in two spatial swarms, respectively between shallow (⬍15 km) and deep (⬎15 km) events (Simpson et al., 1990). This pattern is still relevant for describing the seismicity pattern of the 1982–2001 period (Figs. 5b,c, 8b,c, and 12c,d). The shallow events migrate toward the surface, whereas the deep events die out. Second, the seismicity rate is correlated with the long-term harmonic changes in water level, that is, 6–12 months, but the fluctuations in seismicity in space and in energy domains do not appear to be primarily driven by the water level. We further discuss how such patterns can be unified in terms of the relative influence on the seismicity of the external loading of the system, that is, water-level change, and the genuine fluctuations in seismicity rate due to aftershock patterns. We do not address the question of whether the M 5.4 1981 event, which is the onset of our catalog, was induced by the reservoir impoundment. The depth evolution over time argues for the seismicity of Aswan to be due to a transient dynamics, not yet in equilibrium after 20 years of seismicity. The strong epicenter localization on the northern part of the lake (Fig. 5), with its small (if any) horizontal migration over 20 years (Fig. 11), attests for just one specific patch of the Kalabasha fault to have been close to failure in the Aswan area before the reservoir impoundment. The global upward migration of seismicity is driven by the shallow shallow seismicity pattern. In the energy domain, again shallow and deep earthquakes behave differently: the deep events show smaller b-values than the shallow events. Although many processes could be involved in producing b-value changes, low b-values with increasing depth appear to result from the generic transition from brittle to ductile behavior. This was proposed by model and laboratory experiments (Amitrano et al., 1999; Ami-.
(8) 486. M. Mekkawi, J.-R. Grasso, and P.-A. Schnegg 1600 -. 1600 -. (a). (d) 1200 Power spectrum. Power spectrum. 1200 -. 800 -. 400 -. 0 -I 0.5. I. I. I. I. I. 1.0. 1.5. 2.0. 2.5. 3.0. 800 -. 400 -. 0 -I 0.5. 1600 -. Power spectrum. Power spectrum. I. I. 2.5. 3.0. 1200 -. 800 -. 400 -. 0 -I 0.5. I. I. I. I. I. 1.0. 1.5. 2.0. 2.5. 3.0. 800 -. 400 -. 0 -I 0.5. 1600 -. I. I. I. I. I. 1.0. 1.5. 2.0. 2.5. 3.0. 1600 -. (c). (f). 1200 -. 1200 Power spectrum. Power spectrum. I. 2.0. (e). 1200 -. 800 -. 400 -. 0.5. I. 1.5. 1600 -. (b). 0 -I. I. 1.0. I. I. I. I. I. 1.0. 1.5. 2.0. 2.5. 3.0. Frequency (year -1). 800 -. 400 -. 0 -I 0.5. I. I. I. I. I. 1.0. 1.5. 2.0. 2.5. 3.0. Frequency (year -1). Figure 10.. Amplitude Fourier spectra for the water level (solid line) and seismicity rate (dashed line): (a, b, c) 1982–1988 period, for all events and shallow and deep earthquakes, respectively; (d, e, f) 1989–2001 period, for all events and shallow and deep earthquakes, respectively.. trano, 2003) and reported for genuine earthquakes (e.g., Mori and Abercombie, 1997; Gerstenberger et al., 2001, Sue et al., 2002). Another alternative is that the b-value variations are the result of shallow earthquakes moving toward the surface: the closer an event to the Earth’s surface, the less the probability that a large earthquake would occur at such a depth; hence the seismicity near the surface is depleted of large shocks. Therefore, if the earthquake size dis-. tribution is approximated by a pure Gutenberg–Richter law, the result should increase the b parameter (e.g., Kagan, 2002). Because a weak rolloff is observed for large magnitude for shallow events in the Aswan catalog (Fig. 6), this latter finite size effect cannot be rejected as one of the possible processes that contribute to the observed change in b-value with depth. Whatever is the process that drives the b-value change with depth, it is difficult to extract the.
(9) A Long-Lasting Relaxation of Seismicity at Aswan Reservoir, Egypt, 1982–2001. 487. Figure 11. The spatial distribution of Aswan Lake epicenters, M ⱖ2.2, during the period 1982–2001, for (a, d) all events and (b, f) shallow and (c, f) deep earthquakes, respectively. Solid lines indicate the average value on bins of constant number of 100 earthquakes, with 30-event overlap. This technique strongly influences the smooth nature of the average depth curves, enhancing the mean field properties. influence, if any, of the water-level changes on the b-values that appear just to be driven by seismicity depth. The seismicity rate is the only seismicity index that correlates with the water-level loading, for example, the annual peak on the 1982–2001 period (Fig. 9). This effect is the strongest for the deep events in the 1982–1988 period (Fig. 10c). During this period, the global Aswan seismicity fol-. lows the Omori law decrease over time with an exponent close to unity (Mahmoud et al., 1998). This argues for the Aswan seismicity rate to not be solely driven by the water level, but rather that cascades of earthquake interactions play a role in triggering seismicity. The seismicity fluctuations in space or energy as described by the b-value changes and hypocenter location through time cannot simply be related.
(10) 488. M. Mekkawi, J.-R. Grasso, and P.-A. Schnegg 0. Mean Depth (km). Depth (km). 0. 10. 20 (a). window=100 events 4. 8. (c) 12. window=100 events. Mean Depth (km). Mean Depth (km). 0. 10. (b). 20. 20. (d). 22. 1200 Cumulative no.. 1200 Cumulative no.. window=100 events. 18. 800. 400. 800. 400 (f). (e). 0 82. 0. 86. 90 94 Time (years). 98. 02. 82. 86. 90 94 Time (years). 98. 02. Figure 12. (a) Time–depth distribution of earthquakes for all events. (b) Time variation of the mean depth of all earthquakes. (c) Time variation of the mean depth of shallow (0 ⬍ z ⬍ 15 km) earthquakes. (d) Time variation of the mean depth of deep (15 ⬍ z ⬍ 30 km) earthquakes. (e) Cumulative number of shallow earthquakes. (f) Cumulative number of deep earthquakes. Same window length and magnitude threshold as in Figure 11. Solid lines indicate the average value on bins of constant number of 100 earthquakes, with 30-event overlap. This technique strongly influences the smooth nature of the average depth curves, enhancing the mean field properties of the seismicity. to water-level changes. They appear as genuine fluctuations, typical of natural earthquakes. These results are different from another induced seismicity case study where pore pressure drop in a gas field has been observed as correlated with b- and D-value changes (Lahaie and Grasso, 1999). Interplay between Earthquakes Directly Driven by Water-Level Changes and Their Aftershocks We propose that the dynamics of earthquake interactions, as measured by numerous genuine aftershock sequences in the Aswan catalog (Fig. 14), reproduces most of the observed fluctuation of the Aswan seismicity catalog, as expected by a generic cascade model of earthquake inter-. actions (e.g., Kagan and Knopoff, 1981; Ogata, 1998; Helmstetter and Sornette, 2003a,b). Apart from the waterlevel loading, the main input of energy in the system was the M 5.4 earthquake of November 1981, which triggered a genuine aftershock sequence. This sequence developed at least up to 1990, as estimated by a p-value of the Omori law close to unity (Mahmoud et al., 1998). Following Kagan (2003) in using the strongest constrain for catalog completeness, that is, M ⱖ 2.8, the Omori law is still relevant to fit the Aswan seismicity during the 1982–2001 period with a p-value close to 0.95 Ⳳ 0.04 (Fig. 15). This relaxation pattern also describes the M ⱖ 2.8 deep and shallow seismicity rate with p-values of 1.20 Ⳳ 0.04 and 0.60 Ⳳ 0.04, respec-.
(11) 489. A Long-Lasting Relaxation of Seismicity at Aswan Reservoir, Egypt, 1982–2001. 150 1980. 1985. 1990. 1995. 20. 2000. 1.8. b-v alue. 1985. 1990. 1995. 1985. 1990. 1995. 2000. 20. 1.8. 1.8. 1.6. 1.6. 1.4. 40 Deep ear thquakes. 160. 150 1980. 0. 1985. 1990. 1995. 2000. 20. 0. 1.4. 1.2. Deep earthquakes Window = 150 1.0. 1.0 1980. 2000. 60. 170. Shallo w ear thquakes Wind ow = 150. 1.0 1980. Shallow ear thquakes. 160. 1.2. All events Window = 150. 1985. Time in years. 1990. 1995. Time in years. 2000. 1980. 1985. 1990. 1995. 2000. Time in years. Figure 13.. Temporal variation of b-value for all events and shallow and deep earthquakes. Comparison with average water level and earthquake activity. Window lengths are 150 events per window, with an overlap of 30 events. Arrows indicate events with M ⱖ4. In all panels, M ⱖ2.8.. 10 –1. Daily Seismcity Rate. b-v alue. 1.6. 1.2. 40. 150 1980. 0. 1.4. 170. Average water level window = 100. 180. No. of earthquakes. All events. 160. 60. Water le vel (m). 40. Average water level window = 100. 180. 80. 190. b-v alu e. 170. Water level (m ). 60. No. of earthquakes. Water level (m). Average water level window = 100. 180. 80. 190. No. of earthquakes. 80. 190. 10 –2. 10 –1. 10 0. 10 1. 10 2. Time after Mainshock (days). Figure 14. Superposed epoch analysis for aftershocks that occur after M ⱖ3 events. We choose events in the 1988–1995 period where the direct aftershock rate of M 5.4 is low. The aftershock pattern highlighs that aftershock activity exists for all event sizes. These aftershocks correspond to events that cluster within 2 yr in a 5-km radius. An event is a mainshock when no larger shock occurred in a 20-km radius during the previous 6 months.. tively (Fig. 15). This decreasing rate with an exponent value close to unity for the global Aswan seismicity is reminiscent of regular aftershock patterns as observed after a tectonic mainshock (see Utsu et al. [1995] for a review). Cascade models of seismicity predict a vanishing seismicity rate on finite time, if no external loading is added to the system (e.g., Kagan and Knopoff, 1981; Ogata, 1998; Helmstetter and Sornette, 2003a,b). We propose that the deep seismicity vanished as time increased since it was not sustained enough by the water-level change. The shallow seismicity, which is still active until 2001, appears to be sustained by a more efficient water loading at shallow depths than deeper. The p-value for shallow seismicity is an anomalously small value by tectonic standards (Utsu et al., 1995). We proposed that more earthquakes are reservoir triggered at shallow depths, as driven by water-level changes. These earthquakes in turn induce aftershocks that also contribute to increasing the shallow seismicity rate relative to the deep-event rate. For shallow earthquakes in the 1989–2001 period, we propose that the weak correlation with the seasonal water level (Fig. 10) emerges from a noise induced by the cascades of earthquake sequences (Fig. 14). These sequences have their own dynamics that is driven by the generic control parameter of seismicity, that is, primarily the exponent of the Gutenberg– Richter and the Omori law. Using the declustering techniques of Reasenberg (1985) on the M ⱖ 2.8 catalog, we estimate the rate of aftershocks to be 35% of the seismicity in the 1982–2001 period. Because the Aswan seismicity fol-.
(12) 490. M. Mekkawi, J.-R. Grasso, and P.-A. Schnegg. (a). (c). 80. 10. 0. Seismicity Rate (M>2.8). 70. Daily Seismicity Rate. 60 50 40 30. 10. –1. 10. –2. p = 0.59 +/ –0.05. 20 10 0 80. 85. 90. 95. 100. 105. 10. 1. Time. (b). 3. 10. 4. 3. 10. (d) 1. 0. 10. p = 0.94 +/ –0.03. –1. 10. –2. 10. 1. 10. 2. 10. 10. 1. 10. 0. 10. –1. 10. –2. 10. –3. Daily Seismicity Rate. 10. Daily Seismicity Rate. 2. 10 10 Time from 11/14/1981 Mainshock (days). 3. 10. 4. 10. Time from November, 14, 1981 Mainshock (days). 10. p = 1.18 +/ –0.04. 1. 10. 2. 10. 4. Time from 11/14/1981 Mainshock (days). Figure 15. Relaxation of seismicity rate over time. (a) Monthly seismicity decay rate over time for all events. Power-law relaxation of seismicity for (b) all events and (c) shallow and (d) deep seismicity. Origin of the time axis is the 14 November 1981, M 5.4 mainshock. Origin of the first event in the catalog is 1 January 1982, that is, 45 days after the mainshock, as plotted on (b–d) diagrams. On all diagrams, M ⱖ2.8 events. The p-values of the Omori law are maximum likelihood estimates.. lows the Omori law in the 1982–2001 period within the accuracy of the p-value exponent, close to 80% of the seismicity can as well be defined as aftershocks. It provides evidence for the aftershock rate for the Aswan seismicity to be in the range 35%–80%. Accordingly, we propose there are two types of earthquakes in Aswan seismicity. First, the water-level changes work as an external loading that directly triggers primary earthquakes. Second, each of these events triggers a secondary class of events that are aftershocks of these direct events or aftershocks of aftershocks. This secondary class of events is not directly related to the water-. level changes, thus inducing stochastic fluctuations in the seismicity pattern that inhibits the recovery of the expected simple and strong response of the seismicity pattern to waterlevel loading. During the 1982–2001 period and using M ⱖ 2.8 earthquakes, the 1982–2001 Aswan seismicity appears as a power-law relaxation response to the 1981 M 5.4 shock (Fig. 15), this response being decorated by long-term (larger than 100 days) water-level changes. The earthquake catalog completeness prevents us from further analyzing possible short-term effects, which require more data to be resolved. The next step of this work is to test the cascade model for.
(13) A Long-Lasting Relaxation of Seismicity at Aswan Reservoir, Egypt, 1982–2001. earthquakes on the Aswan catalog as a null hypothesis (e.g., Helmstetter et al., 2003) in order to quantitatively estimate the relative role of earthquake interaction and water-level change in the processes that drive the long-lasting seismic episode below the Aswan reservoir.. Conclusion The correlation between seismicity rate and water-level variations in Aswan Lake suggests that the earthquake activity in this area is influenced by the long-term, 6–12 month, harmonic change in reservoir levels. This external drive seems relatively stronger for the deep events (15–30 km) in the 1982–1988 period than for the shallow events. It that sense, Aswan seismicity appears as a genuine case of induced seismicity. The upward migration of seismicity all over the 1982– 2000 period, which is mainly controlled by the shift of shallow-event depths, illuminates the interplay between both normal earthquake interactions (e.g., aftershocks) and the influence of reservoir loading. We suggest there are two classes of earthquakes in Aswan seismicity. One class is directly driven by the water-level changes. The second class, a minimum of 35% of the seismicity, is triggered by the former as aftershocks. Within such a cascade model framework, the upward migration of seismicity rate reflects the water-level change to be more efficient in triggering shallow events than deep ones. It results in enhancing the shallow seismicity rate through time as preferentially sustained by the water-level change. Because of the stochastic fluctuations in seismicity rate induced by aftershock occurrences, the Aswan reservoir seismicity only correlates to the 6- to 12-month long-term harmonics of the water-level change on the 1982–2001 period. We do not extract any influence of water-level changes on the b-value patterns of Aswan seismicity. We suggest that the interplay between earthquake interactions and water-level loading leads to the observed complexity of Aswan seismicity patterns. On a global scale, the 1982–2001 Aswan seismicity appears as a standard decay law of aftershock activity, the major misfit with tectonic sequences being the small 0.6 p-value for the shallow seismicity.. Acknowledgments This research project received financial support from the Swiss National Science Foundation (2100-65188). We are grateful Dr. H. Awad for providing the earthquake catalog of the Lake Aswan area and for providing water-level data. We thank A. Helmstetter, A. Hubert-Ferrari, A. Husker, C. Sue, N. Deichmann, M. Werner, and S. Wiemer for fruitful discussions and comments. Reviews by Y. Y. Kagan and D. Simpson, and the associate editor C. Trifu greatly helped in strengthening and in clarifying a previous version of the manuscript.. References Aki, K. (1965). Maximum likelihood estimate of b-value in the formula log N ⳱ a ⳮ bm, and its confidence limits, Bull. Earthquake Res. Inst. 43, 237–239.. 491. Ambraseys, N. N., C. P. Melville, and R. D. Adam (1994). The Seismicity of Egypt, Arabia, and the Red Sea: A Historical Review, Cambridge U Press, New York. Amitrano, D. (2003). Brittle–ductile transition and associated seismicity: Experimental and numerical studies and relationship with the b value, J. Geophys. Res., 108, no. B1 2044, doi: 10.1029/2001JB0006B0. Amitrano, D., J. R. Grasso, and D. Hantz (1999). From diffuse to localized damage through elastic interaction, Geophys. Res. Lett. 26, 2109– 2112. Awad, H., and M. Mizoue (1995). Earthquake activity in the Aswan region, Egypt, Pageoph 145, 69–86. Bell, M. L., and A. Nur (1978). Strength changes due to reservoir-induced pore pressure and application to Lake Oroville, J. Geophys. Res. 83, 4469–4483. El-Sayed, A., F. Vaccari, and G. F. Panza (2001). Deterministic seismic hazard in Egypt, Geophys. J. Int. 144, 555–567. El-Shazly, E. M. (1977). The Geology of the Egyptian Region, in The Ocean Basin and margins, Vol. 4A, Plenum, New York, 397–444. Gerstenberger, M., S. Wiemer, and D. Giardini (2001). A systematic test of the null hypothesis that the b-value varies with depth in California, Geophys. Res. Lett. 28, no. 1, 57–61. Gibowicz, S. J., Z. Droste, R. Kebeasy, and I. M. Ibrahim (1982). A micro earthquake survey in Abu-Simbel area in Egypt, Eng. Geol. 19, 95– 109. Grassberger, P., and I. Procaccia (1983). Measuring the strangeness of strange attractors, Physica 9D, 189–208. Gupta, H. K. (1992). Reservoir Induced Seismicity, Elsevier, Amsterdam. Gupta, H. K., and B. K. Rastogi (1976). Dams and Earthquakes, Elsevier, Amsterdam. Gutenberg, B., and C. F. Richter (1956). Magnitude and energy of earthquakes, Ann. Geofis. 9, 1–15. Helmstetter, A., and D. Sornette (2003a). Subcritical and supercritical regimes in epidemic models of earthquakes aftershocks. J. Geophys. Res. 107, no. B10, 2237, doi 10.129/2001JB001580. Helmstetter, A., and D. Sornette (2003b). Importance of direct and indirect triggering seismicity in the ETAS model of seismicity, Geophys. Res. Lett. 30, no. 11, 1576, doi 10.1029/2003GLO17670. Helmstetter, A., D. Sornette, and J. R. Grasso (2003). Mainshocks are aftershocks of conditioned foreshocks, J. Geophys. Res. 108, no. B1, 2046, doi 10.1029/2002JB1991. Issawi, B. (1969). The Geology of Kurkur-Dungul area, General Egyptian Organization for Geological Research and Mining, Geological Survey 46, Cairo, Egypt. Issawi, B. (1978). Geology of Nubia west area, western desert. Annals of the Geological Survey of Egypt, 3B, 237–253. Issawi, B. (1982). Geology of the southwestern desert of Egypt. Annals of the Geological Survey of Egypt, 11, 57–66. Kagan, Y. Y. (2002). Seismic moment distribution revisited: I. Statistical results, Geophys. J. Int. 148, 520–541. Kagan, Y. Y. (2003). Accuracy of modern global earthquake catalogs, Phys. Earth Planet. Int. 135, 173–209. Kagan, Y. Y., and L. Knopoff (1981). Stochastic synthesis of earthquake catalogues, J. Geophys. Res. 86, 2853–2862. Kebeasy, R., and A. Gharib (1991). Active fault and water loading are important factors in triggering earthquake activity around Aswan Lake, J. Geodyn. 14, 73–83. Kebeasy, R. M., and A. A. Tealab (1997). Earthquake activity and subsurface structures of south valley project, internal report, National Research Institute of Astronomy and Geophysics, 14, 1–87. Kebeasy, R. M., M. Maamon, and E. M. Ibrahim (1982). Aswan Lake induced earthquake, Bull. Int. Inst. Seism. Earthquake Eng. 19, 155– 160. Lahaie, F., and J. R. Grasso (1999). Loading rate impact on fracturing pattern: lessons from hydrocarbon recovery, Lacq gas field, France, J. Geophys. Res. 104, 17,941–17,954. Lee, W. (1990). Hypo71 PC program, IASPEI Software Library, Vol.1..
(14) 492 Maamoun, M., A. Megahed, and A. Allam (1984). Seismicity in Egypt, Bull. National Research Institute of Astronomy and Geophysics, 4B. Mahmoud, S. M., S. N. Bhattacharya, S. Yunga, and H. N. Srivastava (1998). Seismicity pattern near Aswan reservoir, Egypt, National Research Institute of Astronomy and Geophysics, 12B, 173–185. Mekkawi, M., A. Hassoup, J.-R. Grasso, and P. Schnegg (2002). Fractal and spectral analysis of the earthquake sequences along Aswan Lake, SE085, EGS, Nice, April. Mori, J., and R. Abercrombie (1997). Depth dependence of the earthquake frequency–magnitude distribution in California: implications for rupture initiation, J. Geophys. Res. 102, 15,081–15,090. Ogata, Y. (1998). Statistical model for earthquake occurrence and residual analysis, J. Am. Stat. Assoc. 83, 9–27. Omori, F. (1894). Investigation of aftershocks, Rep. Earthquake Inv. Comm. 2, 103–139. Reasenberg, P. (1985). Second order moment of central California seismicity, 1969–1982, J. Geophys. Res. 90, 5479–5495. Roeloffs, E. A. (1988). Fault stability changes induced beneath a reservoir with cyclic variations in water level, J. Geophys. Res. 93, 2107–2124. Said, R. (1962). The Geology of Egypt, Elsevier, Amsterdam, 377 pp. Simpson, D. W. (1986). Triggered earthquakes, Ann. Rev. Earth Planet. Sci. 14, 21–42. Simpson, D. W., and S. K. Negmatullaev (1981). Induced seismicity at Nurek reservoir, Bull. Seism. Soc. Am. 71, 1561–1586. Simpson, D. W., W. Leith, and C. H. Scholtz (1988). Two types of reservoir-induced seismicity, Bull. Seism. Soc. Am. 75, 2025–2040.. M. Mekkawi, J.-R. Grasso, and P.-A. Schnegg Simpson, D. W., A. A. Gharib, and R. M. Kebeasy, (1990). Induced seismicity and changes in water level at Aswan reservoir, Egypt, Gerlans. Beitr. Geophysik Leipzig, 99, 191–204. Snow, D. T. (1972). Geodynamics of seismic reservoirs, in Proc. Percolation through Fissured Rocks, T2-J, Stuttgart, Ges. Erd. Grundbau, 1–19. Sue, C., J. R. Grasso, F. Lahaie, and D. Amitrano (2002). Mechanical behaviour of western Alpine structures inferred from statistical analysis of seismicity, Geophys. Res. Lett. 29, no. 8, doi: 10.1029/ 2001GL014050. Utsu, T., Y. Ogata, and S. Matsu’ura (1995). The centenary of the Omori formula for a decay law of aftershock activity, J. Phys. Earth 43, 1–33. Institute of Geology University of Neuchaˆ tel Switzerland (M.M., P.-A.S.). Institute of Geophysics and Planetary Physics University of California at Los Angeles Los Angeles, California (J.-R.G.) Manuscript received 10 April 2003..
(15)
Figure

+7


Documents relatifs