Brain imaging and human nutrition: which
measures to use in intervention studies?
Ste´phane V. Sizonenko
1, Claudio Babiloni
2,3, Eveline A. de Bruin
4, Elizabeth B. Isaacs
5,
Lena S. Jo¨nsson
6, David O. Kennedy
7, Marie E. Latulippe
6, M. Hasan Mohajeri
8,
Judith Moreines
9, Pietro Pietrini
10, Kristine B. Walhovd
11, Robert J. Winwood
12and John W. Sijben
131. Division of Development and Growth, Department of Child and Adolescent Medicine,
School of Medicine and University Hospital, Geneva, Switzerland
2. Department of Molecular Medicine, University of Rome ‘La Sapienza’, Rome, Italy
3. IRCCS San Raffaele Pisana, Rome, Italy
4. Unilever R&D Vlaardingen, Vlaardingen, The Netherlands
5. Childhood Nutrition Research Centre, UCL Institute of Child Health, London, UK
6. ILSI Europe a.i.s.b.l., Avenue E. Mounier 83, Box 6, B-1200 Brussels, Belgium
7. Brain, Performance and Nutrition Research Centre, Northumbria University, Newcastle, UK
8. DSM Nutritional Products, R&D Human Nutrition and Health, Basel, Switzerland
9. Pfizer Consumer Healthcare, 5 Giralda Farms, Madison, NJ, USA
10. Laboratory of Clinical Biochemistry and Molecular Biology, University of Pisa Medical School, Pisa, Italy
11. Psychology Department, Center for the Study of Human Cognition, University of Oslo, Oslo, Norway
12. DSM Nutritional Products (UK) Limited, Delves Road, Heanor, Derbyshire, UK
13. Nutricia Advanced Medical Nutrition, Danone Research Centre for Specialised Nutrition,
Wageningen, The Netherlands
Correspondence: ILSI Europe a.i.s.b.l. - Avenue E. Mounier 83, Box 6 - 1200 Brussels - Belgium
Email: [email protected] - Fax þ 32 2 762 00 44
Commissioned by the
Vol. 110
Supplement No. 1
August 2013
British Journal of Nutrition
Table of Contents
MRI: brain structural, metabolic and functional assessments for nutritional research S4 – S12
Electroencephalography and magnetoencephalography: measuring brain electrical and
magnetic activities S12 – S15
Near-IR spectroscopy: measuring cerebral blood flow and haemodynamic responses S15 – S17
Positron emission tomography imaging: anatomical, metabolic and functional assessments for
nutritional research S17 – S20
Single-photon emission computerised tomography imaging: anatomical, metabolic and functional
assessments for nutritional research S20 – S21
General considerations S21 – S22
Conclusion S22 – S23
Acknowledgements S23
Key words:Nutrition: MRI: Electroencephalography: Near-IR spectroscopy: Positron emission
tomogra-phy
Corresponding author:ILSI Europe a.i.s.b.l. - Avenue E. Mounier 83, Box 6 - 1200 Brussels - Belgium
fax: þ 32 2 762 00 44, email: [email protected]
Abbreviations:AD, Alzheimer’s disease; ADHD, attention-deficit hyperactivity disorder; BOLD, blood
oxygen level dependent; CBF, cerebral blood flow; CNS, central nervous system; deoxy-Hb, deoxyge-nated Hb; DTI, diffusion tensor imaging; EEG, electroencephalography; EP, evoked potential; ERP, event-related potential; FA, fractional anisotropy; FDG, [18F]fluoro-2-deoxy-D-glucose; fMRI, functional MRI;1H-MRS, proton spectroscopy; ILSI, International Life Sciences Institute; IQ, intelligence quotient; IUGR, intrauterine growth retardation; LC-PUFA, long-chain PUFA; MEG, magnetoencephalography; MR, magnetic resonance; MRS, magnetic resonance spectroscopy; NAA, N-acetylaspartate; NIRS,
near-IR spectroscopy; oxy-Hb, oxygenated Hb; 31P-MRS, phosphorus spectroscopy; PET, positron
emission tomography; rCBF, regional cerebral blood flow; SPECT, single-photon emission
computerised tomography; VBM, voxel-based morphometry.
This paper was published as a supplement to British Journal of Nutrition, publication of which was sup-ported by ILSI Europe. The paper has undergone the standard journal formal review process and may be cited.
qILSI Europe [2013]. The online version of this paper is published within an Open Access environment
subject to the conditions of the Creative Attribution-NonCommercial-ShareAlike licence ,http://creative commons.org/licenses/by-nc-sa/3.0/.. The written permission of Cambridge University Press must be obtained for commercial re-use.
The present review describes brain imaging technologies that can be used to assess the effects of nutritional interventions in human sub-jects. Specifically, we summarise the biological relevance of their outcome measures, practical use and feasibility, and recommended use in short- and long-term nutritional studies. The brain imaging technologies described consist of MRI, including diffusion tensor imaging, mag-netic resonance spectroscopy and functional MRI, as well as electroencephalography/magnetoencephalography, near-IR spectroscopy, positron emission tomography and single-photon emission computerised tomography. In nutritional interventions and across the lifespan, brain imaging can detect macro- and microstructural, functional, electrophysiological and metabolic changes linked to broader functional outcomes, such as cognition. Imaging markers can be considered as specific for one or several brain processes and as surrogate instrumental endpoints that may provide sensitive measures of short- and long-term effects. For the majority of imaging measures, little information is available regarding their correlation with functional endpoints in healthy subjects; therefore, imaging markers generally cannot replace clinical endpoints that reflect the overall capacity of the brain to behaviourally respond to specific situations and stimuli. The principal added value of brain imaging measures for human nutritional intervention studies is their ability to provide unique in vivo infor-mation on the working mechanism of an intervention in hypothesis-driven research. Selection of brain imaging techniques and target markers within a given technique should mainly depend on the hypothesis regarding the mechanism of action of the intervention, level (structural, metabolic or functional) and anticipated timescale of the intervention’s effects, target population, availability and costs of the techniques.
The brain is the most complex organ in the human body. It contains approximately 100 billion neurons, with each being connected by synapses to several thousands of other neurons. The brain controls physiological functions including, but not limited to, the sleep/wake cycle, arousal/attention, perception, mood, motivation, emotion, appetite/satiety, reward, learning/memory, speech, planning/executive pro-cesses and voluntary movements. The brain is a metabolically highly active organ that utilises a relatively large proportion of total nutrient and energy intake throughout the lifespan. Furthermore, the development and repair of neural tissue depends on the proper intake of essential nutrients, minerals and vitamins. Therefore, what we eat, or refrain from eating, may have an important impact on our cognitive ability and mental performance. There are two key areas in which diet plays an important role: supporting motor and cognitive neurodevelopment in children and preventing neurodegen-eration and cognitive decline during ageing.
Neuronal and behavioural responses to nutrients are com-plex and their relationships to each other are often unclear. Nevertheless, there are several well-described routes by which diet may affect neurochemistry and brain function. Food and nutrient intake can modulate the availability of precursors or act as enzyme cofactors required for the syn-thesis and function of neurotransmitters, neurotrophic factors and psychoactive hormones. Dietary precursors participate in the formation and composition of neural membranes and synapses. Nutrients also affect cerebral blood flow (CBF), with a direct influence on energy and nutrient availability in
the brain(1). Some of the nutritional effects on brain function
(e.g. changes related to cell signalling and energy supply) may be short lasting. For example, acute tryptophan depletion in women vulnerable to depressive symptoms has been shown to provoke a short-term relapse of clinically significant
depressive symptoms(2). On the other hand, supplementation
of nutrients might have long-term effects on brain structure and function. For example, nutrient enrichment in preterm infants can affect neurodevelopmental outcomes and brain structure years, and even decades, after a short-term
inter-vention(3). During the last few decades, the body of evidence
from both observational and intervention human studies
investigating the modulation of brain function by nutrients has grown dramatically. We now have a solid basis for translation into hypothesis-driven intervention studies and, ultimately, into evidence-based practices.
The magnitude of the economic and societal burden related to brain dysfunction is becoming increasingly evident. A recent study by the European College of Neuropsychopharmacology has indicated that 38·2 % of the European Union population,
or 168 million people, suffer from a mental disorder(4). This
was estimated to cost e798 billion in 2010(5). The potential
of nutrition to reduce the burden of impaired brain function has been illustrated by many studies reporting links between either poor nutrient intake or nutrient enrichment and brain function across the lifespan, from (pre)term infants to the elderly, and in various neurodevelopmental, neurological
and psychiatric conditions(1,6 – 10).
Despite great progress in the fields of neuroscience, neuropsychology and nutritional science in terms of under-standing the relationships between brain function and nutrition, research assessing these long-term relationships, as well as human data regarding mechanisms of action, is hindered by practical feasibility or methodological constraints. In 2009, the Nutrition and Mental Performance Task Force of the European Branch of the International Life Sciences Institute (ILSI Europe) convened a workshop to evaluate the methodological challenges and opportunities related to
study-ing the long-term effects of nutrition(11). One recommendation
from the workshop was to include brain imaging biomarkers as secondary endpoints in future intervention studies to produce study outcomes that supplement clinical or cognitive measures. Brain imaging biomarkers might improve our understanding of mechanisms of action and may potentially provide more sensitive measures that predict long-term effects
earlier, thereby shortening the required trial duration(12).
The aim of the present review was to provide a com-prehensive overview of brain imaging techniques and the existing knowledge regarding the quality of imaging markers commonly used to assess brain structure and functions in human subjects. Specifically, we describe MRI and its multi-modal assessment capacity, electroencephalography (EEG)/ magnetoencephalography (MEG), near-IR spectroscopy (NIRS),
British
Journal
of
positron emission tomography (PET) and single-photon emission computerised tomography (SPECT) from the per-spective of how they could have a place in nutritional intervention studies (Table 1). We have included a description of the aforementioned brain imaging techniques, the bio-logical relevance of their measures, their practical feasibility, their sensitivity to age and in specific populations, and their recommended use in nutritional intervention studies. Such descriptions are expected to contribute to the identification of an appropriate set of relevant imaging measures with two main features. On the one hand, these techniques may allow the measurement of neurostructural, neurophysiological and neurochemical changes occurring over the lifespan and after nutritional interventions. On the other hand, they may elucidate the specific biological processes implicated in the changes in brain function during development and ageing and the means by which a nutritional intervention can modu-late these changes. Of particular note, we have focused on the general population, especially those age groups that may be particularly sensitive to factors influential in periods of rapid brain development or to deteriorating brain function (e.g. infants and elderly).
MRI: brain structural, metabolic and functional assessments for nutritional research
MRI techniques as a multimodal approach
The advent of non-invasive MRI was a breakthrough to assess the human brain in vivo, greatly expanding the possibilities of investigating brain structure and function. It was originally developed as a medical imaging tool to provide detailed scans of the structures of internal organs, using magnetic fields and radiofrequency pulses. The MRI scanner uses a very powerful magnetic field to align atoms in the body. Radiofrequency pulses are then applied to disturb this align-ment; as the nuclei return to alignment, they rotate and pro-duce an electrical field that the scanner detects and uses to produce images. In the case of the brain, MRI scans provide detailed pictures of grey and white matter, vessels, cerebrosp-inal fluid and bone. Clinically, neuroradiologists usually inter-pret scans by visual inspection; however, in order to reveal more subtle features, other techniques that depend on post-acquisition processing of the scans have been developed. The combination of MRI as a multimodal tool with
post-acquisition processing techniques provides a powerful
technology for the study of the effects of nutrition on brain development and ageing. Within the broad divisions of macro- and microstructural, metabolic and functional imaging, a variety of techniques have emerged from magnetic reson-ance (MR), leading to a multimodal assessment of the brain.
For the examination of overall brain structure, a three-dimensional anatomical dataset of T1- and T2-weighted images, basic scans that provide a good contrast between grey matter and white matter, is collected, allowing recon-struction of the brain in three planes. Diffusion-weighted imaging and diffusion tensor imaging (DTI) datasets provide measures of water diffusion properties within the tissue and
determine the microstructural characteristics of white and grey matter. In addition, magnetic resonance spectroscopy
(MRS) based on proton (1H-MRS) and31P (31P-MRS) magnetic
properties measures the levels of different metabolites in body tissues, and functional MRI (fMRI) can be used to reveal brain structures and processes associated with perception, thought and action in response to sensory stimuli. The neural activity of the brain is closely linked to changes in blood flow and blood oxygenation in the brain (known as haemodynamics). Additional details on these measurements are given in Table 1. Costs of MRI may vary regionally but are relatively high, not only due to the scanning time (depending on the number of MR sequences needed) and the cost of the equipment, but also in terms of image post-processing and analysis.
MRI acquisition, post-processing and MRI-derived measures
In human subjects, MRI scans are most commonly obtained using a scanner with a magnetic field strength of 1·5 or 3 T. All studies begin with the acquisition of scans using an imaging protocol designed to provide the information best suited to the chosen method of analysis. In order to compare different groups of a clinical/research study, the image signal and its properties need further post-processing operations to gather useful, reliable and comparable data. Different types of data are provided by the different methods. Some of the most widely used protocols and their respective post-processing considerations are described in the following sections.
Structural MRI. Morphometry and volumetrics refer to the
measurement of physical form characteristics such as volumes of brain structures or thickness of cortices. Originally, these could only be measured manually by drawing about the perimeter of a structure on a series of T1 – T2 conventional scans and then calculating the volume. Because it was time consuming and prone to error in some instances, its use was also restricted to structures that were clearly delineated (e.g. the hippocampus) rather than to those with less clear bound-aries (e.g. some frontal lobe areas). Semi-automated and fully automated methods that label the neuroanatomical structures on the basis of probability information obtained from a train-ing set of images that have been manually labelled have now
become available(13). The volumes of these structures (Fig. 2)
are calculated and can then be used in statistical analyses. Cor-tical thickness can be estimated by means of an automated
surface reconstruction scheme(14 – 20), and scans from different
time points or individuals can be compared at each vertex across the entire cortical mantle and may be related to other variables of interest. These techniques have been validated
via histological(21)and manual measurements(22). The cortical
surface can also be parcellated into a number of different regions of interest, for which information on surface area,
thickness and volume can be estimated(23).
Voxel-based morphometry (VBM)(24)was designed to
inves-tigate local differences in the distribution of grey and white matter in the brain. The scans are segmented into separate grey and white matter images and entered into the VBM anal-ysis; for analytical purposes, the brain is divided into small
British
Journal
of
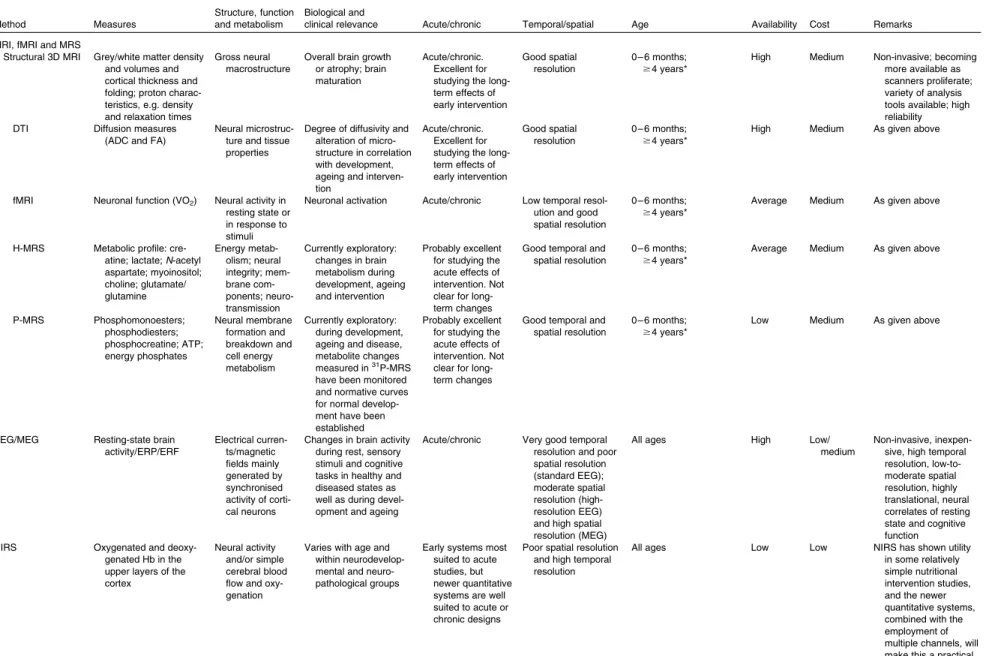
Table 1. Summary of the key features of imaging measurements
Method Measures
Structure, function and metabolism
Biological and
clinical relevance Acute/chronic Temporal/spatial Age Availability Cost Remarks
MRI, fMRI and MRS
Structural 3D MRI Grey/white matter density
and volumes and cortical thickness and folding; proton charac-teristics, e.g. density and relaxation times
Gross neural macrostructure
Overall brain growth or atrophy; brain maturation
Acute/chronic. Excellent for studying the long-term effects of early intervention Good spatial resolution 0 – 6 months; $4 years*
High Medium Non-invasive; becoming
more available as scanners proliferate; variety of analysis tools available; high reliability
DTI Diffusion measures
(ADC and FA)
Neural microstruc-ture and tissue properties
Degree of diffusivity and alteration of micro-structure in correlation with development, ageing and interven-tion
Acute/chronic. Excellent for studying the long-term effects of early intervention Good spatial resolution 0 – 6 months; $4 years*
High Medium As given above
fMRI Neuronal function (VO2) Neural activity in
resting state or in response to stimuli
Neuronal activation Acute/chronic Low temporal
resol-ution and good spatial resolution
0 – 6 months; $4 years*
Average Medium As given above
H-MRS Metabolic profile:
cre-atine; lactate; N-acetyl aspartate; myoinositol; choline; glutamate/ glutamine Energy metab-olism; neural integrity; mem-brane com-ponents; neuro-transmission Currently exploratory: changes in brain metabolism during development, ageing and intervention Probably excellent for studying the acute effects of intervention. Not clear for long-term changes
Good temporal and spatial resolution
0 – 6 months; $4 years*
Average Medium As given above
P-MRS Phosphomonoesters; phosphodiesters; phosphocreatine; ATP; energy phosphates Neural membrane formation and breakdown and cell energy metabolism Currently exploratory: during development, ageing and disease, metabolite changes
measured in31P-MRS
have been monitored and normative curves for normal develop-ment have been established
Probably excellent for studying the acute effects of intervention. Not clear for long-term changes
Good temporal and spatial resolution
0 – 6 months; $4 years*
Low Medium As given above
EEG/MEG Resting-state brain
activity/ERP/ERF Electrical curren-ts/magnetic fields mainly generated by synchronised activity of corti-cal neurons
Changes in brain activity during rest, sensory stimuli and cognitive tasks in healthy and diseased states as well as during devel-opment and ageing
Acute/chronic Very good temporal
resolution and poor spatial resolution (standard EEG); moderate spatial resolution (high-resolution EEG) and high spatial resolution (MEG)
All ages High Low/
medium
Non-invasive, inexpen-sive, high temporal resolution, low-to-moderate spatial resolution, highly translational, neural correlates of resting state and cognitive function
NIRS Oxygenated and
deoxy-genated Hb in the upper layers of the cortex
Neural activity and/or simple cerebral blood flow and oxy-genation
Varies with age and within neurodevelop-mental and neuro-pathological groups
Early systems most suited to acute studies, but newer quantitative systems are well suited to acute or chronic designs
Poor spatial resolution and high temporal resolution
All ages Low Low NIRS has shown utility
in some relatively simple nutritional intervention studies, and the newer quantitative systems, combined with the employment of multiple channels, will make this a practical, low-cost technique in future studies Brain imaging and human nutrition S5
British Journal of Nutrition
.
https://doi.org/10.1017/S0007114513001384
https:/www.cambridge.org/core
. University of Basel Library
, on
30 May 2017 at 22:18:55
cubic elements called voxels. Most commonly, groups of scans are compared on a voxel-by-voxel basis to determine where significant differences in the concentration, volume and/or density of grey or white matter occur between groups. Voxel-by-voxel correlations with other variables (e.g. beha-vioural) can also be determined. These analyses produce statistical parameter maps showing where differences between groups (if any) and significant relationships with other variables occur.
Sulcation and gyrification index analysis can be used to assess cortical folding in vivo and to define a sulcation index during development or disease. The analysis uses the white matter and cortical grey matter contrast intensity
inter-face(25). A dramatic increase in the sulcation index,
corre-sponding to brain maturation from an unfolded state to its gyrificated mature state near term, has been demonstrated
between 26 and 36 weeks of gestation(25).
Diffusion-weighted imaging/DTI captures microstructural characteristics not apparent in standard anatomical images by utilising the restricted water diffusion in biological brain tis-sues. Depending on microscopic tissue characteristics (e.g. properties of cell membranes, tissue orientation and myelina-tion), water diffusion will differ by degree and direction. In DTI, a first pulse introduced to the magnetic field determines the initial position of the protons carried by water, while a second pulse detects how far they have moved in space and
in which specific direction(26). In this way, we obtain a
metric of water diffusion, sensitive to structural characteristics. The number of directions of diffusion measured varies from a minimum of 6 to . 100.
Several DTI metrics can be applied. Fractional anisotropy (FA) is an intra-voxel index of the degree of diffusion anisotropy (i.e. directionality of diffusion). Several features
contribute to FA, including myelin and axonal integrity(27,28),
and also complex structural features such as the degree
of fibre crossing(29). The constituents of FA are diffusion
measured parallel/axial to, and perpendicular/radial to, the principal diffusion direction. In white matter, axial diffusion usually means diffusion along the length of the axon. Any neurobiological inference based on DTI measures must be made with caution, since multiple features influence the
metrics(30). However, some hypotheses may be made,
depending on the group studied. For instance, to the extent that a nutrient facilitates myelin or axon membrane integrity, one might expect higher FA and lower diffusion measured perpendicular/radial in selected regions in a nutrient-facilitated group. Another commonly used metric is the mean diffusivity, reflecting the degree of diffusivity in any direction. This is an illustration of the tissue microstructure and water content.
There are various ways of evaluating metrics and analysing DTI data. One can delineate tracts of interest or define regions of interest manually, or use automated tools, to conduct voxel-wise statistical analyses of FA, diffusion measured perpendicular/radial, diffusion measured parallel/axial or mean diffusivity data. This can, for example, be done within a white matter skeleton containing only voxels common to
Table 1 . Continued Method Measures Structure, function and metabolism Biol ogical and clin ical re levance Acute/chron ic Temporal/spa tial Age Availability Cost Remarks FDG-PET [ 18 F]Altanserin , a s a specific 5-HT 2A receptor antagonist to assess b rain s e rotonin 2A (5-H T2A ) receptor activity. 11[ C]Way100635 to assess the b ind ing potential o f 5 -H T2A . Measures of rCBF used as a marker of neuronal activity with [ 15 O]H 2 O Glucose metab-olism, s ynapse function, blood flow and neuro-transmission Dysfun ction e a rly marker of AD, link e d w it h cognitive function; neurotransmis s ion in physiological con-ditions or neurological or psychiatric dis-orders Acute/chron ic Requires combination with a s tructural imaging techni que for spatial resol-ution; good tem-poral resolutio n Due to high levels o f radi oactivity, vuln e r-abl e pop ulations s uch as children shoul d not be used in interven-tion s tudies Low H igh Invasive, q uite expens-iv e, hi gh c hemical res-o lution, low temp oral a n d lo w -to-moderat e sp atial resolution, and h ighly translational SPECT [ 99m Tc]HMPA O, [ 99m Tc]ECD and [ 123 I]IMP used to measure rCBF Metabolism and blood flow Cere b ral b lood flow a n d neurotransmis s ion Acute/chron ic Requires combination with a s tructural imaging techni que for spatial resol-ution; good tem-poral resolutio n Due to high levels o f radi oactivity, vuln e r-abl e pop ulations s uch as children shoul d not be used in interven-tion s tudies Low Medium As given above fMRI, functional MRI; MRS, magne tic resonance spectroscopy ; 3D, three d ime nsional; DTI, d iffusion tensor imaging; AD C, apparent diffusion coeffic ie nt; FA, fractional anisotropy; H-MRS, proton s p e ctroscopy; P-MRS, phosphorus spectroscopy ; EEG/ME G, ele c troencephalogr aphy/magn etoencephalograp hy; ERP, event-rela ted potential; ERF, event-related magnetic field; NIR S, near-IR spectroscopy ; FDG, [ 18 F]fluoro-2-de oxy-D -g lucose; PET, po sitron emission tomog raphy; 5-HT 2A , 5 -hydroxytry ptami ne receptor 2A; rCBF, regional cerebral blood flow; SPECT, single-photon emission computerised tomography; HM PAO, [ 99m Tc]hexamet hylpropyleneamin e ; ECD, [ 99m Tc]ethyl cysteinate d imer; IMP, [ 123 I]isopropyl iodoamphetamin e . * Lowest possible age depends on the paradigm. In prin ciple, MRI can be used with all age groups, but it may be practically difficult. The subject may n eed training.
British
Journal
of
Nutrition
groups of participants by using tract-based spatial statistics(31),
part of the FMRIB Software Library(32)(see Fig. 3 for an example).
MRS proton spectroscopy and phosphorus spectroscopy. The MRS signal produces a spectrum of resonances that
corre-spond to different molecular arrangements of the1H-proton
and31P being excited.1H-MRS and31P-MRS measure different
metabolites that are respectively linked to specific brain
com-position and metabolism (Table 1). Because 31P is in lower
concentrations in the body than1H, it has a lower signal:noise
ratio and therefore a higher magnetic field is required to achieve a better spectral resolution (Fig. 1; Tables 2 and 3). Furthermore, these techniques do require specific hardware. It must be noted that with an increasing magnetic field, spectral resolution is increased, allowing more precise measurements of the targeted metabolites. Both can be used to follow normal metabolic development and to detect
disorder-linked metabolic change. 1H-MRS allows neural
measurements of absolute metabolite concentrations during development, such as choline, creatine, glutamine/glutamate, lactate, myoinositol, macromolecular contributions,
N-acetyl-aspartate (NAA) and taurine(33 – 35). As gestational age
incre-ases, significant increases in NAA, glutamate and glutamine, creatine, taurine levels, with decreases in lactate, myoinositol
and phosphoethanolamine levels, have been shown(33,34,36).
Regional differences are also present: subcortical areas such as the thalamus showed early high levels of total creatine and NAA, but, by contrast, periventricular white matter
showed very little NAA and lactate resonance(33,34,36). In the
adult and ageing normal brain, MRS has also been able to characterise MRS-measured metabolite changes with age and region. Mainly, NAA, NAA:choline and NAA:creatine ratios
are decreased in the hippocampus as well as in the semioval,
temporal and frontal regions in ageing brains(37,38).
Further-more, altered neuronal and glial mitochondrial functions are also present in ageing brains and could be in part linked to
brain function decline(39,40). Glutamate, an important
neuro-transmitter, is reduced in the grey matter of the ageing
brain(41,42). White matter tracts also show altered NAA:choline
and NAA:creatine ratios for the corpus callosum and sple-nium(43,44). These changes in grey and white matter metab-olism appear to be linked to the reduction of cognition seen
in normal ageing(44 – 46).
31
P-MRS specifically evaluates energy and phospholipid metabolism by using phosphocreatine, ATP, inorganic phos-phate, phosphocholine and phosphoethanolamine
measure-ments(35). In addition, the chemical shift of inorganic
phosphate is dependent on intracellular pH, allowing tissue pH calculation. During development, ageing and
dis-ease metabolite changes measured in 31P-MRS have been
monitored and normative curves for normal development
have been established(35,47 – 51).
Functional MRI. Active neurons consume energy for the
duration of ongoing processing, resulting in a higher oxygen need and a higher blood flow. This haemodynamic response rises to a peak over 4 – 5 s, after which it normalises, leading to local changes in the relative concentration of oxygenated Hb (oxy-Hb) and deoxygenated Hb (deoxy-Hb) and changes in local cerebral blood volume in addition to this change in
local CBF(52 – 54). fMRI measures these changes in blood
oxygen concentration by recording changes in blood oxygen level-dependent (BOLD) signal. Oxy-Hb is a diamagnetic mol-ecule and becomes paramagnetic when deoxygenated. The
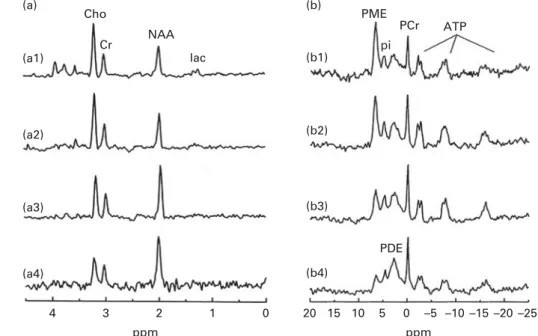
(a1) (a2) (a3) (a4) 4 3 2 1 0 20 15 10 5 0 –5 –10 –15 –20 –25 ppm ppm (b1) (b2) (b3) (b4) PDE Cho (a) (b) Cr NAA PME PCr ATP lac pi
Fig. 1.1H-MRS and31P-MRS at 1·5 T. (a) Normal typical spectrum of proton spectroscopy of grey matter and changes during brain development. (a1) Normal preterm infant born at 29 weeks of gestation (scan at 35 weeks), (a2) normal-term newborn, (a3) normal infant of 6 months and (a4) normal adult. (b) Normal typi-cal spectrum of31P spectroscopy of grey matter and changes during brain development. (b1) Normal preterm infant born at 29 weeks of gestation (scan at 35 weeks), (b2) normal-term newborn, (b3) normal infant of 6 months and (b4) normal adult. Cho, choline; Cr, creatine; NAA, N-acetylaspartate; Lac, lactate; PME, phosphomonoesters; Pi, inorganic phosphates; PCr, phosphocreatine; PDE, phosphodiesters; NTP, nucleotide triphosphate. Reproduced from Robertson & Cox(254).
British
Journal
of
MR signal of blood is therefore slightly different depending on the level of oxygenation in the local capillaries. These differ-ential signals can be detected using an appropriate MR pulse sequence (i.e. the BOLD signal mentioned previously). Higher BOLD signal intensities arise from decreases in the concentration of deoxy-Hb. These changes can be either posi-tive or negaposi-tive depending on the relaposi-tive changes in both
CBF and VO2. Increases in CBF that exceed changes in VO2
will lead to an increased BOLD signal. In contrast, decreases
in CBF that outstrip changes in VO2 will cause decreased
BOLD signal intensity(55).
Eligibility for an MRI examination
MRI is a non-invasive technique involving the use of magnetic fields and radiofrequency pulses and, hence, no ionising radiation. No clinical side effects have been noted after more than two decades of relatively broad use. As well as making its use in research viable, this also means that scan-ning can be repeated several times with the same persons, which is important in studying the effects of nutrition on
development, ageing or the prevention of disease-related changes.
Although it can be widely used in the population, there are some contraindications to scanning. People with ferro-magnetic implants are often unsuitable for scanning as the images would be distorted, and pacemakers will be disturbed by the magnetic field, making scanning not an option for some groups. Dental braces in children may also result in distorted images. Furthermore, persons with claustrophobia or fear of narrow spaces often do not tolerate the typically rather narrow space in the scanner. The ability of a person to avoid moving in the scanner is critical for any type of MR image to be obtained.
An important consideration when using imaging in infants and children is the age at scan acquisition. Until a few months after birth, MRI scanning is fairly accessible and can be performed under natural sleep after feeding. In naturally sleeping infants, fMRI can be performed and resting-state activity, as well as response to light, auditive and smell stimu-lation, can be measured. For older children, the sequences used in structural imaging and DTI can be made quite short, often less than 10 min. However, this may still be a long
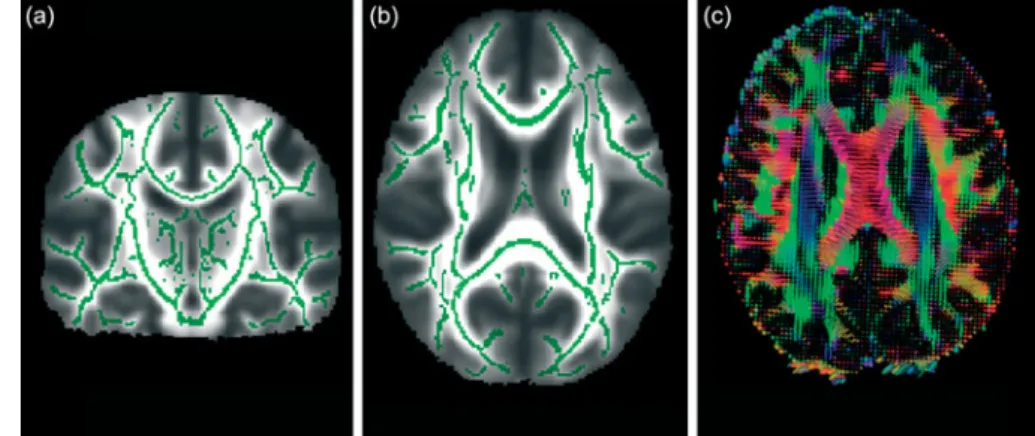
Fig. 2. Whole-brain segmentation of a T1-weighted scan as implemented in FreeSurfer (a brain imaging software package)(24). The segmentation is shown in (a) coronal, (b) horizontal and (c) sagittal views. Each image element (voxel) of the brain volume is labelled as belonging to different structures. For instance, the hip-pocampus is labelled in yellow.
Fig. 3. From diffusion tensor imaging, measures of fractional anisotropy (FA) can be derived. Areas of higher diffusion directionality, or FA, are shown in a lighter colour (a) coronally and (b) horizontally. The white matter skeleton created by tract-based spatial statistics as implemented in FSL(41)contains only tract voxels common to all participants in a study and is shown here in green imposed on the FA volume. To the right (c), the direction of diffusion in different parts of the brain is shown colour coded. Red colour denotes diffusion along the medial – lateral axis (such as in the corpus callosum connecting the hemispheres). Green colour denotes diffusion along the posterior – anterior axis, while blue colour denotes diffusion along the inferior – superior axis.
British
Journal
of
time for young children to keep still and the option of seda-tion is only warranted in the case of clinical scans. The success rate may increase in school-aged children. Some centres use pre-scan training in a mocked-up scanner to reduce the age limit of viability. To enhance cooperation, audio books/ music can be played at the time of scan, and if the equipment allows, cartoons may be projected or viewed in special gog-gles. For fMRI studies, stimuli – response paradigms have to be adapted to the age of the children and their ability to understand the task. Using MRI in the early years of childhood is difficult but important due to the fact that great brain development is ongoing during childhood and MRI could thus provide crucial information on the effects of nutrition during brain development. The plasticity of the brain during this period indicates that it may be a likely time for nutrition to influence structural changes. Studies that have followed up subjects after early dietary intervention, however, have
shown that the effects tend to persist over time(3,56); thus,
brain scans obtained later in childhood may still be informative.
From a broader point of view, due to reasons des-cribed above, neuroimaging studies should include uniform samples with regard to the age or, if subjects who vary widely in age are included, age at the scan should be used as a covariate in analyses. This is particularly true
in childhood, in which the development occurs over a rela-tively short time span.
Use of MRI in nutritional studies
Past nutritional studies that have used MRI techniques. If we
discount studies in clinical populations, the number of nutri-tional intervention studies using imaging measures is minimal. This is not surprising since it has been unusual in the past for research centres to collect both the nutritional and MRI data necessary to conduct these studies, but a few reports have started to appear. Nutritional studies tend to concentrate on the two extremes of the age spectrum, infancy and old age, periods in life with relatively large changes in brain mor-phology and functionality. There is, however, a difference in emphasis between the two. While studies in children have investigated whether different nutrition regimens can enhance brain development, studies in adults have tended to focus on whether diet and nutrients may act to protect the brain from age-associated atrophy or disease. It is important to keep in mind that structural changes may not correspond directly to changes in function and that such structural changes may bias the results. Grey matter atrophy and sulcal expansion in older adults may be responsible for a great anatomical varia-bility between the brains of younger and older adults and
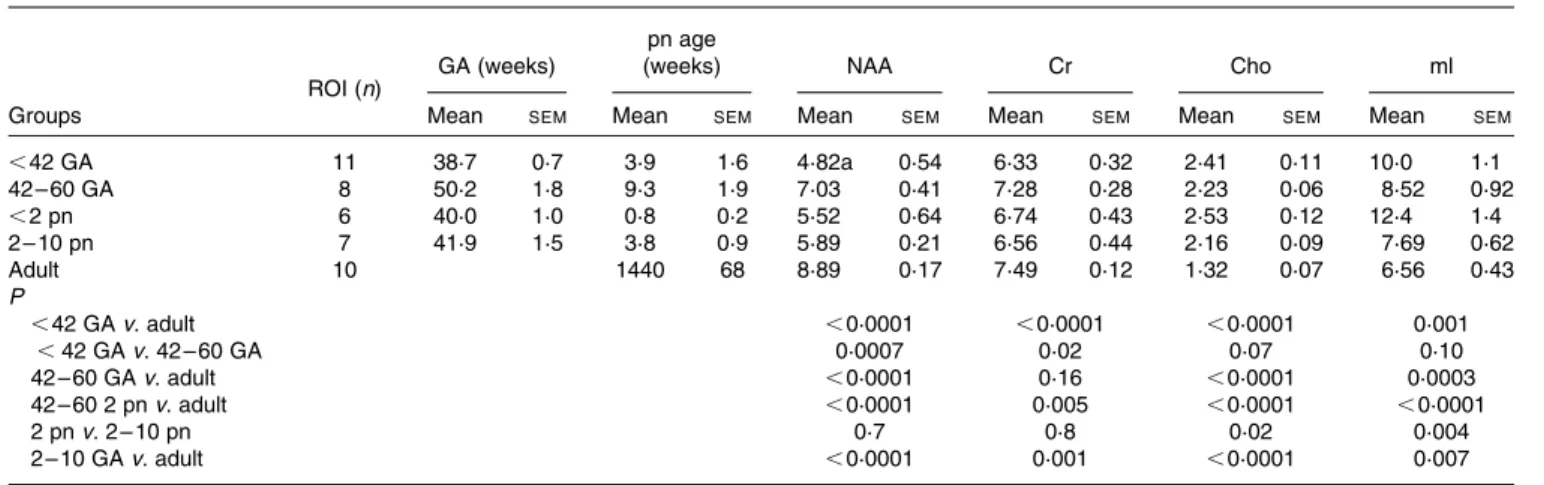
Table 2. Absolute concentrations of brain metabolites in individuals of different age groups in mmol/kg brain tissue and significance tests for differences found*
(Mean values with their standard errors)
ROI (n) GA (weeks)
pn age
(weeks) NAA Cr Cho ml
Groups Mean SEM Mean SEM Mean SEM Mean SEM Mean SEM Mean SEM
,42 GA 11 38·7 0·7 3·9 1·6 4·82a 0·54 6·33 0·32 2·41 0·11 10·0 1·1 42 – 60 GA 8 50·2 1·8 9·3 1·9 7·03 0·41 7·28 0·28 2·23 0·06 8·52 0·92 ,2 pn 6 40·0 1·0 0·8 0·2 5·52 0·64 6·74 0·43 2·53 0·12 12·4 1·4 2 – 10 pn 7 41·9 1·5 3·8 0·9 5·89 0·21 6·56 0·44 2·16 0·09 7·69 0·62 Adult 10 1440 68 8·89 0·17 7·49 0·12 1·32 0·07 6·56 0·43 P ,42 GA v. adult ,0·0001 ,0·0001 ,0·0001 0·001 ,42 GA v. 42 – 60 GA 0·0007 0·02 0·07 0·10 42 – 60 GA v. adult ,0·0001 0·16 ,0·0001 0·0003 42 – 60 2 pn v. adult ,0·0001 0·005 ,0·0001 ,0·0001 2 pn v. 2 – 10 pn 0·7 0·8 0·02 0·004 2 – 10 GA v. adult ,0·0001 0·001 ,0·0001 0·007
ROI, region of interest; GA, gestational age; pn, postnatal age; NAA, N-acetylaspartate; Cr, creatine; Cho, choline. * Reproduced from Ross & Bluml(35).
Table 3. Concentrations of31P metabolites in healthy brains of human neonates, infants and adults†
(Mean values and standard deviations)
Concentration (mmol/l ¼ mmol/dm3)
PME Pi PDE PCr ATP 31P total
n Mean SD Mean SD Mean SD Mean SD Mean SD Mean SD
Neonates 16 4·5** 0·7 0·6*** 0·1 3·2*** 0·8 1·4*** 0·2 1·6*** 0·2 14·9*** 2·3
Infants 17 3·6 0·9 0·6 0·1 4·2 0·7 1·7 0·3 1·8 0·3 16·1 2·5
Adults 28 3·5** 0·6 1·0*** 0·2 11·7*** 2·2 3·4*** 0·5 2·9*** 0·4 29·3*** 3·1
PME, phosphomonoesters; Pi, inorganic phosphates; PDE, phosphodiesters; PCr, phosphocreatine. Mean values are significantly different: ** P, 0·01, *** P, 0·001.
† Reproduced from Buchli et al.(255).
British
Journal
of
within a single random sample of older individuals(57,58). Therefore, it is important to define structure – function relation-ships. Some examples of studies are presented below.
MRI studies of altered nutrition during fetal life: effects on
the brain during intrauterine growth retardation.
Three-dimensional MRI has been used to evaluate the effects of intrauterine growth retardation (IUGR) on brain development. IUGR can be considered as inadequate nutritional supply during pregnancy. Preterm IUGR infants show altered brain
development with reduced cortical grey volumes(59),
hippo-campal volumes(60) and sulcation index(61) compared with
normally grown preterm infants. These changes are correlated with altered neurodevelopmental scores. Thus, early cortical development seems to be modified by altered intrauterine
nutritional environment(61).
DTI has also been used to assess the effects of IUGR on the microstructural development of the brain. Results have shown a higher apparent diffusion coefficient value in the internal capsule of IUGR infants at birth compared with that of non-IUGR infants. This change persists at term, indicating reduced maturation in this area, which represents a major white matter fibre tract that normally myelinates between 34 and 40 weeks of gestational age. Further results have indicated reduced rela-tive anisotropy with a less well-developed fibre tract system at birth in the corpus callosum, the main interhemispheric
connection system(62). VBM has verified these findings by
revealing similar regions of microstructural changes in IUGR
preterm infants when compared with control groups(63,64).
1H-MRS has shown altered metabolites in grey and white
matter in preterm infants with IUGR(64,65). In grey matter,
NAA and myoinositol levels were reduced in the compro-mised group and energy supply alteration with increased creatine levels could also be measured. In white matter, similar alterations were present in infants with IUGR; in addition, an increased level of lactate was found, indicating altered metab-olism, possibly due to astrocyte metabolism changes.
MRI studies of nutritional effects on the brain in children.
Very few reports exist, but a study by Taki et al.(66) has
illus-trated how MRI could be used. The authors divided 290 healthy 11-year-old children into three groups, depending on their breakfast staple (rice, bread or both), and used VBM to look for differences in grey and white matter and also compared intelligence quotient (IQ) measures among the groups, incorporating covariates such as socio-economic class and age. Differences in both overall and regional grey and white matter volumes among the groups have been reported as well as a significant advantage for the rice group in the Perceptual Organisation Index Score of the IQ test. The glycaemic index has been suggested as a possible expla-natory mechanism.
The best evidence for nutritional effects on the brain would be to obtain MR images as an outcome measure for children who had taken part in an earlier randomised controlled trial of a nutritional intervention. For instance, two studies have reported structural and cognitive outcomes at adolescence in a subgroup of a cohort of preterm infants (all neurologically normal) who had taken part in a randomised feeding trial
peri-natally(67). In one study, a high-nutrient diet was associated
with larger volumes of the caudate nuclei and a higher
verbal IQ, but only in boys(68). In a later report, the percentage
of maternal breast milk in the infant diet was associated with a greater white matter volume and a higher verbal IQ; again, the
effects were stronger in boys(69).
VBM has been used to demonstrate relationships between
regional brain volumes and IQ(70) as well as more specific
cognitive functions such as reading(71), calculation(72) and
executive function(73). Likewise, other techniques, both
whole-brain segmentation and surface reconstruction, yielding volumetric and cortical thickness measures, have also shown sensitivity to differences in cognitive and behavioural func-tions. These techniques could therefore be used to explore whether a nutritional intervention affects such outcomes.
MRI studies of nutritional effects on the brain in adults. There are multiple mechanisms by which nutrients or
supplements may serve to protect the ageing brain(74,75),
including by lowering cerebrovascular disease, inflammation and/or oxidation. A recent, large study of elderly subjects has shown associations between image measures of brain health and cognitive function, on the one hand, and plasma biomarkers of vitamin and fatty acid status and trans-fat, on
the other hand(76).
There is much literature showing that elevated homocys-teine levels are negatively related to cognitive function in
ageing(77 – 80) with good indications from MRI studies that the
cognitive effects may be mediated through brain atrophy,
hyperintensities and/or subclinical infarcts(79,81 – 83). Still, it
may be that elevated homocysteine levels are not a causal mechanism for brain atrophy and cognitive deterioration, but rather a by-product. However, this possibility has recently been weakened by a large well-controlled intervention
study(84). The study was a randomised double-blind controlled
trial using high-dose folic acid and B vitamins in persons aged
.70 years and categorised as having mild cognitive
impair-ment. MRI scans were performed at the start and end of the study after 2 years. The mean rate of brain atrophy per year was significantly lower in the treatment group than in the placebo group and the treatment response was related to baseline homocysteine levels. The greater rate of atrophy in the placebo group, primarily seen in the images as an enlarge-ment of the ventricles, was associated with a lower final cognitive test score (Mini-Mental State Examination and Telephone Interview of Cognitive Status).
A recent study on long-chain PUFA (LC-PUFA) has shown that among older adults, dietary intake of fish with a higher EPA and DHA content was associated with a lower prevalence of subclinical infarcts and white matter abnormalities on MRI
examinations(76,85,86). This finding was extended by the
obser-vation that in middle-aged adults, DHA, but not EPA or a-lino-lenic acid, in serum, was associated with improved non-verbal
reasoning, working memory and vocabulary(86).
Choline, a precursor of acetylcholine and phosphatidyl-choline, is important for brain metabolism and is largely
obtained from the diet. Cohen et al.(87) measured plasma
and brain choline levels with 1H-MRS after a single choline
supplement in young and aged healthy subjects. The results showed that despite a similar choline increase in plasma in
British
Journal
of
both groups, the brain levels of choline measured by1H-MRS were lower in the aged group, indicating a decrease in choline
uptake into the brain with age(87). Given the role of choline in
cholinergic neuronal function, the reduced uptake of choline may be involved in altered brain function in the elderly and in neurodegeneration. Similarly, in a study on healthy adults using
31P-MRS, administration of uridine appeared to increase brain
membrane precursors (phosphomonoesters: phosphocholine
and phosphoethanolamine)(88). Furthermore, studies have
shown altered membrane phospholipids and fatty acid
metab-olisms in psychiatric or epileptic diseases using1H-MRS and31
P-MRS(89,90). It has also been reported that citicoline improves fron-tal lobe bioenergetics and alters phospholipid membrane turn-over. It may therefore help to mitigate cognitive declines associated with ageing by increasing energy reserves and utilis-ation, as well as increasing the amount of essential phospholipid membrane components needed to synthesise and maintain cell
membranes(91). In psychotic adults, ethyl-EPA supplementation
appears to improve symptoms in relation to an increase in brain glutathione levels and glutamate:glutamine ratio measured by
1
H-MRS, which can be linked to improved antioxidative defence
through astrocyte metabolism(92).
In the last few years, fMRI has been used to investigate the mechanisms related to the physiological or pathological regulation of food intake, as well as the cognitive/affective
processing of food-related stimuli(93). These studies have
identified a food-related functional recruitment in both sensory processing and emotion-related structures, including prefrontal, orbitofrontal temporal and cingulate regions, amygdala and insula. Nonetheless, few fMRI studies have tried to determine the role of nutrition in brain function. Recently, fMRI has been used to examine the effect of nutrition in young healthy volunteers who had a breakfast including various nutrients (i.e. food containing proteins, lipids, vitamins and minerals as well as carbohydrates) when compared with when they skipped breakfast or had only
sugar for breakfast(94). When participants were performing
memory and attention tasks, significantly higher brain acti-vation was observed in the medial prefrontal areas, but only following the nutritionally balanced breakfast.
Methodological limitations and recommendations of relevance to intervention studies
Any effects of nutrition found by MRI studies will need to be interpreted with care. Ideally, all of the scans for one study should be obtained using the same scanner and the same imaging protocol, because variations can complicate the interpretation of results. However, this is often not feasible in large-scale studies, and therefore standardised protocols across sites and scanner platforms allow data to be pooled. This can greatly increase the number of subjects and hence possible analyses. In recognition of this, multi-site initiatives, such as the Alzheimer’s Disease Neuroimaging Study (http:// www.adni-info.org/), have been launched in recent years, indicating that consistent and valuable results can be obtained
across sites and platforms(95). With standardisation criteria
carefully being tested and employed, multi-site initiatives can be highly powerful.
Findings from structural studies can be used to illustrate the complexities of linking structure to function. It is well known that a reduction of MRI-derived volume is often observed along with diminished cognitive function in injury or central nervous system (CNS) disorders, such as Alzheimer’s disease (AD). However, while a ‘bigger is better’ view has sometimes been supported in the study of relationships between normal brain structures and cognitive abilities, this is not likely to
hold independently of groups studied(96). For instance, a
decrease in cortical thickness is seen with increased cognitive
function in school-aged children(97,98), yielding a negative
cor-relation of cortical thickness and cognitive performance scores, whereas a shift in the direction of this relationship is seen during
ageing(99 – 101), with thinner cortices usually being accompanied
by some reduction of cognitive speed performance scores. This probably occurs because in children, cognitive develop-ment is enhanced by pruning or fine-tuning of synaptic connec-tion, along with intracortical myelinaconnec-tion, processes that would make the cortex appear thinner in MR images. On the other hand, during ageing, loss of synaptic spines and synapses, as well as neuronal shrinkage and possible neuronal loss, would decrease both cortical thickness and cognitive function. Thus, the relationship between volumetric/cortical surface character-istics and cognitive outcome is not constant throughout life.
Due to the high sensitivity of MRI to blood flow, it is crucial to recognise that not all interventions leading to a change in the BOLD signal may necessarily also lead to a perceivable
behavioural change in examined subjects(102). Nonetheless,
several studies have identified an association between blood flow and metabolic rate, suggesting that the blood supply is tightly regulated in space and time to provide the nutrients
for brain metabolism(103). Importantly, structure – function
relationships need to be defined to better understand disease- or nutrition-induced changes. This can be done using a stimulus – response paradigm and correlation with structural changes.
Furthermore, alterations in cognitive function due to ageing may depend on the specific task or function explored and may vary from one brain region to another. It is known, for example, that brain activity may be reduced in older persons when compared with younger individuals in prefrontal
cortex(104) or medial temporal areas(105) during different
memory tasks. On the other hand, an over-recruitment of the prefrontal cortex has often been described in older healthy
sub-jects during execution of various cognitive tasks(106). Therefore,
participant selection and screening may be fundamental in
cross-section evaluations(107). For instance, the inclusion of
relatively high-functioning elderly individuals may bias the cross-sectional results in such a way that the cross-sectional analyses indicate an over-recruitment of the dorsal frontal cortex, while the longitudinal analysis reveals an age-related
activity reduction in the same frontal regions(107).
Structural and functional data transformations should be carefully verified and, when available, population-specific templates should be used to optimise alignment and reduce
distortions(108). However, it is important that the variability
British
Journal
of
between standard templates and the study group is not too great. For example, it is necessary to take age into account, especially when studying infant brains, which differ a great deal in terms of gross morphometric features from those of older children and adults. Intracranial volume and brain size undergo dramatic changes in the first few years of life, and slight changes are also seen throughout the teens, but the overall intracranial and brain volume in school-age years is
very similar to that of adults(109)and standard templates may
be used. Moreover, some classification, averaging and match-ing techniques used employ procedures shown to be well
suited to account for varying anatomies(110).
When fMRI is used to study brain functional organisation in individuals of different ages, it is important to take into con-sideration that methods for fMRI data analysis are exquisitely sensitive to blood flow. This means that cerebrovascular changes associated with ageing could alter one or more
par-ameters of the vascular regulation(111) and hence the results.
For instance, studies that evaluated the visual cortex response during passive stimulation have reported a decreased fMRI signal in older adults when compared with younger individ-uals(112,113), and this was not caused by reduced neural activity, but rather by differences in neurovascular local
prop-erties(114). One or more valid control tasks should be used as
age-related differences in neurovascular response should influ-ence all conditions equally. Thus, an evaluation of the size of the within-group effect should be safer than a direct comparison of
the BOLD signal change in two age groups(115). Other possible
solution is the normalisation of the task-related signal change by the use of breath-holding to produce global changes in
BOLD signal(116)or with a simple sensory or motor task to
esti-mate the haemodynamic response function for each individual
included in the study(117).
We discuss here some of the issues pertinent to the
consumption of supplements (84), mostly using examples on
homocysteine. While the literature linking homocysteine levels to brain measures is impressive, some inconsistencies and nuances of general relevance to possible nutritional inter-vention studies should be mentioned.
Age at intervention. First, since relationships between
neuroimaging markers and nutrition indicators in adulthood have mostly been studied in middle-aged and older individ-uals, it is unknown whether relationships exist throughout the adult lifespan or at which point they may occur. The relationship between homocysteine levels and cognitive func-tion was confined to adults aged $ 60 years in a large-scale
study(80). To the extent that nutrients are tested for a protective
effect, they should be studied at an age span in which negative influences come into play (i.e. at a stage where age-associated atrophy has accumulated or become more marked or disease-related changes are more likely to set in).
Sex effects. There is some indication that relationships
may be stronger in men(83). This is not established enough
to justify targeting only men for nutritional interventions, but intervention studies need to be sufficiently powered to analyse sex effects. Since evidence for sex effects has also been found
in early intervention studies(68,69), it is probably informative to
include planned analyses by sex in all nutritional studies.
Use of multimodal imaging markers. While many studies
have found effects of nutrition indicators on the brain, the par-ticular measures that show effects may vary and are not always consistent across studies. For instance, while many studies on homocysteine levels have found effects on atrophy, one study has found no effect on atrophy, but only an effect on white
matter hyperintensities(83). Similarly, a recent study has
reported associations between total cerebral brain volume and biomarkers of vitamin (positive) and trans-fat (negative), while fatty acid biomarkers have been reported to be related
only to white matter hyperintensities(76). This points to the
importance of including multiple imaging measures. In addition, in line with recent studies pointing to the unique explanatory power of different imaging modalities relative to
each other(118), one should include several types of scans
with respect to outcome measures (e.g. T1 weighted, T2 weighted, DTI and MRS).
Regional neuroanatomical specificity of effects. To the
extent that hypotheses can be made a priori, studies should use analysis techniques that allow for testing effects located in specific brain systems. For instance, if fatty acids are hypoth-esised to affect the fibre integrity or myelination of major white matter tracts, DTI measures sensitive to this may be employed. It has been suggested that some discrepancies in the literature
regarding the effects of B6and B12vitamins and folic acid, and
by implication, homocysteine levels, may stem from differences in the sensitivity of image analysis techniques, where global measures of brain volumes will not necessarily capture
region-ally specific effects(119). In a small study using diet diaries,
evi-dence has been found for medial volumetric effects, including anterior cingulate and parietal areas, as well as temporal and
superior frontal effects of B6and B12vitamin and folic acid
sup-plement intake. Hence, studies should include analyses
sensi-tive to localised neuroanatomical effects(119).
Electroencephalography and magnetoencephalography: measuring brain electrical and magnetic activities Electroencephalography and magnetoencephalography techniques and electroencephalography/
magnetoencephalography-derived measures
EEG and MEG measure brain electrical and magnetic activities recorded from scalp electrodes and extracranial sensors, respect-ively. Scalp EEG activity is recorded as a voltage difference; thus, different reference derivations provide diverse voltage values at exploring electrodes. The general procedure for the recording of scalp EEG activity involves the positioning of an elastic cap with cabled cup electrodes or single-cup electrodes in standar-dised locations of the scalp. EEG procedures are especially suit-able for multicentric studies, since EEG systems are always present in neurological departments and the EEG data of different recording systems can be harmonised using calibration signals of a defined voltage amplitude (i.e. 100 mV).
MEG activity is a reference-free measure recorded by superconducting quantum interference devices, which are sensors able to transform very small magnetic fields into recordable currents. The general procedure for the recording
British
Journal
of
of extracranial MEG activity involves the demagnetisation of the subject and positioning of his or her head under a helmet with superconducting quantum interference devices. As a main merit, EEG and MEG signals have the highest temporal resolution compared with all the current brain imaging techniques (i.e. they can measure the amplitude of brain electromagnetic activity with a sampling , 1 ms).
From a physiological point of view, EEG and MEG signals derive from the post-synaptic ionic currents of synchronously active pyramidal neurons over extended cortical regions (cm) and reflect the integrative information processing of signals originating in the thalamus, brainstem and other cortical mod-ules. In these extended cortical regions, both tangentially and radially oriented sources produce most of the scalp EEG sig-nals, whereas only tangential sources produce MEG signals. It is noteworthy that EEG is characterised by a low spatial res-olution (i.e. the ability to localise the cortical source of scalp EEG activity within several centimetres), since different con-ductivities of head tissues (brain, meninges, skull and scalp) attenuate and blur the spatial distribution of neural currents from brain sources to scalp electrodes. To minimise these weakness points, EEG activity can be recorded from 48 to 128 electrodes and can be processed to obtain reference-free and spatially deblurred EEG activity. This can enhance the spatial resolution of EEG to a few centimetres and eliminate the need for a reference. With respect to EEG, the spatial resolution of MEG is higher (several millimetres in the best experimental conditions, namely simple evoked magnetic fields), since magnetic fields are not affected by different conductivities of brain, skull and scalp tissues.
The high temporal resolution of EEG and MEG signals is ideal for investigating the emerging features of brain physiology, namely awake resting-state brain rhythms. In this condition, the subjects are minimally affected by anxiety, fatigue and issues related to their cognitive – motor performance (task difficulty, meta-learning, etc.). It is also ideal for investigating immediate brain responses to sensory, cognitive or motor events in short-term (acute) and long-term (chronic) interven-tion studies. Spectral analysis methods allow the estimainterven-tion of EEG and MEG dynamics in terms of the dominant frequencies, power (or amplitude), phase and coherence of EEG rhythms. The background spontaneous oscillatory activity of brain neur-ons at about 10 Hz generates the dominant alpha rhythm of
rest-ing-state EEG and MEG activities(120). Oscillations in other
frequency bands, such as d (1 – 4 Hz), u (4 – 7 Hz) and g (30 – 70 Hz) bands, also exhibit complex patterns of power that are modulated by cognitive processes such as attention, perceptual
binding and working memory(121). On the other hand, EEG and
MEG techniques can be used to study the fine timing (millise-cond scale) of event-related or evoked cortical responses to external stimuli, mental operations or movements (Fig. 4). Func-tional connectivity between brain areas is crucial for perceptual and cognitive processes that are intrinsically based on the inte-gration of information represented in several cortical and sub-cortical areas in the human brain. Both resting-state and the mentioned event-related EEG/MEG measures can be used as input for the evaluation of functional connectivity of brain net-works. Spectral coherence (linear), directed transfer function
(linear) and synchronisation likelihood (linear and nonlinear) techniques are typically used to do so from EEG/MEG rhythms recorded during resting-state conditions, while event-related covariance can be used from event-related potentials (ERP)/
event-related fields(122). The choice between EEG and MEG
techniques depends on the importance of spatial resolution for testing the working hypothesis (effects of the intervention on specific cortical regions).
Eligibility for an electroencephalography/ magnetoencephalography examination
EEG/MEG recordings are fully non-invasive and technically easy procedures that can be easily repeated several times in human subjects of any age (i.e. from newborns to elderly people) and clinical status (i.e. patients in a coma or a vege-tative state) without ‘repetition’ effects. It has been shown that EEG variables correlate with individual subjects’ cogni-tive state and specific intellectual abilities (e.g. reading) during child development, including individuals with Down
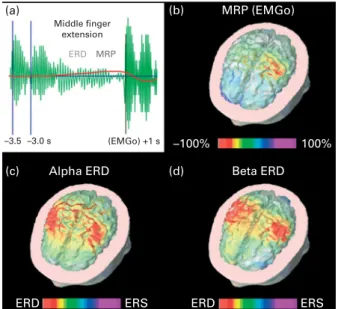
Middle finger extension (a) (b) (d) (c) –3.5 –3.0 s
Alpha ERD Beta ERD
MRP (EMGo) ERS ERS ERD ERD –100% 100% (EMGo) +1 s ERD MRP
Fig. 4. Analysis in the time and frequency domains of electroencephalo-graphic (EEG) data related to a motor event (i.e. voluntary self-paced right middle finger extensions). (a) A schematic representation of ongoing EEG rhythms at a frequencies (about 10 Hz) before, during and after the onset of the electromyographic (EMGo) activity associated with voluntary self-paced middle finger extensions. It can be seen that the amplitude of alpha rhythms is reduced during the preparation and execution of the movement, the so-called alpha event-related desynchronisation (ERD) and is enhanced after the EMGo, the so-called event-related synchronisation (ERS). In the same dataset, a slow negative shift is hidden in the EEG oscillations, namely the movement event-related potentials (MRP). The example shows that the same EEG dataset can be analysed in the frequency domain to compute the alpha ERD and in the time domain to produce MRP. (b) A topographic map show-ing cortical sources of the MRP as computed by a weighted, minimum-norm linear inverse estimation. It can be noted that the maximum source amplitude (red hot spot) is represented in the Rolandic region of the left hemisphere contralateral to the movement side. (c, d) Topographic maps showing cortical sources of the ERD at a (about 10 Hz) and b (about 20 Hz) frequencies. With respect to the MRP, alpha and beta ERD were characterised by maximum source amplitude (red hot spots) in the Rolandic regions of both hemi-spheres. It is concluded that quantitative EEG techniques can reveal parallel physiological processes underlying the activation of sensorimotor cortical regions related to voluntary movements.
British
Journal
of
syndrome(123); overweight or underweight adults(124,125); and patients with disorders of vigilance, consciousness and
communication(126,127); as well as elderly subjects with intact
cognitive status or cognitive decline progressing to overt
dementia(128 – 134). Such a correlation is typically moderate
and emerges with relatively large populations (n . 30) and a fine clinical and neuropsychological assessment. Further-more, sex differences in ERP topography and amplitude
have been reported in children and adults(135,136).
EEG/MEG can be used for testing the neurophysiological effects of pharmacological, rehabilitation or nutritional inter-ventions immediately after an acute dose administration or after long-term programmes. EEG/MEG recordings are suit-able for studying the group differences in between-group and within-group designs. Both techniques can be used in multicentric trials since the hardware of different brands can be easily calibrated and harmonised, although the availability of EEG is much wider than that of MEG, largely due to the much higher costs of MEG.
Use of electroencephalography/magnetoencephalography in nutritional studies
In the following, we highlight a selection of EEG and MEG papers to illustrate the resting-state, evoked potential (EP)/ evoked field and ERP/event-related field markers that capture the short-term (acute) and long-term (chronic) effects of nutri-ents on brain activity in healthy infants, children and adults. Specifically, with regard to acute effects, we focus on caffeine, and for the long-term effects of food interventions on brain function, we focus on studies that have investigated the effects of LC-PUFA as these nutrients have been repeatedly used to supplement milk formulas for infants and children during the developmental time course. Practically, no MEG studies on the effects of caffeine and LC-PUFA have been found. In the following paragraph, we summarise the main results and conclusions (Babiloni et al., unpublished results, 2012).
Caffeine has evident psychoactive effects at doses
compar-able to one to ten servings of tea or cola(137)as assessed with
the behavioural measures of cognitive function. A series of EEG and ERP studies have tested the effects of caffeine on brain activity during wakeful resting, mainly in adults and
also in children and during ageing(138 – 144) (see Lorist &
Tops(145) for a review). In these studies, resting-state EEG
markers have been frequently used to study the psychoactive effects of caffeine, mostly at relatively high doses (200 – 500 mg) in adults. Generally, caffeine decreases a power,
which indicates increased alertness or arousal(146) consistent
with the behavioural literature (see Ruxton(137) for a
review). Both behavioural and EEG studies struggle with the same fundamental questions such as how to correct for habit-ual caffeine use and body weight and to what extent caffeine effects can be attributed to the relief of withdrawal effects. Therefore, traditional background EEG measures may not add significant insights into the behavioural measures of caf-feine effects, but it could be speculated that statistical func-tional coupling of resting-state EEG rhythms at electrode pairs as revealed by additional mathematical techniques, such
as spectral coherence (linear), directed transfer function (linear) and synchronisation likelihood, might provide more
informative markers about the caffeine effects(122). These
vari-ables have been successfully used to disentangle abnormal changes of functional connectivity in the resting-state condition in elderly subjects suffering from preclinical or earlier stages of AD(128 – 132) as well as after acute administration of nicotine,
cocaine, marihuana, alcohol or medications(147 – 151). The
changes in functional connectivity measures in mild AD have been the target of a recent multi-country randomised con-trolled trial with a medical food. The studied product provides the nutritional precursors and cofactors for the formation of neuronal membranes, aiming to improve synapse formation and function in AD; hence, the study included EEG measures as secondary outcomes as markers for synaptic
connec-tivity(152). Findings included significant amelioration in peak
frequency and functional connectivity in the d band over the 24-week intervention period in the experimental group compared with the control, suggesting preserved and even
increased synaptic function resulting from the intervention(152).
In addition to resting-state EEG, several ERP studies have inves-tigated the effects of caffeine on the brain using simple (e.g. rapid visual information processing and oddball) or more com-plex (e.g. switch task) attention tasks. ERP studies have added more detailed insights into what aspects of attention are improved by caffeine (generally processes following simple stimulus processing) and at which level of information proces-sing (complex tasks seem to show more benefits).
With regard to the effects of long-term food interventions, LC-PUFA have been the subject of many studies, particularly those on infant development. Several studies using ERP and resting-state EEG measures have investigated diet-related effects of n-3 and n-6 fatty acids in mothers and infants, as
well as in healthy adults(153 – 164). In summary, diets with n-3
and n-6 fatty acids can influence resting-state EEG, not only in infants and children during development but also in adults, suggesting increased plasticity of neuronal membranes and synaptogenesis. The large majority of ERP studies have focused on EP, especially visual EP have been used as func-tional markers of the maturation of the visual system of infants fed with a LC-PUFA-supplemented formula or a control
for-mula for 12 months(165,166). In the same vein, auditory EP or
brainstem auditory EP have similarly been used as functional
markers of the auditory system(167,168). Indeed, from a
neuro-developmental perspective, visual EP and brainstem auditory EP are the measures of choice for probing the maturation of the visual and auditory systems during development in infants and children before the acquisition of the verbal skills required for behavioural tests. Compared with the control group, preterm infants with low birth weights (, 1500 g) receiving n-3 and n-6 supplementation for 9 weeks showed a significantly lower amplitude of ERP in response to fre-quently presented pictures, a possible reflection of a better
short-term recognition memory of these frequent pictures(169).
In school-aged children and adults, ERP during oddball tasks (measuring sustaining attention to a continuous stream of stimuli and responding to pre-specified infrequent target stim-uli) and Go – Nogo paradigms (assessing sustaining attention