Comparison of a possession score and a poverty index
in predicting anaemia and undernutrition in pre-school
children and women of reproductive age in rural and
urban Coˆte d’Ivoire
Fabian Rohner
1,2,3,*, Andres B Tschannen
3, Christine Northrop-Clewes
1,
Vale´rie Kouassi-Gohou
4,5, Patrice E Bosso
6and C G Nicholas Mascie-Taylor
71GAIN – Global Alliance for Improved Nutrition, PO Box 55, 1211 Geneva, Switzerland:2Institute of Food Science and Nutrition, ETH Zurich, Zurich, Switzerland:3Centre Suisse des Recherches Scientifiques,
Abidjan, Coˆte d’Ivoire:4Institut National de Sante´ Publique, Abidjan, Coˆte d’Ivoire:5Direction de l’Information de la Planification et de l’Evaluation, Ministe`re de la Sante´ et de l’Hygie`ne Publique, Abidjan, Coˆte d’Ivoire: 6Helen Keller International Coˆte d’Ivoire, Abidjan, Coˆte d’Ivoire:7Department of Biological Anthropology, University of Cambridge, Cambridge, UK
Submitted 8 December 2011: Final revision received 13 April 2012: Accepted 30 April 2012: First published online 12 June 2012 Abstract
Objective: To determine whether a possession score or a poverty index best predicts undernutrition and anaemia in women of reproductive age (15–49 years; WRA) and children aged 6–59 months living in Coˆte d’Ivoire.
Design: Anthropometric measurements were converted to Z-scores to assess stunting, wasting and underweight in children, and converted to BMI in WRA. A venous blood sample was drawn, and Hb concentration and Plasmodium spp. infection were determined. A possession score was generated with categories of zero to four possessions. A five-point (quintile) poverty index using household assets was created using principal component analysis. These socio-economic measures were compared for their ability to predict anaemia and malnutrition. Setting: Data were from a nationally representative survey conducted in Coˆte d’Ivoire in 2007.
Subjects: A sample of 768 WRA and 717 children aged 6–59 months was analysed. Results: Overall, 74?9 % of children and 50?2 % of WRA were anaemic; 39?5 % of the children were stunted, 28?1 % underweight and 12?8 % wasted, while 7?4 % of WRA had BMI , 18?5 kg/m2. In general, there were more stunted and under-weight children and thin WRA in rural areas. The poverty index showed a stronger relationship with nutritional status than the possession score; mean Hb difference between the poorest and wealthiest quintiles in children and WRA was 8?2 g/l and 6?5 g/l, respectively (13?9 % and 19?8 % difference in anaemia, respectively; P , 0?001), and Z-scores and BMI were significantly better in the wealthiest quintile (P , 0?001).
Conclusions: The poverty index was generally a better predictor of undernutrition in WRA and pre-school children than the possession score.
Keywords Anaemia Malnutrition Poverty index Possession score
Undernutrition is the underlying cause of 3?5 million deaths globally and 35 % of the disease burden in pre-school children(1). Recent estimates suggest that anaemia affects up to 50 % of children and roughly one-third of women of childbearing age, particularly in deprived populations in the developing world(2). Anaemia is a significant risk factor for perinatal and maternal mortality, impairs cognitive devel-opment in children and reduces work capacity in adults(3). Although the aetiology of anaemia is multifactorial, malaria contributes importantly to its incidence in children living in malaria-endemic regions(4).
It is widely recognised that socio-economic status (SES) is an important predictor of an individual’s health and well-being(5,6)but there is no international agreement as to how SES can and should be assessed. Some researchers have focused on a wealth scale (or poverty index), a variable created using the technique of principal com-ponent analysis (PCA); others on a possession score which is a variable constructed from the ownership of specific household items(7). A recent study in Bangladesh using the data from the national Demographic Health Survey compared a possession score and a poverty index
in predicting children’s nutritional status and found that the possession score provided much better discrimination of the extent of stunting, underweight and wasting than the poverty index(8).
The present study thus extends the comparison of a poverty index and a possession score in relation to nutritional status (as measured by anthropometry) and anaemia to adult non-pregnant women and children under 5 years of age in Coˆte d’Ivoire, West Africa, and considers the impact of malaria and age as confounders. It assesses to what extent socio-economic proxies can be used to predict the magnitude of a nutritional problem and help prioritise programming.
Design and methodology Survey design
A nationally representative cross-sectional survey was con-ducted in Coˆte d’Ivoire in July/August 2007. The country was disaggregated into nine eco-regions, and the sampling strategy was based on the general population census of 1998(9) previously used in two surveys(10,11). One district was randomly chosen to be representative for each eco-region, and within that district, the district capital (urban) and several rural areas were selected. The only exception was Abidjan, the country capital, which is only urban. For each eco-region the number of clusters was defined using the proportional-to-population-size approach. In total there were sixty clusters, with equal numbers of clusters from rural and urban areas. In each cluster fourteen households were selected using the Expanded Programme on Immu-nization method(12). Within the households, the study focused on children aged 6–59 months and women of reproductive age (15–49 years; WRA). Only one individual per age group was selected using the Kish table for random selection, resulting in expected sample sizes of 840 pre-school children and WRA.
Ethics and consent
Approval for the study was granted by the ethical com-mittee of the Ministry of Health in Coˆte d’Ivoire (Comite´ National d’Ethique des Sciences de la Vie et de la Sante´ number 4027).
Inclusion in the survey was dependent on the house-hold head being willing to participate in the survey and giving written informed consent for phlebotomy. Written informed consent was additionally sought from the adult female participant. Exclusion criteria included: refusal to participate, presence of medical contraindications for blood drawing or presence of infection (high fever, pro-longed diarrhoea, ‘excessive weakness’).
Enrolment of participants
After the household selection and consent to take part in the survey, all consenting and eligible individuals were
registered (household, sex, age, date, ID number). The respondents answered questions on demographics, health and SES (housing quality, access to water, elec-tricity, transport) and eligible household members were then invited to go to the nearest health facility to give a blood sample, where anthropometric measurements were taken, too.
Blood sampling and analysis
Intravenous blood samples were collected from the antecubital vein of WRA and children .12 months of age. The venous blood samples (7?5 ml from WRA, 2?5 ml from children) were drawn into EDTA-treated evacuated tubes (Vacutainer R; Becton Dickinson; Franklin Lakes, NJ,
USA). Immediately after blood sampling, Hb concentra-tion was determined using a Hemocue R
(Hemocue, A¨ ngelholm, Sweden) and results were noted and given to the respondent. For quality control, liquid reference samples provided by the supplier were used to test the Hemocue twice daily. Hb concentration of ,110 g/l in children aged 6–59 months and of ,120 g/l in WRA are the international cut-offs for anaemia (WHO, 2001). On diagnosis of severe anaemia, i.e. Hb concentration of ,60 g/l (WHO cut-off adjusted by 210 g/l for an African country(13,14)), a rapid detection test for malaria was carried out using a dipstick. With diagnosed parasitaemia, antimalarial treatment was administered according to established national guidelines. For all severely anaemic but not malarial individuals, an iron supplementation course according to national guidelines was administered. After phlebotomy and on-site diagnostics, the remain-ing whole blood was stored on ice and protected from direct light until further processing. After completion of a cluster (usually early afternoon), thick and thin blood films for malaria testing were prepared, stained with Giemsa and dried for storage.
Malaria slides were examined under a microscope for species-specific Plasmodium infection. Parasites were counted against 200 leucocytes (if ,10 parasites were identified, counting was continued up to 500 leucocytes). Counts were converted to the number of parasites/ml of blood, assuming a leucocyte count of 8000/ml(15). Anthropometry
Anthropometric measurements were taken using standard techniques(16). The Z-scores for height-for-age (HAZ), weight-for-age (WAZ) and weight-for-height (WHZ) for each child were determined using the WHO 2006 growth standards(17). A child with a HAZ of ,22?00 is classified as stunted, WAZ of ,22?00 is underweight and WHZ of ,22?00 is wasted.
For WRA, the BMI was calculated ([weight (kg)]/[height (m)]2) and four BMI categories were generated(18): underweight as BMI , 18?5 kg/m2, normal weight as BMI 5 18?5–24?9 kg/m2, pre-obese as BMI 5 25?0–29?9 kg/m2and obese as BMI $ 30?0 kg/m2.
Socio-economic classification
A possession score was developed based on the Multi-dimensional Poverty Index (MPI)(19). The MPI possession score is based on ownership of a radio, television, mobile phone, bicycle or motorbike, with scores ranging from 0 (no possessions) to 4 (ownership of four possessions).
The poverty index is based on household character-istics and assets, including quality of housing (type of roof, wall), access to electricity and water, possession of electronic equipment and transport. Analysis was done based on a PCA-based asset index(20), using a method and formula by Gwatkin et al.(21). For PCA, missing data were replaced prior to analysis with the mean of the asset. The discontinuous poverty index variable was then divided along predefined quintiles to assign each household to a socio-economic quintile, where 1 is the poorest quintile and 5 is the richest quintile.
The poverty index used a more comprehensive list of household assets which included all assets used by the MPI approach.
Statistical analysis
Statistical analysis was done using the SPSS statistical soft-ware package version 18. All continuous data were checked for skewness using the Cox test (coefficient of skewness divided by standard error of skewness) as well as by examination of the frequency distribution with a normal curve. The relationship between two categorical variables was analysed by the x2test and between continuous vari-ables by the independent-sample t test or one-way ANOVA. Curve estimation included testing for linear and quadratic effects of the continuous independent variables. Sequential multiple regression analyses were used to analyse depen-dent continuous variables with two or more independepen-dent variables. When BMI was analysed as a categorical variable, stepwise (forward entry) multinomial logistic regression
analyses were undertaken and for categorical Z-scores sequential binary logistic regressions analyses were run.
Results
Demographic information
Information was available on 768 WRA and 717 children aged 6–59 months, of whom 52 % were males (sex ratio 1?08:1, male:female, respectively). The mean ages of WRA and children were 27?7 (SD7?8) years and 30?7 (SD15?3)
months, respectively, and there were no significant dif-ferences in mean age by urban/rural (residency), poverty index, possession score or sex of the child.
Distribution of poverty index and possession score by urban/rural residency
Data on 815 households were available (56?2 % urban, 43?8 % rural). The population distribution disaggregated into urban and rural by poverty index and possession score is presented in Fig. 1; the poverty index showed a much stronger association with residency than the possession score although both were highly significant (P , 0?001). Applying the poverty index, only 0?2 % of the poorest quintile lived in urban areas compared with 32?8 % in rural areas, and only 2?5 % of the wealthiest quintile were from the rural areas compared with 38?9 % from urban areas; using the possession score, 8?1 % of urban households had zero possessions (compared with 23?5 % from rural areas) and 8?1 % of rural households owned four possessions (compared with 14?8 % from urban areas).
Hb concentrations
The mean Hb concentration in WRA and children was 118?1 g/l and 99?5 g/l, respectively, and there was no significant difference in means between boys and girls. There was a significant positive association between child
40.00 30.00 20.00 10.00 0.00 40.00 50.00 30.00 20.00 10.00 0.00 1 2 3 4 5 0 1 2 3 4
Poverty index Possession score
% %
Fig. 1 Population distribution disaggregated into urban ( ) and rural ( ) strata across wealth quintiles for the poverty index (1 5 poorest; 5 5 wealthiest) and number of possessions for the possession score (0 5 no possessions; 4 5 four possessions): data from a nationally representative survey conducted in Coˆte d’Ivoire in 2007 on a sample of 768 women of reproductive age (15–49 years) and 717 children aged 6–59 months
Hb concentration and age, with Hb increasing by, on average, 0?31 g/l per month (P , 0?001). In addition, children infected with Plasmodium falciparum had a significantly lower Hb concentration than uninfected children (93?8 g/l v. 101?5 g/l, respectively; P , 0?001). After correcting for age and infection with Plasmodium spp. (as either intensity of infection or prevalence), mean Hb concentration was still significantly higher among the urban children than the rural children by about 4?3 g/l. No significant difference in mean Hb concentrations was found between infected and uninfected WRA.
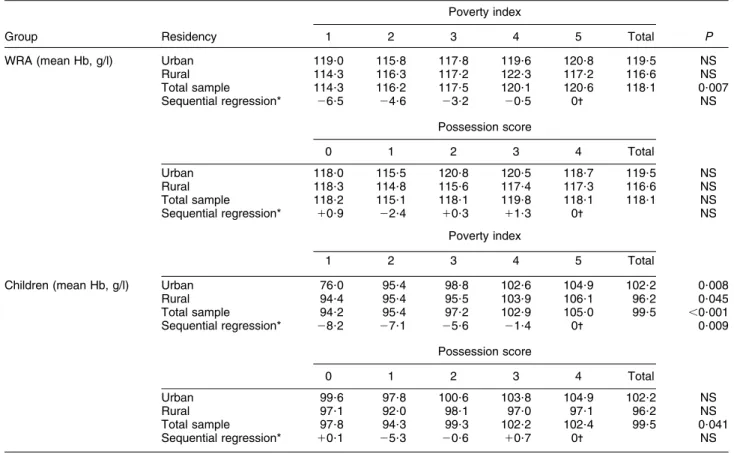
Sequential multiple regression analyses were used to test the relationship between Hb concentration, residency and poverty index or possession score in WRA and chil-dren. For WRA, after removing the effects of residency, there were no significant differences in Hb means for either poverty index or possession score (Table 1). However, in the total sample there was a consistent sig-nificant downward trend in Hb concentration from the wealthiest to the poorest quintile when measured by the poverty index (P 5 0?007). In children, the analyses removed age, malarial status and residency before testing for the effect of either poverty index or possession score. For possession score, there was a significant effect on mean Hb (P 5 0?041) but no obvious trend. For the
poverty index, a very significant (P 5 0?009) trend emerged, and Hb concentration in the poorest quintile was 8?2 g/l lower than in the wealthiest quintile.
Anaemia
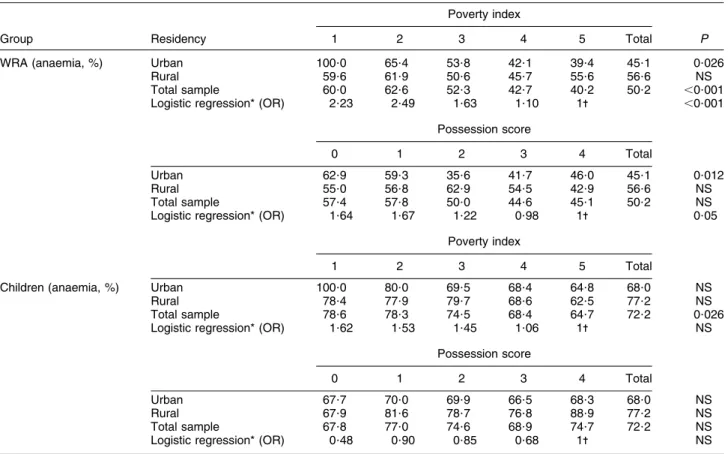
Among WRA, 50?2 % were anaemic, of whom 1 % had severe anaemia using the WHO recommended cut-off of ,70 g/l(22). For the poverty index, there was a significant downward trend in anaemia prevalence from the poorest to the wealthiest quintile in urban areas and in the total sample of WRA (Table 2). A sequential binary logistic regression, which removed the effects of residency, revealed that the poverty index remained significant when entered last into the model (P , 0?001). WRA in the two poorest quintiles were about 2?25 times more likely to be anaemic than those in the wealthiest two quintiles. Overall, 62?1 % of anaemic women and 53?9 % of non-anaemic women were correctly predicted from knowledge of residency and poverty index, respectively.
For possession score, only the urban sample showed significant heterogeneity in anaemia prevalence and those living in households with two or more possessions had the lowest anaemia prevalence. The sequential binary logistic regression revealed that after removing residency there was a significant effect; those with zero or one Table 1 Mean Hb concentration (g/l) by poverty index, possession score and residency (urban/rural) among a nationally representative sample of 768 women of reproductive age (15–49 years; WRA) and 717 children aged 6–59 months, Coˆte d’Ivoire, 2007
Poverty index
Group Residency 1 2 3 4 5 Total P
WRA (mean Hb, g/l) Urban 119?0 115?8 117?8 119?6 120?8 119?5 NS
Rural 114?3 116?3 117?2 122?3 117?2 116?6 NS Total sample 114?3 116?2 117?5 120?1 120?6 118?1 0?007 Sequential regression* 26?5 24?6 23?2 20?5 0- NS Possession score 0 1 2 3 4 Total Urban 118?0 115?5 120?8 120?5 118?7 119?5 NS Rural 118?3 114?8 115?6 117?4 117?3 116?6 NS Total sample 118?2 115?1 118?1 119?8 118?1 118?1 NS Sequential regression* 10?9 22?4 10?3 11?3 0- NS Poverty index 1 2 3 4 5 Total
Children (mean Hb, g/l) Urban 76?0 95?4 98?8 102?6 104?9 102?2 0?008
Rural 94?4 95?4 95?5 103?9 106?1 96?2 0?045 Total sample 94?2 95?4 97?2 102?9 105?0 99?5 ,0?001 Sequential regression* 28?2 27?1 25?6 21?4 0- 0?009 Possession score 0 1 2 3 4 Total Urban 99?6 97?8 100?6 103?8 104?9 102?2 NS Rural 97?1 92?0 98?1 97?0 97?1 96?2 NS Total sample 97?8 94?3 99?3 102?2 102?4 99?5 0?041 Sequential regression* 10?1 25?3 20?6 10?7 0- NS
Poverty index: 1 5 poorest; 5 5 wealthiest. Possession score: 0 5 no possessions; 4 5 four possessions.
*Sequential multiple regression analysis which removed the effects of residency before testing for either poverty index or possession score.
possession were 1?67 times more likely to be anaemic than those with three or more possessions (P 5 0?05). Overall 61?3 % of anaemic women and 48?2 % of non-anaemic women were correctly predicted from knowl-edge of residency and possession score.
In children, 74?9 % were anaemic, of whom 9?5 % were suffering from severe anaemia. Applying the poverty index, there was a significant downward trend in prevalence of anaemia from the poorest to the wealthiest quintile found in children in the total sample (P 5 0?03) and a non-significant trend in the urban children (Table 2). However, the sequential binary logistic regression analyses did not find any significant effect and the model was a poor fit, correctly predicting only 4?3 % of non-anaemic children.
For possession score, there was no significant variation in prevalence of anaemia by residency or in the total sample. The sequential binary logistic regression was also not significant and the model was poor, correctly predicting only 6?5 % of non-anaemic children.
Anthropometry
Women of reproductive age: BMI
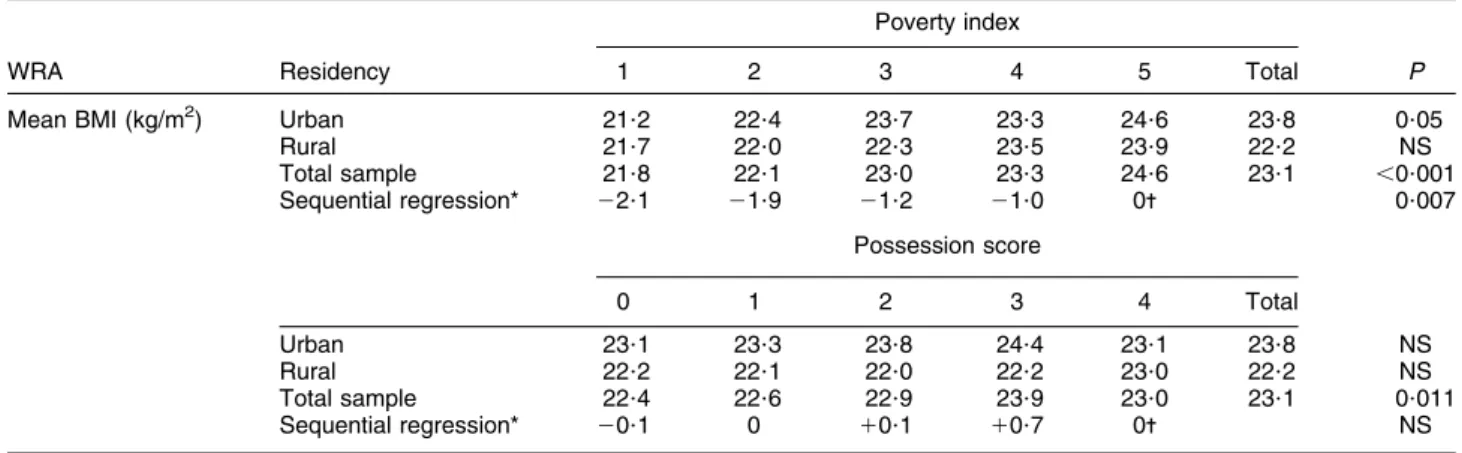
The mean BMI was 23?1 kg/m2(Table 3) and BMI increased significantly with age (on average by 0?11 kg/m2per year;
P , 0?001). BMI in urban areas was significantly higher than in rural areas by on average 1?6 kg/m2(P , 0?001).
In the total sample and urban stratum, mean BMI varied significantly between the quintile groups of the poverty index (P , 0?001 and P 5 0?05, respectively; Table 3). In both urban and rural samples as well as the total sample, there was a significant positive linear trend in means from the poorest to the wealthiest quintile (urban, P 5 0?012; rural, P 5 0?007; total sample, P , 0?001; not shown in table). The sequential multiple regression, which removed the effects of age and residency, confirmed the trend, and there was a difference of 2?1 kg/m2 between the poorest and wealthiest quintile groups (P 5 0?007; Table 3).
Mean BMI did not vary significantly by possession score in urban and rural areas, but for the total sample there was significant heterogeneity (Table 3), with a tendency for the means to increase from the poorest to the wealthiest quintile (linear trend P 5 0?007; not shown in table). However a sequential multiple regression ana-lysis that removed the effects of age and residency found no significant heterogeneity by possession score. Women of reproductive age: BMI categories
Underweight was found in 7?4 % of WRA, 67?6 % were in the normal weight range, 17?6 % were pre-obese and Table 2 Anaemia prevalence (%) by poverty index, possession score and residency (urban/rural) among a nationally representative sample of 768 women of reproductive age (15–49 years; WRA) and 717 children aged 6–59 months, Coˆte d’Ivoire, 2007
Poverty index
Group Residency 1 2 3 4 5 Total P
WRA (anaemia, %) Urban 100?0 65?4 53?8 42?1 39?4 45?1 0?026
Rural 59?6 61?9 50?6 45?7 55?6 56?6 NS
Total sample 60?0 62?6 52?3 42?7 40?2 50?2 ,0?001
Logistic regression* (OR) 2?23 2?49 1?63 1?10 1- ,0?001
Possession score
0 1 2 3 4 Total
Urban 62?9 59?3 35?6 41?7 46?0 45?1 0?012
Rural 55?0 56?8 62?9 54?5 42?9 56?6 NS
Total sample 57?4 57?8 50?0 44?6 45?1 50?2 NS
Logistic regression* (OR) 1?64 1?67 1?22 0?98 1- 0?05
Poverty index
1 2 3 4 5 Total
Children (anaemia, %) Urban 100?0 80?0 69?5 68?4 64?8 68?0 NS
Rural 78?4 77?9 79?7 68?6 62?5 77?2 NS
Total sample 78?6 78?3 74?5 68?4 64?7 72?2 0?026
Logistic regression* (OR) 1?62 1?53 1?45 1?06 1- NS
Possession score
0 1 2 3 4 Total
Urban 67?7 70?0 69?9 66?5 68?3 68?0 NS
Rural 67?9 81?6 78?7 76?8 88?9 77?2 NS
Total sample 67?8 77?0 74?6 68?9 74?7 72?2 NS
Logistic regression* (OR) 0?48 0?90 0?85 0?68 1- NS
Poverty index: 1 5 poorest; 5 5 wealthiest. Possession score: 0 5 no possessions; 4 5 four possessions.
*Sequential multinomial logistic regression which removed the effects of residency before testing for either poverty index or possession score.
7?5 % were obese. There was significant urban/rural heterogeneity with more underweight women in rural areas and more pre-obesity and obesity in urban areas (P , 0?001). Only the poverty index was significantly associated with BMI category; one in seven women in the poorest quintile were affected by underweight, compared with only one in twenty in the wealthiest quintile. When examined separately, there was no significant relationship between poverty index and BMI category in either the urban or rural areas; but in the total sample underweight was more common in the poorest quintile and obesity in the richest. A stepwise multinomial logistic regression analysis showed that after removing the effects of age and residency, there was no significant effect of poverty index on BMI category (data not shown).
There were no significant associations between pos-session score and BMI category by residency (Table 3) and the stepwise multinomial logistic regression analysis did not reveal any significant effect of possession score. Children: height-for-age, for-age and weight-for-height Z-scores
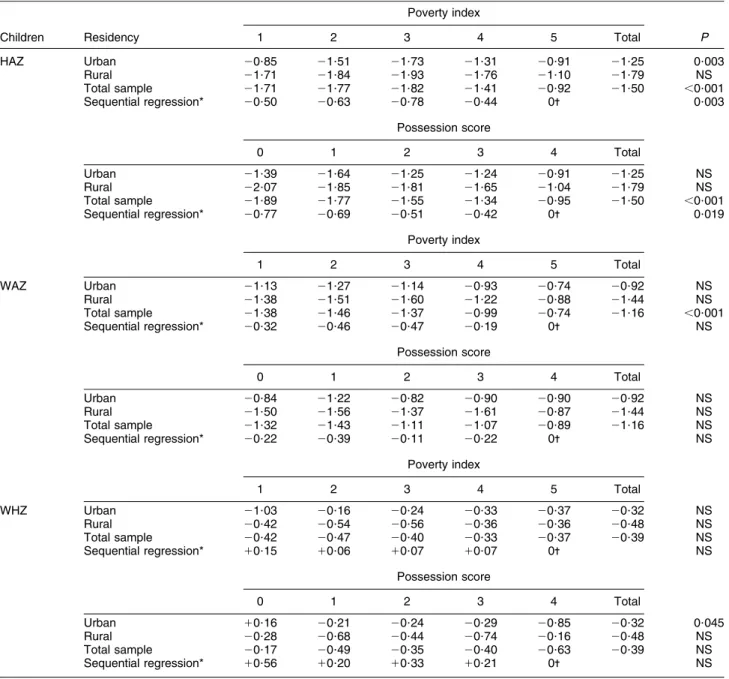
There were no significant associations between any of the Z-scores and age, nor did the means differ by sex of the child or by infection with Plasmodium spp. (data not shown). Mean Z-scores were 21?50, 21?16 and 20?39 for HAZ, WAZ and WHZ, respectively. HAZ and WAZ means were significantly worse in rural than urban areas (both P , 0?001) by about 0?5 SD (Table 4), but there was no
significant residency difference for WHZ.
There was significant heterogeneity for HAZ by poverty index in urban areas and the total sample (Table 4), wherein the means got worse up to quintile 3 and then improved. For WAZ there was a significant linear trend of improving means from the poorest to the wealthiest quintile group in the urban stratum (P 5 0?014) and total sample (P , 0?001; not shown in table). WHZ means did
not vary significantly by poverty index. Sequential mul-tiple regression which removed the effect of residency found a significant effect only for HAZ, which confirmed the worsening means up to quintile 3.
In the total sample, possession score for HAZ showed a consistent improvement in means from zero to four possessions (linear trend P , 0?001). For WAZ, in the total sample there was a non-significant linear trend with children living in households with zero or one possession being more underweight than those with two or more possessions. For WHZ there was heterogeneity in means only in the urban sample but with no linear trend. The sequential regression analysis found a significant effect only for HAZ, with improving means from zero possessions to four possessions (Table 4).
Children: stunting, underweight and wasting
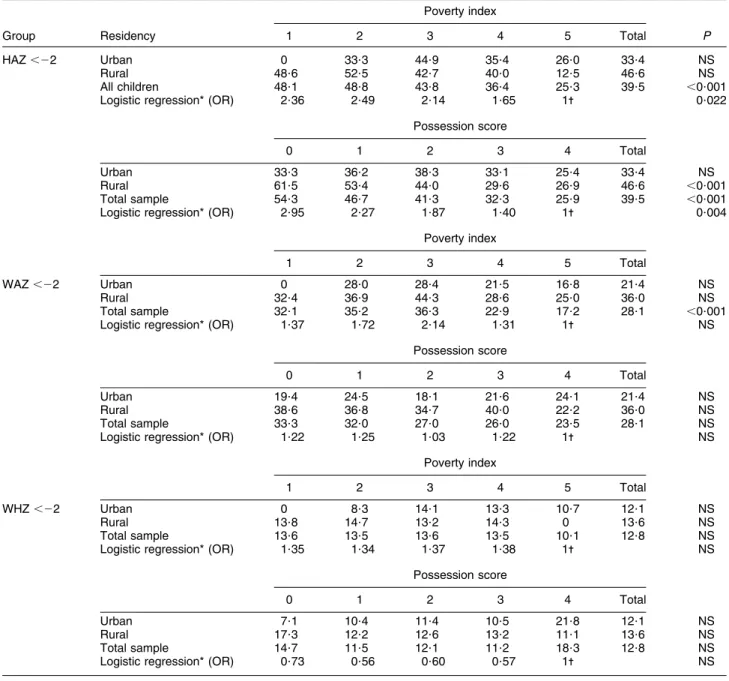
Overall, 39?5 % of children were stunted, 28?1 % under-weight and 12?8 % wasted (Table 5), but the prevalence of stunting, underweight and wasting was respectively 13?2 %, 14?6 % and 1?5 % less in urban than rural children. There were no significant trends according to poverty index or possession score in urban and rural areas for any of the three indices. In the total sample, however, there was a tendency for stunting to decline from the poorest to the wealthiest quintile group (P , 0?001); while about a third of the children were underweight in the lowest three quintiles falling to about a fifth for the wealthiest two quintiles. No significant differences were apparent for wasting, which remained at about 13 % across the quin-tiles. The stepwise binary logistic regression analysis found that there was a significant effect of poverty index only on stunting after removing residency (P 5 0?022).
Possession score showed a strong association with stunting in the rural areas and the total sample (Table 5), and the percentage of children who were stunted fell by over a half between those with zero and four possessions. Table 3 Mean BMI (kg/m2) by poverty index, possession score and residency (urban/rural) among a nationally representative sample of
768 women of reproductive age (15–49 years; WRA), Coˆte d’Ivoire, 2007
Poverty index
WRA Residency 1 2 3 4 5 Total P
Mean BMI (kg/m2) Urban 21?2 22?4 23?7 23?3 24?6 23?8 0?05
Rural 21?7 22?0 22?3 23?5 23?9 22?2 NS Total sample 21?8 22?1 23?0 23?3 24?6 23?1 ,0?001 Sequential regression* 22?1 21?9 21?2 21?0 0- 0?007 Possession score 0 1 2 3 4 Total Urban 23?1 23?3 23?8 24?4 23?1 23?8 NS Rural 22?2 22?1 22?0 22?2 23?0 22?2 NS Total sample 22?4 22?6 22?9 23?9 23?0 23?1 0?011 Sequential regression* 20?1 0 10?1 10?7 0- NS
Poverty index: 1 5 poorest; 5 5 wealthiest. Possession score: 0 5 no possessions; 4 5 four possessions.
*Sequential multiple regression analysis which removed the effects of residency before testing for either poverty index or possession score.
The sequential binary logistic regression confirmed the downward trend and after adjusting for residency, a child in a household with zero possessions was 2?95 times more likely to be stunted than a child from a household with four possessions. Neither wasting nor underweight showed an association with possession score.
Discussion
In the present study two indices of SES, the poverty index and the possession score, were compared for their usefulness
in predicting variation in the health and nutritional status of two population groups, children under 5 years and WRA, nationally and in rural and urban areas of Coˆte d’Ivoire. The poverty index has been extensively used in the past, including previously in Coˆte d’Ivoire(23). The more recent possession score has been developed as a method that should be easier to use and give better discrimination of the disparities between the health of rich and poor(19). It was observed in the present study that the poverty index tended to categorise the rural population into the lower wealth quintiles and the urban population in the upper quintiles, whereas the possession score using ownership of specific Table 4 Mean Z-score for height-for-age (HAZ), weight-for-age (WAZ) and weight-for-height (WHZ) by poverty index, possession score and residency (urban/rural) among a nationally representative sample of 717 children aged 6–59 months, Coˆte d’Ivoire, 2007
Poverty index
Children Residency 1 2 3 4 5 Total P
HAZ Urban 20?85 21?51 21?73 21?31 20?91 21?25 0?003 Rural 21?71 21?84 21?93 21?76 21?10 21?79 NS Total sample 21?71 21?77 21?82 21?41 20?92 21?50 ,0?001 Sequential regression* 20?50 20?63 20?78 20?44 0- 0?003 Possession score 0 1 2 3 4 Total Urban 21?39 21?64 21?25 21?24 20?91 21?25 NS Rural 22?07 21?85 21?81 21?65 21?04 21?79 NS Total sample 21?89 21?77 21?55 21?34 20?95 21?50 ,0?001 Sequential regression* 20?77 20?69 20?51 20?42 0- 0?019 Poverty index 1 2 3 4 5 Total WAZ Urban 21?13 21?27 21?14 20?93 20?74 20?92 NS Rural 21?38 21?51 21?60 21?22 20?88 21?44 NS Total sample 21?38 21?46 21?37 20?99 20?74 21?16 ,0?001 Sequential regression* 20?32 20?46 20?47 20?19 0- NS Possession score 0 1 2 3 4 Total Urban 20?84 21?22 20?82 20?90 20?90 20?92 NS Rural 21?50 21?56 21?37 21?61 20?87 21?44 NS Total sample 21?32 21?43 21?11 21?07 20?89 21?16 NS Sequential regression* 20?22 20?39 20?11 20?22 0- NS Poverty index 1 2 3 4 5 Total WHZ Urban 21?03 20?16 20?24 20?33 20?37 20?32 NS Rural 20?42 20?54 20?56 20?36 20?36 20?48 NS Total sample 20?42 20?47 20?40 20?33 20?37 20?39 NS Sequential regression* 10?15 10?06 10?07 10?07 0- NS Possession score 0 1 2 3 4 Total Urban 10?16 20?21 20?24 20?29 20?85 20?32 0?045 Rural 20?28 20?68 20?44 20?74 20?16 20?48 NS Total sample 20?17 20?49 20?35 20?40 20?63 20?39 NS Sequential regression* 10?56 10?20 10?33 10?21 0- NS
Poverty index: 1 5 poorest; 5 5 wealthiest. Possession score: 0 5 no possessions; 4 5 four possessions.
*Sequential multiple regression analysis which removed the effects of residency before testing for either poverty index or possession score.
household items differentiated less well between urban and rural populations.
Increasing Hb concentration was significantly asso-ciated with an upward trend in the poverty index in all child groups (rural, urban and both groups combined) and in WRA in the rural and urban/rural combined group. There was an inverse relationship between anaemia and the poverty index in the urban/rural combined groups of women and children. Conversely, there were no sig-nificant associations between the possession score and Hb concentration in the women and only in the urban/
rural combined group of children. The prevalence of anaemia in the urban women was significantly associated with possession score but there was no consistent trend, and there were no relationships in the children.
The data, collected in Coˆte d’Ivoire as part of a nationally representative cross-sectional survey, provided clear evidence of very high levels of malnutrition in children, with almost 40 % of them being stunted, over a quarter underweight and almost 13 % of them being wasted. There were marked differences in nutritional status between those living in urban and rural areas, as Table 5 Prevalence of stunting (%; HAZ ,22), underweight (%; WAZ ,22) and wasting (%; WHZ ,22) by poverty index, possession score and residency (urban/rural) among a nationally representative sample of 717 children aged 6–59 months, Coˆte d’Ivoire, 2007
Poverty index
Group Residency 1 2 3 4 5 Total P
HAZ ,22 Urban 0 33?3 44?9 35?4 26?0 33?4 NS
Rural 48?6 52?5 42?7 40?0 12?5 46?6 NS
All children 48?1 48?8 43?8 36?4 25?3 39?5 ,0?001
Logistic regression* (OR) 2?36 2?49 2?14 1?65 1- 0?022
Possession score
0 1 2 3 4 Total
Urban 33?3 36?2 38?3 33?1 25?4 33?4 NS
Rural 61?5 53?4 44?0 29?6 26?9 46?6 ,0?001
Total sample 54?3 46?7 41?3 32?3 25?9 39?5 ,0?001
Logistic regression* (OR) 2?95 2?27 1?87 1?40 1- 0?004
Poverty index
1 2 3 4 5 Total
WAZ ,22 Urban 0 28?0 28?4 21?5 16?8 21?4 NS
Rural 32?4 36?9 44?3 28?6 25?0 36?0 NS
Total sample 32?1 35?2 36?3 22?9 17?2 28?1 ,0?001
Logistic regression* (OR) 1?37 1?72 2?14 1?31 1- NS
Possession score
0 1 2 3 4 Total
Urban 19?4 24?5 18?1 21?6 24?1 21?4 NS
Rural 38?6 36?8 34?7 40?0 22?2 36?0 NS
Total sample 33?3 32?0 27?0 26?0 23?5 28?1 NS
Logistic regression* (OR) 1?22 1?25 1?03 1?22 1- NS
Poverty index
1 2 3 4 5 Total
WHZ ,22 Urban 0 8?3 14?1 13?3 10?7 12?1 NS
Rural 13?8 14?7 13?2 14?3 0 13?6 NS
Total sample 13?6 13?5 13?6 13?5 10?1 12?8 NS
Logistic regression* (OR) 1?35 1?34 1?37 1?38 1- NS
Possession score
0 1 2 3 4 Total
Urban 7?1 10?4 11?4 10?5 21?8 12?1 NS
Rural 17?3 12?2 12?6 13?2 11?1 13?6 NS
Total sample 14?7 11?5 12?1 11?2 18?3 12?8 NS
Logistic regression* (OR) 0?73 0?56 0?60 0?57 1- NS
HAZ, height-for-age Z-score; WAZ, weight-for-age Z-score; WHZ, weight-for-height Z-score.
Poverty index: 1 5 poorest; 5 5 wealthiest. Possession score: 0 5 no possessions; 4 5 four possessions.
*Stepwise multinomial logistic regression which removed the effects of residency before testing for either poverty index or possession score.
rural children had significantly lower HAZ and WAZ (thus being more stunted and underweight) and tended to have lower WHZ (wasting) than urban children. In WRA, there was much less evidence of underweight, as only 7?4 % had a BMI , 18?5 kg/m2, but urban WRA had higher mean BMI and fewer were underweight compared with rural WRA.
The anthropometric variables revealed that in the total group of WRA there was a significant and strong upward trend in mean BMI from poorest to wealthiest quintiles using the poverty index; but the only relationship between possession score and BMI was observed in the total sample. Using the poverty index, there were significant differ-ences in child HAZ by quintile but it showed an inconsistent trend (quintile 3 was worse off than quintiles 1 and 2), which cannot be explained. The possession score showed a significant trend for mean HAZ in the total sample of children, with those with zero possessions having the worst mean. There were strong associations between stunting and both indices of SES in the total child sample. After adjusting for residency, children in house-holds having zero possessions were 2?95 (possession score) and 2?36 times (poverty index) more likely to be stunted compared with children in families having all four possessions or in the highest wealth quintile. Neither wasting nor underweight showed any association with the possession score, and there was a significant but inconsistent association with the poverty index in the urban stratum. The general lack of association between the SES indicators and WHZ and WAZ may be because these markers tend to indicate a shorter-term lack of food and/or poor-quality food or exposure to inflammation, which may depend on factors other than SES such as season or access (geographical availability). In general in Coˆte d’Ivoire, the poverty index tended to be more useful in predicting anthropometric indicators than the posses-sion score, which differs from a Bangladeshi study where the authors used data from the 2004 Demographic and Health Survey and found urban/rural differences were less marked and the possession score was a much better predictor of stunting, underweight and wasting than the poverty index(8).
Almost three-quarters of children aged 6–59 months and over 50 % of WRA were anaemic in the present study, but on average urban children and WRA had higher Hb concentration and less anaemia than their rural counter-parts. Magelha˜es and Clements(24) recently mapped the risk of anaemia in children of pre-school age in West Africa and showed that malnutrition, helminth infection and malaria are important contributors. The results from our study support these findings in showing a strong association between infection with P. falciparum and lower Hb concentration in children. Analyses that removed the effects of age, residency and presence of Plasmodium spp. found a very significant trend between increasing Hb concentration and increasing score on the poverty index in all child groups (rural, urban and total)
and in the total group in WRA. Conversely, there were no significant associations between the possession score and Hb concentration in the women and only in the total group of children.
The prevalence of anaemia in the urban stratum and total group of women, and in the total group of children, was significantly associated with the poverty index but there was no consistent trend. There were no relation-ships between the possession score and anaemia in the children and a significant relationship with no consistent trend only in the urban stratum of women. The results suggest that the poverty index was a better predictor of both Hb concentration and anaemia in these population groups in West Africa.
Conclusions
The current study has shown that there are high levels of undernutrition and anaemia in both pre-school children and WRA from Coˆte d’Ivoire. In both WRA and children, residency and the poverty index were good predictors of mean Hb concentration and anaemia; and children infected with P. falciparum had significantly lower Hb concentration than uninfected children. BMI was best predicted by residency and poverty index, while mean HAZ and stunting in children were strongly associated with residency and both possession score and poverty index. In this setting, the poverty index appeared more useful in predicting anaemia and anthropometric indica-tors, but at the price of more comprehensive data col-lection and more complicated statistical analyses.
Acknowledgements
Sources of funding: The Global Alliance for Improved Nutrition (GAIN), UNICEF, Helen Keller International (HKI), the Swiss Federal Institute of Technology (ETH Zurich), the Institut National de Sante´ Publique en Coˆte d’Ivoire (INSP), Map International, the Centre Suisse des Recherches Scientifiques and Unilever provided financial, technical or in-kind contributions to this study, a support that is gratefully acknowledged. Conflicts of interest: None of the authors have conflicts of interest to declare. Authors’ contributions: F.R., A.B.T., V.K.-G. and P.E.B. designed the study; F.R., A.B.T., V.K.-G. and P.E.B. con-ducted the research; F.R., A.B.T., C.N.-C. and C.G.N.M.-T. analysed the data; F.R., C.N.-C. and C.G.N.M.-T. wrote the first draft of the manuscript; all authors contributed to, read and approved the final manuscript.
References
1. Black RE, Allen LH, Bhutta ZA et al. (2008) Maternal and child undernutrition: global and regional exposures and health consequences. Lancet 371, 243–260.
2. McLean E, Cogswell M, Egli I et al. (2009) Worldwide prevalence of anaemia, WHO Vitamin and Mineral Nutri-tion InformaNutri-tion System, 1993–2005. Public Health Nutr 12, 444–454.
3. Allen LH (2000) Anemia and iron deficiency: effects on pregnancy outcome. Am J Clin Nutr 71, 5 Suppl, 1280S–1284S. 4. Crawley J (2004) Reducing the burden of anemia in infants and young children in malaria-endemic countries of Africa: from evidence to action. Am J Trop Med Hyg 71, 2 Suppl, 25–34. 5. Fotso J-C & Kuate-Defo B (2005) Measuring socioeconomic
status in health research in developing countries: should we be focusing on households, communities or both? Soc Indic Res 72, 189–237.
6. Pollack CE, Chideya S, Cubbin C et al. (2007) Should health studies measure wealth? A systematic review. Am J Prev Med 33, 250–264.
7. Houweling TA, Kunst AE & Mackenbach JP (2003) Measuring health inequality among children in developing countries: does the choice of the indicator of economic status matter? Int J Equity Health 2, 8.
8. Mohsena M, Mascie-Taylor CG & Goto R (2010) Association between socio-economic status and childhood undernutri-tion in Bangladesh; a comparison of possession score and poverty index. Public Health Nutr 13, 1498–1504. 9. Institut National de la Statistique, Ministe`re d’Etat &
Ministe`re du Plan et du De´veloppement (1998) Recense-ment ge´ne´ral de la population et de l’habitation – Coˆte d’Ivoire (CIV-INS-RGPH98-1998). Abidjan, Coˆte d’Ivoire: Institut National de la Statistique.
10. Ministe`re de la Sante´ et de la Population & UNICEF (2004) Enqueˆte Nutrition et Mortalite´ en Coˆte d’Ivoire, pp. 1–57. Abidjan, Coˆte d’Ivoire: Ministe`re de la Sante´ et de la Population.
11. Institut National de la Statistique & UNICEF (2006) Coˆte d’Ivoire, 2006 – Multiple Indicator Cluster Survey 3. http:// www.childinfo.org/mics3_surveys.html (accessed September 2010).
12. World Health Organization (2007) The EPI Coverage Survey – Training for Mid-Level Managers (WHO/IVB/08.07). Geneva: WHO.
13. Perry G, Byers T, Yip R et al. (1992) Iron nutrition does not account for the hemoglobin differences between blacks and whites. J Nutr 122, 1417–1423.
14. Johnson-Spear MA & Yip R (1994) Hemoglobin difference between black and white women with comparable iron status: justification for race-specific anemia criteria. Am J Clin Nutr 60, 117–121.
15. World Health Organization (1990) Diagnosis of Malaria. PAHO Scientific Publication no. 512. Geneva: WHO. 16. Cogill B (2003) Anthropometric Indicators Measurement
Guide. Washington, DC: Food and Nutrition Technical Assistance Project, Academy for Educational Development. 17. WHO Multicentre Growth Reference Study Group (2006) WHO Child Growth Standards based on length/height, weight and age. Acta Paediatr Suppl 450, 76–85.
18. Shetty PS & James WP (1994) Body mass index. A measure of chronic energy deficiency in adults. FAO Food Nutr Pap 56, 1–57.
19. United Nations Development Programme (2010) Human Development Report 2010. http://hdr.undp.org/en/reports/ global/hdr2010/chapters/ (accessed November 2011). 20. Tabachnick BG & Fidell LS (2007) Using Multivariate
Statistics. Boston, MA: Pearson/Allyn & Bacon.
21. Gwatkin DR, Rustein S, Johnson K et al. (2000) Socio-economic Differences in Health, Nutrition and Population in the Coˆte d’Ivoire. Washington, DC: HNP/Poverty Thematic Group, World Bank.
22. World Health Organization/UNICEF/United Nations Uni-versity (2001) Iron Deficiency Anaemia. Assessment, Prevention and Control. A Guide for Programme Man-agers. WHO/NHD/01.3. Geneva: WHO.
23. Gwatkin DR, Rutstein S, Johnson K et al. (2007) Socio-economic Differences in Health, Nutrition, and Population within Developing Countries – An Overview. Country Reports on HNP and Poverty. Washington, DC: The World Bank.
24. Soares Magalha˜es RJ & Clements ACA (2011) Mapping the risk of anaemia in preschool-age children: the contribution of malnutrition, malaria, and helminth infections in West Africa. PLoS Med 8, e1000438.