HAL Id: hal-00301043
https://hal.archives-ouvertes.fr/hal-00301043
Submitted on 10 Mar 2005HAL is a multi-disciplinary open access
archive for the deposit and dissemination of sci-entific research documents, whether they are pub-lished or not. The documents may come from teaching and research institutions in France or abroad, or from public or private research centers.
L’archive ouverte pluridisciplinaire HAL, est destinée au dépôt et à la diffusion de documents scientifiques de niveau recherche, publiés ou non, émanant des établissements d’enseignement et de recherche français ou étrangers, des laboratoires publics ou privés.
Black carbon ageing in the Canadian Centre for Climate
modelling and analysis atmospheric general circulation
model
B. Croft, U. Lohmann, K. von Salzen
To cite this version:
B. Croft, U. Lohmann, K. von Salzen. Black carbon ageing in the Canadian Centre for Climate modelling and analysis atmospheric general circulation model. Atmospheric Chemistry and Physics Discussions, European Geosciences Union, 2005, 5 (2), pp.1383-1419. �hal-00301043�
ACPD
5, 1383–1419, 2005 BC ageing in the CCCma AGCM B. Croft et al. Title Page Abstract Introduction Conclusions References Tables Figures J I J I Back Close Full Screen / EscPrint Version Interactive Discussion
EGU
Atmos. Chem. Phys. Discuss., 5, 1383–1419, 2005 www.atmos-chem-phys.org/acpd/5/1383/
SRef-ID: 1680-7375/acpd/2005-5-1383 European Geosciences Union
Atmospheric Chemistry and Physics Discussions
Black carbon ageing in the Canadian
Centre for Climate modelling and analysis
atmospheric general circulation model
B. Croft1, U. Lohmann2, and K. von Salzen3
1
Department of Physics and Atmospheric Science, Dalhousie University, Halifax, Canada
2
Institute of Atmospheric and Climate Science, ETH Zurich, Zurich, Switzerland
3
Canadian Centre for Climate modelling and analysis, Meteorological Service of Canada, Victoria, Canada
Received: 1 March 2005 – Accepted: 6 March 2005 – Published: 10 March 2005 Correspondence to: B. Croft (croft@mathstat.dal.ca)
ACPD
5, 1383–1419, 2005 BC ageing in the CCCma AGCM B. Croft et al. Title Page Abstract Introduction Conclusions References Tables Figures J I J I Back Close Full Screen / EscPrint Version Interactive Discussion
EGU
Abstract
Black carbon (BC) particles in the atmosphere have important impacts on climate. The amount of BC in the atmosphere must be carefully quantified to allow evaluation of the climate effects of this type of aerosol. In this study, we present the treatment of BC aerosol in the developmental version of the 4th generation Canadian Centre
5
for Climate modelling and analysis (CCCma) atmospheric general circulation model (AGCM). The focus of this work is on the conversion of insoluble BC to soluble/mixed BC. Four separate parameterizations of this ageing process are compared to a control simulation that assumes no ageing occurs. These simulations use 1) an exponential decay with a fixed 24 h half-life, 2) a condensation and coagulation scheme, 3) an
10
oxidative scheme, and 4) a linear combination of the latter two ageing treatments. Global BC burdens are 2.15, 0.15, 0.11, 0.21, and 0.11 Tg C for the control run, and four ageing schemes, respectively. The BC lifetimes are 98.1, 6.6, 5.0, 9.5, and 4.9 days, respectively. A computationally efficient parameterization that represents the processes of condensation, coagulation and oxidation is shown to simulate BC ageing
15
well in the CCCma AGCM. As opposed to the globally fixed ageing time scale, this treatment of BC ageing is responsive to varying atmospheric composition.
1. Introduction
Aerosol particles in the atmosphere, such as black carbon (BC), have a significant influence on global climate. These particles both scatter and absorb radiation, thus
20
impacting radiative transfer through the atmosphere (direct and semi-direct effects). Additionally, aerosols act as cloud condensation and ice nuclei, which influence cloud properties (indirect effects). The first indirect effect is based on the premise that for a given amount of cloud liquid water content, increased aerosol number implies more and smaller cloud droplets, and hence a more strongly reflective cloud. The second
25
ACPD
5, 1383–1419, 2005 BC ageing in the CCCma AGCM B. Croft et al. Title Page Abstract Introduction Conclusions References Tables Figures J I J I Back Close Full Screen / EscPrint Version Interactive Discussion
EGU
likely to precipitate (i.e. enhanced lifetime) due to a slower growth of the individual droplets. Black carbon aerosols have a role to play in all of these climate effects. For this reason, the concentration of BC aerosols must be accurately determined by atmospheric general circulation models (AGCMs).
Black carbon particles may exist in the atmosphere as either insoluble particles, or
5
in mixtures that are considered soluble. BC in a soluble mixture will be more efficiently removed by dry and wet deposition processes, and have a shorter atmospheric resi-dence time (Chylek et al.,1999;Hitzenberger et al.,2001;Zuberi et al.,2005). AGCMs must quantify the amount of BC that exists in the insoluble versus soluble state. For simplicity, many AGCMs assume that surface based sources are comprised of BC that
10
is 80% insoluble, and 20% soluble (Cooke et al., 1999;Lohmann et al.,1999;Koch,
2001;Chung and Seinfeld,2002). Following emission, BC is subject to atmospheric processes, which include oxidation, condensation and coagulation. These processes, termed the ageing processes, act to change the solubility of the BC aerosol. Param-eterization of the BC ageing processes in AGCMs is key to the determination of the
15
atmospheric abundance of this aerosol.
To date, many AGCMs have assumed that the conversion from insoluble to soluble BC follows an exponential decay process with a half-time of 24 h (Cooke et al.,1999;
Lohmann et al., 1999; Koch, 2001; Chung and Seinfeld, 2002). This approach has an obvious limitation since decay rate should vary depending on the physical process
20
that dominates the ageing. Coagulation should be enhanced in regions of greater to-tal aerosol number concentration. Additionally, regions with large fossil fuel burning emissions will have higher concentrations of sulphuric and nitric acid vapours available for condensation, as compared to regions dominated by open burning emissions. The relative importance of oxidative processes is not well quantified in a global sense.
How-25
ever, laboratory studies have shown oxidation to play a role in the BC ageing process (Zuberi et al.,2005;Decesari et al.,2002;P ¨oschl et al.,2001).
The focus of this study is to examine the relative impact of several parameterizations of the BC ageing process on the BC burdens, concentrations and lifetimes. To this
ACPD
5, 1383–1419, 2005 BC ageing in the CCCma AGCM B. Croft et al. Title Page Abstract Introduction Conclusions References Tables Figures J I J I Back Close Full Screen / EscPrint Version Interactive Discussion
EGU
end, four separate parameterizations are employed in the development version of the Canadian Centre for Climate modelling and analysis (CCCma) AGCM. These will be discussed in greater depth in the model description section. One parameterization is based on condensation and coagulation processes (Riemer et al.,2004a). This param-eterization was originally designed for use in regions dominated by fossil fuel burning.
5
A second parameterization is based exclusively on oxidation, following P ¨oschl et al.
(2001) and Tsigaridis and Kanakidou (2003). A third and novel parameterization as-sumes that the processes of oxidation, condensation, and coagulation may be treated in an additive manner. These three parameterizations are compared to the parameter-ization used by many AGCMs, which assumes a fixed e-folding time, and additionally
10
to a control simulation that assumes no ageing occurs.
An overview of the developmental version of the 4th generation CCCma AGCM, and the details of the various treatments for BC ageing are in Sect. 2. In Sect. 3, the modelled BC burdens, concentrations and lifetimes are presented. A comparison is made between the separate parameterizations, which shows the relative importance
15
of the physical processes involved in BC ageing. Section 4 shows comparisons with observed surface layer concentrations for several sites in both continentally influenced, and remote locations. Section 5 includes comparisons with previous modelling studies, and with another emission inventory. The sensitivity of the modelled BC burdens to the factor of two uncertainty in the emission inventories (Bond et al.,2004) is examined.
20
2. Model description
A developmental version of the fourth generation CCCma AGCM has been used for this study (von Salzen et al., 2005)1. The spectral transform method is used with triangular truncation at wave number 47 (T47) to represent the horizontal spatial structure of
1
von Salzen, K., McFarlane, N. A., and Lazare, M.: The role of shallow convection in the water and energy cycles of the atmosphere, Climate Dynamics, subm., 2005.
ACPD
5, 1383–1419, 2005 BC ageing in the CCCma AGCM B. Croft et al. Title Page Abstract Introduction Conclusions References Tables Figures J I J I Back Close Full Screen / EscPrint Version Interactive Discussion
EGU
temperature, specific humidity, surface pressure, vorticity, divergence, and the mass mixing ratios of cloud liquid and ice water and chemical tracers. The model equations are solved on 35 vertical levels using a hybrid pressure-sigma grid. Physical terms and nonlinear processes are evaluated on a horizontal grid at a resolution of 3.75×3.75◦. The time step used is 20 min.
5
An interactive sulphur cycle is included in the model (Lohmann et al., 1999; von
Salzen et al.,2000). Sulphate aerosol concentrations affect clear-sky radiative trans-fer directly and indirectly via the first and second indirect effect in stratiform clouds (Haywood and Boucher,2000;Lohmann and Feichter,1997). In the model, the tracer quantity that is transported is the transformed variable,
10 s= q0 [1+ p ln(q0/q)]1/p , if q < q0, q , if q ≥ q0,
where q is the physical variable (i.e. specific humidity, chemical tracer mixing ratios, and cloud liquid and ice water), and q0 and p are constants. This is a generaliza-tion of the hybrid variable transformageneraliza-tion proposed by Boer (1995). The use of this transformed variable alleviates to a considerable extent the undesirable overshoots
15
and undershoots that can occur when spectrally transporting rapidly varying functions (Merryfield and Holloway,2003). In particular, unphysical negative values and the un-desirable effects that accompany them are largely suppressed. Although the transport algorithm is conservative with respect to s, the physical variable q no longer is precisely conserved under transport. However, by judiciously choosing q0and p, the degree of
20
global non-conservation can be effectively controlled. Therefore, q0and p are assigned separately for each tracer according to a criterion that non-conservation errors do not exceed a certain threshold. The model also includes a method that locally corrects for any residual changes in global tracer masses which may be caused by transport of the hybrid variable. The AGCM also includes an updated version of the dust source flux
25
ACPD
5, 1383–1419, 2005 BC ageing in the CCCma AGCM B. Croft et al. Title Page Abstract Introduction Conclusions References Tables Figures J I J I Back Close Full Screen / EscPrint Version Interactive Discussion
EGU
parameter, dependence on wind friction speed rather than wind speed, and improved soil-moisture dependence.
2.1. Carbon aerosol simulation
The two prognostic variables for black carbon (BC) in the AGCM are the insoluble BC and the soluble/mixed BC mass mixing ratios. Black carbon emissions are from
5
Bond et al.(2004) for the fossil fuel and bio-fuel burning emissions, and from van der
Werf et al. (2003) for open burning, including large agricultural fires. These emission inventories are for the year 1996 and 2000, respectively. The annual BC emissions are 3.04, 1.63, and 3.32 Tg C/yr for fossil fuel, biofuel, and open burning, respectively. Figure 1 shows the global distribution of column BC emissions. The open burning
10
emissions are emitted into layers up to 6 km above the surface, whereas fossil fuel and biofuel are into layers up to 100 m. The distribution of these emissions into vertical layers is shown in the four panels of Fig.2.
The emissions are assumed to be 80% insoluble and 20% soluble/mixed. Com-pounds may become attached to the black carbon and undergo chemical processes.
15
This alters the solubility of the aerosol. These processes are termed ageing. Many models assume ageing to be an exponential decay process with a fixed half life close to 24 h (Cooke et al., 1999; Lohmann et al., 1999; Chung and Seinfeld,2002). The aerosols are removed from the atmosphere by the processes of wet and dry deposi-tion. The dry deposition flux is proportional to the BC concentration in the lowest model
20
layer and a dry deposition velocity. This is 0.025 cm/s over dry surfaces and 0.2 cm/s over wetted surfaces for the soluble/mixed BC, and 0.025 cm/s over all surfaces for the insoluble BC. The wet deposition is proportional to the precipitation rate (Feichter et al.,
1996;Lohmann et al.,1999).
In this study, several physically based treatments for BC ageing are examined using
25
the CCCma AGCM. Three physical processes that contribute to BC ageing include, coagulation with soluble aerosols, condensation of sulphuric and nitric acid gases onto the aerosol, and oxidation of compounds that have become attached to the BC aerosol.
ACPD
5, 1383–1419, 2005 BC ageing in the CCCma AGCM B. Croft et al. Title Page Abstract Introduction Conclusions References Tables Figures J I J I Back Close Full Screen / EscPrint Version Interactive Discussion
EGU
The condensation of volatile organic gases onto the BC aerosol is an additional process that is neglected in this study, but may well be of importance.
Using a mesoscale model,Riemer et al.(2004a) represented the processes of con-densation and coagulation over a region roughly the size of one AGCM grid box, but in more explicit detail than a AGCM permits. These authors find that in a region
domi-5
nated by significant fossil fuel burning emissions, the process of condensation is domi-nant during the day, and coagulation is domidomi-nant at night. The process of condensation is found to be very rapid. The e-folding time for the ageing process was found to be 8 h below 250 m, and above this and up to 2–3 km the e-folding time was 2 h. During the night time,Riemer et al.(2004a) found that the e-folding time, τ, in hours, may be
10
parameterized as a function of the internally mixed aerosol number concentration (Na),
τ= exp(−aNa+ b), (1)
where Nais less than 4100 cm−3and
τ= −c + dNa, (2)
where Na is more than 4100 cm−3. The constants, a, b, c, and d , are
15
2.3012×10⁻⁴ cm3, 4.4428, 3.8585 h, and 1.48×10⁵ h cm−3, respectively. Another form of this relation has been suggested
τ= a Na +
b Na2
(3)
(Riemer et al., 2004b), but was not used in this study. The constants, a and b, are 6×10⁴ h cm−3 and 3×10⁸ h cm−6, respectively. The zonal mean internally mixed
20
aerosol number concentration is shown in Fig. 3, for the FIX-LIFE simulation. Co-agulation is enhanced in regions of greater aerosol number following theRiemer et al.
(2004a) parameterization. The internally mixed aerosol is assumed to include all of the mass of sulphate, soluble/mixed BC and OC, and accumulation mode dust and
ACPD
5, 1383–1419, 2005 BC ageing in the CCCma AGCM B. Croft et al. Title Page Abstract Introduction Conclusions References Tables Figures J I J I Back Close Full Screen / EscPrint Version Interactive Discussion
EGU
sea salt. The conversion from mass mixing ratio to number concentration is made as-suming a log-normal size distribution with a mode radius of 0.069 µm, and standard deviation of 1.538 following Lesins and Lohmann (2005)2. TheRiemer et al.(2004a) parameterization is applied globally in the CCCma AGCM, and the results of these experiments are called COND-COAG.
5
Compounds may coat the BC aerosol, and then become oxidized (P ¨oschl et al.,
2001). A pseudo-first order decay rate coefficient for the rate of oxidation of the BC coating has been determined from laboratory studies byP ¨oschl et al. (2001). These authors find that the decay rate coefficient (k) is dependent on the number of available sites on the BC aerosol, and the sticking coefficients, residence times, and
concentra-10
tion of both ozone and water vapour molecules;
k= K∞kO3[O3] 1+ kO
3[O3]+ kH2O[H2O]
, (4)
where K∞ is the pseudo-first-order decay rate coefficient in the limit of high O3 (0.015 s−1) and kO
3 and kH2O are the adsorption rate coefficients of ozone and
wa-ter vapour, respectively. These are given by,
15
ki = So,iωi
4[SS]Sτi, (5)
where So,i is the sticking coefficient of O3 and H2O (3.3×10⁻³ and 0.4×10⁻³, respec-tively), ωiis the mean thermal velocity , [SS]S is the surface concentration of adsorption sites (5.7×1014cm−2), and τi is the mean residence time of O3and H2O on the surface sites (5 s and 3×10⁻³s, respectively). Water vapour acts to impede the oxidation by
20
ozone since these gases compete to occupy the available sites on the aerosol. The lifetime of the BC coating with respect to oxidation was found by these authors to be
2
Lesins, G. and Lohmann, U.: Using MODIS and AERONET to determine GCM aerosol size, J. Atmos. Sci., subm., 2005.
ACPD
5, 1383–1419, 2005 BC ageing in the CCCma AGCM B. Croft et al. Title Page Abstract Introduction Conclusions References Tables Figures J I J I Back Close Full Screen / EscPrint Version Interactive Discussion
EGU
in the order of 5 to 15 min for dry versus humid conditions. In poorly oxidizing envi-ronments, this lifetime will be longer. This parameterization is tested in the simulation called OXID.
Additionally, it is important to note that the rate of oxidation of a surface coating is not synonymous with the rate of production of a soluble aerosol particle. In particular,
5
the material to be oxidized is not likely to be distributed homogeneously over the BC aerosol. In reality, there are physical shielding effects that slow the rate of the age-ing. BC aerosols are not uniform spheres but have been observed to exhibit a chain structure that collapses to a clump like structure (Abel et al.,2003). Species that are deposited on the BC aerosol could be physically shielded from the oxidants by the
lay-10
ering of both themselves and the BC as suggested by P ¨oschl et al.(2001). There is little guidance to date on how to model the effects of physical shielding. As an initial approach, the reaction rate constant is scaled by a factor in the simulation OXID. The factor was introduced since simulations that did not include this factor, or where the factor was larger than 0.1, gave BC burdens that were clearly too low in comparison to
15
surface observations (results not shown). The sensitivity to this scaling factor is con-sidered in Sect. 3, and comparisons with surface observations are shown in Sect. 4.
To date, no AGCM studies have attempted to combine the processes of coagula-tion, condensation and oxidation. This will be the first study to do so with the sim-ulation COND-COAG-OXID. As a first step, it is assumed that these processes can
20
be combined in a linearly additive manner. This may under-estimate the ageing time scale since this assumes that the processes occur entirely independently, and do not compete with each other. Unfortunately, there is no laboratory evidence available to suggest how these processes interact.
3. Burdens, concentration and lifetimes
25
In total five primary simulations were conducted with the CCCma AGCM. All results shown are time averages from 3 year model runs following a 5 month spin up period
ACPD
5, 1383–1419, 2005 BC ageing in the CCCma AGCM B. Croft et al. Title Page Abstract Introduction Conclusions References Tables Figures J I J I Back Close Full Screen / EscPrint Version Interactive Discussion
EGU
using monthly mean climatological sea surface temperatures that are representative for the second half of the 20th century. The first simulation (NO-AGE) assumes no ageing i.e. there is no conversion from insoluble to soluble/mixed BC. This simulation serves to motivate the work, and demonstrates that it is important to represent the ageing process in a AGCM, but is a very unlikely scenario. The second simulation
5
(FIX-LIFE) assumes an exponential decay of the insoluble BC to the soluble/mixed state with a fixed half life of 24 h. The remaining simulations are COND-COAG, OXID and COND-COAG-OXID, as discussed in the previous section.
The global and annual mean BC burdens, lifetimes and deposition rates for the five simulations are shown in Table1. Geographical distributions of the burdens are shown
10
in Fig.4. The NO-AGE simulation gives a global and annual mean burden that is more than an order of magnitude higher than any of the other simulations. This suggests that the ageing parameterization is clearly important in an AGCM. This high burden is predicted because a higher percentage of the total BC resides in the insoluble state. Insoluble BC is less efficiently removed by the process of wet deposition, the primary
15
removal process. Note that wet and dry deposition account for roughly 75 and 25 percent of the total deposition, respectively, in all of the simulations except NO-AGE. Aside from NO-AGE, the simulations give burdens that are all within a factor of two of each other. The lifetime of BC is found to be on the order of one week. The exception is the NO-AGE simulation that has a lifetime close to three months. The BC ageing is
20
fastest in the COND-COAG and COND-COAG-OXID simulations, which assume that one very fast day-time ageing time-scale due to condensation of sulphuric and nitric acid applies globally. The impact of this assumption is investigated in the following subsection. The results of the COND-COAG and COND-COAG-OXID simulations are very similar, due to the small contribution of oxidation to the ageing process.
25
Figure5shows the zonal mean BC concentrations. The trends seen here are similar to those seen in the previous figure. The peak concentrations occur near the surface in the midlatitudes of the Northern Hemisphere due to fossil fuel burning. A secondary peak near the equator is associated with open and biofuel burning. In the OXID
sim-ACPD
5, 1383–1419, 2005 BC ageing in the CCCma AGCM B. Croft et al. Title Page Abstract Introduction Conclusions References Tables Figures J I J I Back Close Full Screen / EscPrint Version Interactive Discussion
EGU
ulation, the BC concentrations decay slower with height than in the other simulations, except for NO-AGE. This reflects the slower ageing due to oxidation. Concentrations decay faster with height in the COND-COAG-OXID simulation compared to the FIX-LIFE simulation. This difference will have a potentially significant impact on estimates indirect effect due to ice nucleation in the upper troposphere since in the FIX-LIFE
sim-5
ulation has considerably more BC mass to act as ice nuclei (Lohmann, 2002) in the upper troposphere.
Figure6shows the fraction of the total BC that resides in the soluble/mixed state for four of the simulations as determined by taking the ratio of column burdens. We can see that in the NO-AGE simulation less than 10% of the BC aerosol exists in a soluble
10
state. The 20% of BC emissions assumed to be soluble/mixed has been efficiently removed by the wet deposition processes. In all other simulations, over the oceans the percent in the soluble state is mostly over 90%. Over the continents, the transfer of BC to the soluble mixed state is much faster in the COND-COAG-OXID simulation as compared to the FIX-LIFE simulation. In the FIX-LIFE simulation, extensive continental
15
zones exist where only about 60% of the BC is in the soluble mixed state. Whereas in the COND-COAG-OXID simulation continental BC is generally in excess of 80% in the soluble mixed state. This will have implications on estimates of the semi-direct and indirect effect of the BC aerosols, since only the portion of BC in the soluble mixed state can act as cloud condensation nuclei.
20
3.1. Sensitivity to condensation and coagulation parameterization
This subsection examines the sensitivity of the BC burdens to the condensation and coagulation parameterizations. TheRiemer et al. (2004a) parameterization, used in the COND-COAG simulation, was originally developed for regions dominated fossil fuel burning. The question arises, how appropriate is the fast day-time e-folding time
25
in 1) remote regions away from BC emission sources, and 2) regions dominated by open and biofuel burning? The COND-COAG simulation may under-estimate burdens in these regions since there is less sulphuric acid available for condensation there.
ACPD
5, 1383–1419, 2005 BC ageing in the CCCma AGCM B. Croft et al. Title Page Abstract Introduction Conclusions References Tables Figures J I J I Back Close Full Screen / EscPrint Version Interactive Discussion
EGU
To give an upper bound on the BC burdens due to these concerns, two sensitivity simulations are conducted, MODR-COND-COAG and MODB-COND-COAG.
The MODR-COND-COAG simulation assumes no ageing due to condensation in re-mote regions, i.e. where the internally mixed aerosol number concentration is less than 300 cm−3 (Peng et al., 2002). Instead, the coagulation parameterization is applied
5
during the day-time, as well as during the night-time in these relatively cleaner and remote regions. In the non-remote regions, the day-time condensation parameteriza-tion remains unmodified. Note that the modelled number concentraparameteriza-tions are high in comparison to observations (Peng et al.,2002), since the choice of mode radius for the log-normal distribution is relatively low (seeHess et al.,1998). As a result, the BC
10
burden in the MODR-COND-COAG simulation may err towards being too low, since less regions fall into the remote category than if the modelled number concentrations were lower.
The MODB-COND-COAG is a similar sensitivity test applied to regions dominated by open and biofuel burning. In these regions, BC concentrations are high, but SO2
con-15
centrations are relatively much lower (Hobbs et al.,2003;Abel et al.,2003). Thus, rel-atively less sulphuric acid vapour should be available to contribute to the ageing. This simulation assumes no ageing due to condensation in regions exceeding a BC/SO2 ratio of 0.25. Instead, the coagulation parameterization is again applied during the day-time, as well as during the night-time. Outside these regions, the day-time
con-20
densation parameterization remains unmodified. Figure 7 shows that this threshold effectively separates the regions where biofuel and open burning dominate over fossil fuel burning. This simulation is likely to over-estimate the ageing time-scale since the process of condensation of volatile organic gases, as well as sulphuric acid conden-sation, is neglected. The BC burdens and deposition rates from these sensitivity tests
25
are shown in Table2.
The global and annual mean BC burdens from the MODR-COND-COAG and MODB-COND-COAG give the upper bounds on the BC burden estimates as compared to the COND-COAG simulation. Recent work (Abel et al.,2003) suggests that BC does age
ACPD
5, 1383–1419, 2005 BC ageing in the CCCma AGCM B. Croft et al. Title Page Abstract Introduction Conclusions References Tables Figures J I J I Back Close Full Screen / EscPrint Version Interactive Discussion
EGU
rapidly in the open burning zones, and so there is reason to believe that the COND-COAG simulation may, in fact, be closer to reality for these regions. Additionally, one may argue that in the remote regions, there is less sulphuric acid, but there is also less BC, and so the ageing time-scale developed for the more polluted regimes may still be appropriate. This further supports the idea that the COND-COAG simulation
5
maybe closer to reality than either of these two sensitivity tests. An additional sensitivity test was conducted to show the relative importance of the processes of coagulation on a global scale. This simulation (COAG) assumed that coagulation was the only process contributing to BC ageing over the entire diurnal cycle. The BC burdens and deposition rates from this sensitivity test are also shown in Table2. Both condensation
10
and coagulation are shown to contribute significantly to BC ageing. 3.2. Sensitivity to oxidation parameterization
The OXID simulation gave the slowest ageing but this is dependent on the scaling fac-tor (0.01) chosen in the parameterization to account for the physical shielding effects. To investigate the impact of this factor, two other values are chosen, 0.1 and 0.001.
15
Since this is the first study to use this factor, a wide range of values were selected. The resulting burdens are shown in Table3. There is a high sensitivity to this factor. Sim-ulations where the factor is set higher than 0.1 clearly under-estimated surface layer observations (not shown). This confirmed the hypothesis that the rate of oxidation can not be parameterized as being the same as the rate of ageing. Unfortunately, this
ne-20
cessitated the use of a corrective factor in the model. Further laboratory studies are needed to investigate how the rate of soot oxidation relates to the rate of production of a soluble aerosol (i.e. an aerosol that could act as a cloud condensation or ice nuclei). This will help to improve the uncertainty related to this scaling factor.
ACPD
5, 1383–1419, 2005 BC ageing in the CCCma AGCM B. Croft et al. Title Page Abstract Introduction Conclusions References Tables Figures J I J I Back Close Full Screen / EscPrint Version Interactive Discussion
EGU
4. Comparison with surface layer observations
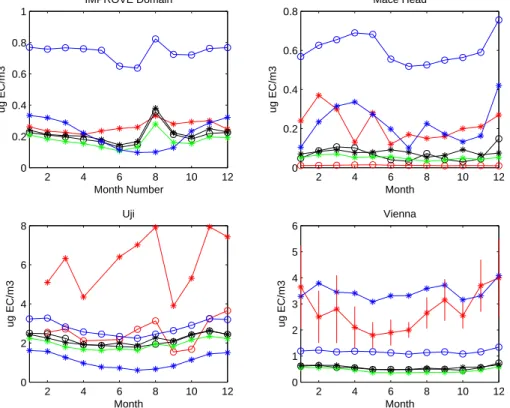
There is a limited availability of observations of monthly mean BC surface layer con-centrations for the complete annual cycle. Figure8 shows the modelled surface layer BC concentrations for the simulations NO-AGE, FIX-LIFE1, OXID, COND-COAG-OXID. These four simulations use theBond et al. (2004) and van der Werf et al.(2003) BC
5
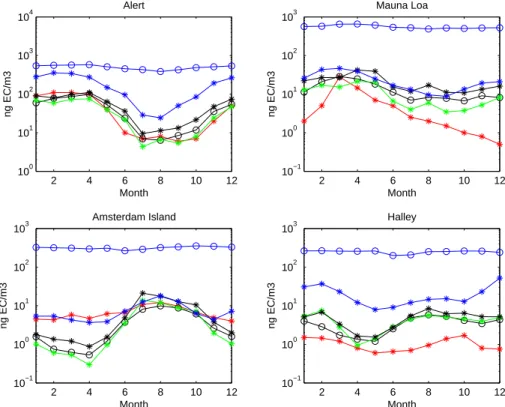
emission inventories. Figure9shows a comparison of observations with modelled re-sults for four continentally influenced sites. Figure10is similar but for four remote sites. The IMPROVE data was domain averaged over all sites participating in the IMPROVE project, and reporting BC concentrations between June 1998 and June 2002, to obtain the monthly means. AGCM results are also domain averaged over the corresponding
10
model grid boxes. Details regarding the other datasets can be found in the respective papers quoted with each figure. Note that there is a factor of two uncertainty in the emissions inventory used (Bond et al.,2004). The sensitivity to this uncertainty is fur-ther investigated in Sect. 5. However, also shown on Figs.9and10are the results of the simulation FIX-LIFE2, which uses the combinedPenner et al.(1993) andLiousse
15
et al. (1996) BC emission inventories, but includes the same BC conversion processes as the FIX-LIFE1 simulation. The simulations are for the most part within a factor of two of the observations, except for the NO-AGE simulation.
For the continentally influenced sites, there is a tendency for the model to under-estimate the observations. This is particularly evident for Uji, Japan and Vienna,
Aus-20
tria. Even the NO-AGE simulation is less than these observations. In part, this may occur since these observations are taken closer to an urban plume, and are not rep-resentative of the mean of the GCM grid box. Otherwise, the NO-AGE simulation over-estimates the surface concentrations. This points to the importance of the age-ing parameterization in AGCMs. For the remote sites, the over-estimation is greater,
25
one or two orders of magnitude. This is expected given the longer distance from the emission sources, and the greater time frame that ageing processes occurred.
ACPD
5, 1383–1419, 2005 BC ageing in the CCCma AGCM B. Croft et al. Title Page Abstract Introduction Conclusions References Tables Figures J I J I Back Close Full Screen / EscPrint Version Interactive Discussion
EGU
and the Alert site. Both datasets are means over a 3–4 year period and appropriate to the year of the emissions inventory. This improves the comparison. Additionally, the IMPROVE comparison has the benefit of a wider spatial coverage of observations, which will be more representative of the GCM grid box means. Also, there is likely less inter-annual variability in the North American fossil fuel dominated emissions compared
5
to the Southern Hemisphere emissions, which are dominated by open burning. For the Mace Head site, the observations are for the mid-1990s as opposed to the year of the emission inventory.
In many cases, the COND-COAG-OXID simulation gives BC concentrations slightly lower than the FIX-LIFE simulation, i.e. the ageing half life is predicted to be less than
10
24 h. The opposite is seen at the Antarctica site. Slower ageing is expected there since this region of the southern hemisphere has lower aerosol number concentrations, which slows the ageing process. The COND-COAG-OXID has the advantage over the FIX-LIFE simulation in that it captures these regionally varying effects.
In summary, one must exercise caution in drawing conclusions related to
compar-15
isons of AGCM surface layer concentrations with observations. Factors to consider include, 1) how representative are the observations, taken at one site, of the grid box mean, 2) is there significant variability in the concentrations on an inter-annual ba-sis that sensitizes the comparison to the year of the emissions scenario used by the model and 3) may the uncertainty in the emission scenario used vary considerably on
20
a regional basis. The best match of comparison conditions are likely for the IMPROVE domain and at Alert. Results here demonstrate that the ageing parameterizations work well as opposed to the assumption of no ageing.
5. Sensitivity to emissions
The BC emission inventory used in this study has roughly a factor of two uncertainty
25
(Bond et al.,2004). Table4shows the global and annual mean results from simulations where the emissions were both increased and decreased by a factor of two. There is
ACPD
5, 1383–1419, 2005 BC ageing in the CCCma AGCM B. Croft et al. Title Page Abstract Introduction Conclusions References Tables Figures J I J I Back Close Full Screen / EscPrint Version Interactive Discussion
EGU
a high sensitivity to this factor of two uncertainty in the emissions. This highlights the importance of ongoing work to prepare accurate emission inventories. One of the few studies published to date using this same emission inventory in a AGCM was the study was byStier et al.(2004). This study used an explicit representation of the processes of condensation and coagulation that was more computationally demanding than the
5
parameterizations presented here. These authors found a annual and global mean BC burden of 0.11 Tg C. This is the same as the result of the COND-COAG simulation of this study.
Another frequently used emission inventory combines the open burning emissions from Liousse et al. (1996) and the fossil fuel burning emissions from Penner et al.
10
(1993). This inventory is representative of the mid 1980’s, whereas the inventory used elsewhere in this study is representative of the latter 1990’s. The FIX-LIFE simula-tion has been repeated with this inventory and is shown as FIX-LIFE2. The burdens, lifetimes and deposition rates are shown in Table 5. One must be cautious not to conclude that global BC emissions have decreased as significantly as shown in the
15
Table5. Observations from the IMPROVE dataset do show a downward trend in BC surface concentrations, but the significant difference between these emission invento-ries may largely reflect uncertainties in the inventoinvento-ries themselves. A comparison of the geographic distribution of the BC burdens is shown in Fig.11. Over much of Eu-rope and Asia, BC burdens are higher by a factor of between 2 and 3 in the FIX-LIFE2
20
simulation. The FIX-LIFE1 simulation does have higher BC burdens in the southern portion of Africa. The inventory used in FIX-LIFE1 had higher open burning emissions in this region. Also shown in Table5is a comparison with other studies. These results show that the global BC burden has a high sensitivity to the inventory used. Indeed, the burdens are roughly proportional to the emissions in the global and annual mean.
25
Thus, a factor of two uncertainty in the emissions is expected to translate into a factor of two uncertainty in the predicted BC burdens.
ACPD
5, 1383–1419, 2005 BC ageing in the CCCma AGCM B. Croft et al. Title Page Abstract Introduction Conclusions References Tables Figures J I J I Back Close Full Screen / EscPrint Version Interactive Discussion
EGU
6. Conclusions
Four separate parameterizations of the BC ageing process, suitable for use in a AGCM, have been examined in this study. The assumption of no ageing was shown to be clearly unphysical, and significantly over-estimated the observed BC surface layer con-centrations. This occurred since a high percentage of the total BC mass remained in
5
the insoluble fraction. Thus, there was less efficient removal by wet deposition, which was shown to account for roughly 75% of the total deposition. A parameterization developed byRiemer et al.(2004a) to represent BC ageing by condensation and coag-ulation processes was tested for the first time in an AGCM. This parameterization rep-resented the BC ageing process reasonably on a global basis, despite being designed
10
in a domain dominated by fossil fuel burning. Results from this simulation suggested that the global and annual mean half-life for the conversion of insoluble BC to soluble BC is less than the 24 h. For the first time, a parameterization that included processes of condensation, coagulation and oxidation was developed and used in AGCM. The contribution of oxidation to the BC ageing process was shown to be small. However,
15
there remains a high level of uncertainty associated with the oxidative parameteriza-tion. On a global scale, condensation and coagulation were shown to contribute sig-nificantly to BC ageing. The assumption of an exponential decay of insoluble BC to the soluble/mixed state with a fixed 24 h half life was shown to represent BC burdens reasonably. However, this approach has the disadvantage in that it is not responsive to
20
varying regional conditions. BC burdens were 2.15, 0.15, 0.11, 0.21, and 0.11 Tg C, for the simulations, assuming 1) no ageing, 2) a fixed half life of 24 h, 3) ageing by con-densation and coagulation, 4) ageing by oxidation and 5) ageing by all three physical processes combined, respectively. For the same simulations respectively, BC lifetimes were 98.1, 6.6, 5.0, 9.5, and 4.9 days. The sensitivity of modelled BC burdens and
25
concentrations to the factor of two uncertainty in emissions inventories was shown to be greater than sensitivity to the parameterization used to represent BC ageing, except for the oxidation based parameterization.
ACPD
5, 1383–1419, 2005 BC ageing in the CCCma AGCM B. Croft et al. Title Page Abstract Introduction Conclusions References Tables Figures J I J I Back Close Full Screen / EscPrint Version Interactive Discussion
EGU
The BC ageing time scale is likely to change with future changes in atmospheric composition. A physically based BC ageing treatment will allow the AGCM to better respond to changes in oxidants and pollutants, as opposed to use of a fixed e-folding time. Future work is needed to study the impact of changes in the atmospheric com-position on the ageing time scale and the effect that this will have on global BC
bur-5
dens. As well, efforts must continue to better quantify global BC emissions. Aerosols are a relatively short-lived atmospheric constituent, and thus emissions strongly in-fluence atmospheric burdens. Finally, further laboratory experiments are needed to better understand the mechanisms by which the processes of oxidation, coagulation, and condensation (not only of inorganic acids but also of volatile organic gases)
inter-10
act and convert insoluble BC particles into particles can act as cloud condensation or ice nuclei. Ultimately, this will help to resolve one of the major uncertainties in climate research, the role of cloud-aerosol interactions.
Acknowledgements. The authors thank N. Riemer for helpful discussions. This work was
sup-ported by the National Science and Engineering Research Council of Canada, and the
Cana-15
dian Foundation for Climate and Atmospheric Science collaborative research grants.
References
Abel, S. J., Haywood, J. M., Highwood, E. J., Li, J., and Buseck, P. R.: Evolution of biomass burning aerosol properties from an agricultural fire in southern Africa, Geophys. Res. Lett., 30, doi:10.1029/2003GL017342, 2003. 1391,1394
20
Bodhaine, B. A.: Aerosol absorption measurements at Barrow, Mauna Loa and the South-Pole, J. Geophys. Res., 100, 8967–8975, 1995. 1418
Boer, G. J.: Analyzed and forecast large-scale tropical divergent flow, Mon. Wea. Rev., 123, 3539–3553, 1995. 1387
Bond, T. C., Streets, D. G., Yarber, K. F., Nelson, S. M., Woo, J.-H., and Klimont, Z.: A
25
technology-based global inventory of black and organic carbon emissions from combustion, J. Geophys. Res., 109, D14 203, doi:10.1029/2003JDO03697, 2004. 1386, 1388, 1396,
ACPD
5, 1383–1419, 2005 BC ageing in the CCCma AGCM B. Croft et al. Title Page Abstract Introduction Conclusions References Tables Figures J I J I Back Close Full Screen / EscPrint Version Interactive Discussion
EGU
Chung, S. H. and Seinfeld, J. H.: Global distribution and climate forcing of carbonaceous aerosols, J. Geophys. Res., 107, D194 407, doi:10.1029/2001JD001397, 2002. 1385,1388
Chylek, P., Kou, L., Johnson, B., Boudala, F., and G.Lesins: Black carbon concentrations in precipitation and near surface air in and near Halifax, Nova Scotia, Atmos. Environ., 33,
5
2269–2277, 1999. 1385
Cooke, W. F., Jennings, S. G., and Spain, T. G.: Black carbon measurements at Mace Head, 1989-1996, J. Geophys. Res., 102, 25 339–25 346, 1997. 1417
Cooke, W. F., Liousse, C., Cachier, H., and Feichter, J.: Construction of a 1×1 fossil fuel emission data set for carbonaceous aerosol and implementation and radiative impact in the
10
ECHAM4 model, J. Geophys. Res., 104, 22 137–22 162, 1999. 1385,1388
Decesari, S., Facchini, M. C., Matta, E., Mircea, M., Fuzzi, S., Chughtai, A. R., and Smith, D. M.: Water soluble organic compounds formed by oxidation of soot, Atmos. Environ., 36, 1827–1832, 2002. 1385
Feichter, J., Kjellstr ¨om, E., Rodhe, H., Dentener, F., Lelieveld, J., and Roelofs, G.-J.: Simulation
15
of the tropospheric sulfur cycle in a global climate model, Atmos. Environ., 30, 1693–1707, 1996. 1388
Haywood, J. and Boucher, O.: Estimates of the direct and indirect radiative forcing due to tropospheric aerosols: A review, J. Geophys. Res., 38, doi:10.1029/1999RG000078, 2000.
1387
20
Hess, M., Koepke, P., and Schult, I.: Optical properties of aerosols and clouds: The software package OPAC, Bull. Am. Meterol. Soc., 79, 831–844, 1998. 1394
Hitzenberger, R., Berner, A., Giebl, H., Drobesch, K., Kasper-Giebl, A., Loeflund, M., Urban, H., and Puxbaum, H.: Black carbon (BC) in alpine aerosols and cloud water – concentrations and scavenging efficiencies, Atmos. Environ., 35, 5135–5141, 2001. 1385
25
Hobbs, P. V., Sinha, P., Yokelson, R. J., Christian, T. J., Blake, D. R., Gao, S., Kirchstetter, T. W., Novakov, T., and Pilewskie, P.: Evolution of gases and particles from a savanna fire in South Africa, J. Geophys. Res., 108, doi:10.1029/2003GL017342, 2003. 1394
H ¨oller, R., Tohno, S., Kasahara, M., and Hitzenberger, R.: Long-term characterization of car-bonaceous aerosol in Uji, Japan, Atmos. Environ., 36, 1267–1275, 2002. 1417
30
Koch, D.: Transport and direct radiative forcing of carbonaceous and sulfate aerosols in the GISS GCM, J. Geophys. Res., 106, 20 311–20 332, 2001. 1385
Liousse, C., Penner, J. E., Chung, C., Walton, J. J., Eddleman, H., and Cachier, H.: a global three-dimensional model study of carbonaceous aerosols, J. Geophys. Res., 101, 19 411–
ACPD
5, 1383–1419, 2005 BC ageing in the CCCma AGCM B. Croft et al. Title Page Abstract Introduction Conclusions References Tables Figures J I J I Back Close Full Screen / EscPrint Version Interactive Discussion
EGU
19 432, 1996. 1396,1398,1408,1419
Lohmann, U.: A glaciation indirect effect caused by soot aerosols, Geophys. Res. Lett., 29, doi:10.1029/2001GL014357, 2002. 1393
Lohmann, U. and Feichter, J.: Impact of sulfate aerosols on albedo and lifetime of clouds: A
5
sensitivity study with the ECHAM4 GCM, J. Geophys. Res., 102, 13 685–13 700, 1997. 1387
Lohmann, U., Feichter, J., Chuang, C. C., and Penner, J. E.: Prediction of the number of cloud droplets in the ECHAM GCM, J. Geophys. Res., 104, 9169–9198, 1999. 1385,1387,1388
Merryfield, W. J. and Holloway, G.: Application of an accurate advection algorithm to sea-ice modelling, Ocean Modelling, 5, 1–15, 2003. 1387
10
Peng, Y., Lohmann, U., Leaitch, R., Banic, C., and Couture, M.: The cloud albedo-cloud droplet effective radius relationship for clean and polluted clouds from RACE and FIRE.ACE, J. Geo-phys. Res., 107, doi:10.1029/2000JD000281, 2002. 1394
Penner, J. E., Eddleman, H., and Novakov, T.: Towards the development of a global inventory for black carbon emissions, Atmos. Environ., 27A, 1277–1295, 1993. 1396, 1398, 1408,
15
1419
P ¨oschl, U., Letzel, T., Schauer, C., and Niessner, R.: Interaction of ozone and water vapor with spark discharge soot aerosol particles coated with benzo[a]pyrene: O3and H2O Adsorption, Benzo[a]pyrene degradation, and Atmospheric implications, J. Phys. Chem., 105, 4029– 4041, 2001. 1385,1386,1390,1391
20
Puxbaum, H., Gomiscek, B., Kalina, M., Salam, A., Stopper, S., Preining, O., and Hauck, H.: A dual study PM2.5and PM10aerosol chemistry in the larger region of Vienna, Austria, Atmos. Environ., 38, 3949–3958, 2004. 1417
Reader, M. C., Fung, I., and McFarlane, N.: The mineral dust aerosol cycle during the Last Glacial Maximum, J. Geophys. Res., 104,, D8, 9381–9398, 1999. 1387
25
Riemer, N., Vogel, H., and B.Vogel: A parameterization of the soot aging for global climate models, Atmos. Chem. Phys. Discuss., 4, 2089–2115, 2004a,
SRef-ID: 1680-7375/acpd/2004-4-2089. 1386,1389,1390,1393,1399
Riemer, N., Vogel, H., and Vogel, B.: Soot aging time scales in polluted regions during day and night, Atmos. Chem. Phys., 4, 1885–1893, 2004b,
30
SRef-ID: 1680-7324/acp/2004-4-1885. 1389
Sharma, S., Lavoue, D., Cachier, H., Barrie, L., and Gong, S. L.: Long-term trends of the black carbon concentrations in the Canadian arctic, J. Geophys. Res., 109, D15 203, doi:10.1029/2003JD004331, 2004. 1418
ACPD
5, 1383–1419, 2005 BC ageing in the CCCma AGCM B. Croft et al. Title Page Abstract Introduction Conclusions References Tables Figures J I J I Back Close Full Screen / EscPrint Version Interactive Discussion
EGU
Stier, P., Feichter, J., Kloster, S., Vignati, E., Wilson, J., Ganzeveld, L., Tegen, I., Werner, M., Balkanski, Y., Schult, M., and Boucher, O.: The aerosol-climate model ECHAM5-HAM, Atmos. Chem. Phys. Discuss., 4, 5551–5623, 2004,
SRef-ID: 1680-7375/acpd/2004-4-5551. 1398
5
Tsigaridis, K. and Kanakidou, M.: Global modelling of secondary organic aerosol in the tropo-sphere: A sensitivity analysis, Atmos. Chem. Phys. Discuss., 3, 2879–2929, 2003,
SRef-ID: 1680-7375/acpd/2003-3-2879. 1386
van der Werf, G. R., Randerson, J. T., Collatz, G. J., and Giglio, L.: Carbon emissions from fires in tropical and subtropical ecosystems, Global Change Biology, 9, 547–562, 2003. 1388,
10
1396,1408,1409,1410,1419
von Salzen, K., Leighton, H. G., Ariya, P. A., Barrie, L. A., Gong, S. L., Blanchet, J.-P., Spacek, L., Lohmann, U., and Kleinman, L. I.: Sensitivity of sulfate aerosol size distributions and CCN concentrations over North America to SOxemissions and H2O2concentrations, J. Geophys. Res., 105, 9741–9765, 2000. 1387
15
Wolff, E. W. and Cachier, H.: Concentrations and seasonal cycle of black carbon in aerosol at
535
a coastal Antarctic station, J. Geophys. Res., 103, 11 033–11 041, 1998. 1418
Zuberi, B., Johnson, K. S., Aleks, G. K., Molina, L. T., and Molina, M. J.: Hydrophylic properties of aged soot, Geophys. Res. Lett., 32, L01 807, doi:10.1029/2004GL021496, 2005. 1385
ACPD
5, 1383–1419, 2005 BC ageing in the CCCma AGCM B. Croft et al. Title Page Abstract Introduction Conclusions References Tables Figures J I J I Back Close Full Screen / EscPrint Version Interactive Discussion
EGU Table 1. Global and annual mean black carbon burdens, lifetimes, and deposition rates.
NO-AGE FIX-LIFE
COND-COAG OXID COND- COAG-OXID Emission (Tg C/yr) 8.01 8.01 8.01 8.01 8.01 Burden (Tg C) 2.153 0.145 0.109 0.209 0.108 Lifetime (days) 98.1 6.6 5.0 9.5 4.9
Wet dep (Tg C/yr) 5.07 6.09 5.99 6.00 5.98
ACPD
5, 1383–1419, 2005 BC ageing in the CCCma AGCM B. Croft et al. Title Page Abstract Introduction Conclusions References Tables Figures J I J I Back Close Full Screen / EscPrint Version Interactive Discussion
EGU Table 2. Global and annual mean BC burdens, lifetimes and deposition rates from the sensitivity
studies related to the condensation and coagulation parameterization. COND-COAG MODR- COND-COAG MODB- COND-COAG COAG Emission (Tg C/yr) 8.01 8.01 8.01 8.01 Burden (Tg C) 0.109 0.113 0.140 0.171 Lifetime (days) 5.0 5.1 6.4 7.8
Wet dep (Tg C/yr) 5.99 5.96 5.96 5.99
ACPD
5, 1383–1419, 2005 BC ageing in the CCCma AGCM B. Croft et al. Title Page Abstract Introduction Conclusions References Tables Figures J I J I Back Close Full Screen / EscPrint Version Interactive Discussion
EGU Table 3. Global and annual mean BC burdens, lifetimes and deposition rates from the sensitivity
studies related to the oxidation parameterization.
OXID(0.001) OXID(0.01) OXID(0.1)
Emission (Tg C/yr) 8.01 8.01 8.01
Burden (Tg C) 0.483 0.209 0.106
Lifetime (days) 22.0 9.5 4.8
Wet dep (Tg C/yr) 5.75 6.00 6.00
ACPD
5, 1383–1419, 2005 BC ageing in the CCCma AGCM B. Croft et al. Title Page Abstract Introduction Conclusions References Tables Figures J I J I Back Close Full Screen / EscPrint Version Interactive Discussion
EGU Table 4. Global and annual mean BC burdens, lifetimes and deposition rates from the sensitivity
studies related to emissions. Emissions are scaled by factors shown in table. All results shown are for the FIX-LIFE simulation.
0.5 x EMISS 1.0 x EMISS 2.0 x EMISS
Emission (Tg C/yr) 4.00 8.01 16.02
Burden (Tg C) 0.071 0.145 0.317
Lifetime ( days) 6.5 6.6 7.2
Wet dep (Tg C/yr) 2.98 6.09 12.29
ACPD
5, 1383–1419, 2005 BC ageing in the CCCma AGCM B. Croft et al. Title Page Abstract Introduction Conclusions References Tables Figures J I J I Back Close Full Screen / EscPrint Version Interactive Discussion
EGU
Table 5. Simulations with different emissions inventories and comparison with previous studies.
FIX-LIFE1 and FIX-LIFE2 simulations are both with the CCCma AGCM but use the combined
Bond et al.(2004)–van der Werf et al.(2003) andLiousse et al.(1996)–Penner et al.(1993) inventories, respectively. FIX-LIFE1 FIX-LIFE2 Lohmann et al. (1999) Koch (2001) Chung and Seinfeld (2002) Stier et al. (2004) Emissions (Tg C/yr) 8.01 13.1 11.7 12.4 12.0 7.7 Burdens (Tg C) 0.15 0.23 0.26 0.15 0.22 0.11 Lifetimes (days) 6.6 6.5 8.1 4.4 6.4 5.4
ACPD
5, 1383–1419, 2005 BC ageing in the CCCma AGCM B. Croft et al. Title Page Abstract Introduction Conclusions References Tables Figures J I J I Back Close Full Screen / EscPrint Version Interactive Discussion
EGU
Fig. 1. Log10 of annual mean column black carbon emissions (kg C/m2/s) fromBond et al.
ACPD
5, 1383–1419, 2005 BC ageing in the CCCma AGCM B. Croft et al. Title Page Abstract Introduction Conclusions References Tables Figures J I J I Back Close Full Screen / EscPrint Version Interactive Discussion
EGU
Fig. 2. Log10 of annual mean black carbon emissions (kg C/m2/s) into layers from surface to
100 m, 100–500 m, 500–1000 m, and 1000–2000 m fromBond et al.(2004) for fossil fuel and bio-fuel burning, and fromvan der Werf et al.(2003) for open burning.
ACPD
5, 1383–1419, 2005 BC ageing in the CCCma AGCM B. Croft et al. Title Page Abstract Introduction Conclusions References Tables Figures J I J I Back Close Full Screen / EscPrint Version Interactive Discussion
EGU
Fig. 3. Zonal and annual mean internally mixed aerosol number concentration (number cm−3).
ACPD
5, 1383–1419, 2005 BC ageing in the CCCma AGCM B. Croft et al. Title Page Abstract Introduction Conclusions References Tables Figures J I J I Back Close Full Screen / EscPrint Version Interactive Discussion
EGU
Fig. 4. Annual mean black carbon burdens (mg C/m2) from the five primary simulations. Same
ACPD
5, 1383–1419, 2005 BC ageing in the CCCma AGCM B. Croft et al. Title Page Abstract Introduction Conclusions References Tables Figures J I J I Back Close Full Screen / EscPrint Version Interactive Discussion
EGU
Fig. 5. Zonal and annual mean BC concentrations (ng/m3) from four of the simulations. Vertical
ACPD
5, 1383–1419, 2005 BC ageing in the CCCma AGCM B. Croft et al. Title Page Abstract Introduction Conclusions References Tables Figures J I J I Back Close Full Screen / EscPrint Version Interactive Discussion
EGU Fig. 6. Annual mean percent of BC existing in the soluble/mixed state as determined by the
ACPD
5, 1383–1419, 2005 BC ageing in the CCCma AGCM B. Croft et al. Title Page Abstract Introduction Conclusions References Tables Figures J I J I Back Close Full Screen / EscPrint Version Interactive Discussion
EGU
Fig. 7. Annual mean surface layer BC and SO2mass mixing ratios from the FIX-LIFE simulation
ACPD
5, 1383–1419, 2005 BC ageing in the CCCma AGCM B. Croft et al. Title Page Abstract Introduction Conclusions References Tables Figures J I J I Back Close Full Screen / EscPrint Version Interactive Discussion
EGU
ACPD
5, 1383–1419, 2005 BC ageing in the CCCma AGCM B. Croft et al. Title Page Abstract Introduction Conclusions References Tables Figures J I J I Back Close Full Screen / EscPrint Version Interactive Discussion EGU 2 4 6 8 10 12 0 0.2 0.4 0.6 0.8 1 Month Number ug EC/m3 IMPROVE Domain 2 4 6 8 10 12 0 2 4 6 8 ug EC/m3 Month Uji 2 4 6 8 10 12 0 1 2 3 4 5 6 ug EC/m3 Month Vienna 2 4 6 8 10 12 0 0.2 0.4 0.6 0.8 ug EC/m3 Month Mace Head
Fig. 9. Continentally influenced monthly mean surface layer BC concentrations from U.S.A.
IM-PROVE domain average from 1998–2002, Mace Head, Ireland (Cooke et al.,1997), Uji, Japan (H ¨oller et al.,2002), and Vienna-Streithofen, Austria (Puxbaum et al.,2004). Observations are in red. For Uji, open circles are data prior to correction for small particle mass. For Mace Head, the asterisks and circles are for continental and clean air masses,respectively. Simula-tion NO-AGE is shown in blue circles, FIX-LIFE in black circles, OXID in black with asterisks and COND-COAG-OXID in green asterisks. FIX-LIFE2 is in blue asterisks.
ACPD
5, 1383–1419, 2005 BC ageing in the CCCma AGCM B. Croft et al. Title Page Abstract Introduction Conclusions References Tables Figures J I J I Back Close Full Screen / EscPrint Version Interactive Discussion EGU 2 4 6 8 10 12 100 101 102 103 104 ng EC/m3 Month Alert 2 4 6 8 10 12 10−1 100 101 102 103 ng EC/m3 Month Amsterdam Island 2 4 6 8 10 12 10−1 100 101 102 103 ng EC/m3 Month Halley 2 4 6 8 10 12 10−1 100 101 102 103 ng EC/m3 Month Mauna Loa
Fig. 10. Remote site monthly mean surface layer BC concentrations at Alert averaged over
period 1999–2001 (Sharma et al., 2004), Mauna Loa (Bodhaine, 1995), Amsterdam Island (Wolff and Cachier, 1998), and Halley (Wolff and Cachier, 1998). Observations are in red. Simulation NO-AGE is shown in blue circles, FIX-LIFE in black circles, OXID in black with asterisks and COND-COAG-OXID in green asterisks. FIX-LIFE2 is in blue asterisks.
ACPD
5, 1383–1419, 2005 BC ageing in the CCCma AGCM B. Croft et al. Title Page Abstract Introduction Conclusions References Tables Figures J I J I Back Close Full Screen / EscPrint Version Interactive Discussion
EGU
Fig. 11. Annual mean black carbon burdens (mg C/m2) from simulations with a fixed 24 h
ageing half life, and using different inventories. Simulation FIX-LIFE1 uses the Bond et al.
(2004) andvan der Werf et al.(2003) inventories and FIX-LIFE2 uses thePenner et al.(1993) andLiousse et al.(1996) inventories.