A Data-Driven Approach to Mitigate Risk in
Global Food Supply Chains
by
MASSAmine Anoun
M.Eng., Ecole Centrale Paris (2015)
Submitted to the Sloan School of Management
in partial fulfillment of the requirements for the degree of
Master of Science in Operations Research
at the
MASSACHUSETTS INSTITUTE OF TECHNOLOGY
AHU S ISTITUTE OF TECHNOLOGY
JUN 2
6
2017
LIBRARIES
ARCHIVES
June 2017
@
Massachusetts Institute of Technology 2017. All rights reserved.
A uthor ...
C ertified by ...
Signature redacted
Sloan School of Management
May 19, 2017
Signature redacted...
V
Tauhid Zaman
KDD Career Development Professor in Communications and
Technology, Assistant Professor of Operations Management
Signature redacted
Certified by...
Thesis Supervisor
Retsef Levi
J. Spencer Standish (1945) Professor of Management, Professor of
Operations Management
Signature redacted
Thesis Supervisor
A ccepted by ...
...
Dimitris Bertsimas
Boeing Professor of Operations Research, Co-Director, Operations
Research Center
A Data-Driven Approach to Mitigate Risk in Global Food
Supply Chains
by
Amine Anoun
Submitted to the Sloan School of Management on May 19, 2017, in partial fulfillment of the
requirements for the degree of Master of Science in Operations Research
Abstract
Economically motivated adulteration of imported food poses a serious threat to pub-lic health, and has contributed to several poisoning incidents in the past few years in the U.S. [1]. Prevention is achieved by sampling food shipments coming to the
U.S. However, the sampling resources are limited: all shipments are electronically
sampled [2], but only a small percentage of shipments are physically inspected. In an effort to mitigate risk in shipping supply chains, we develop a data-driven approach to identify risky shippers and manufacturers exporting food to the U.S., as well as
U.S. based consignees and importers receiving imported products. We focus our
anal-ysis on honey and shrimp, two products that are routinely imported and frequently adulterated.
We obtain over 62,000 bills of lading of honey entering the U.S. between 2006 and 2015 from public sources, and over a million shipment records of shrimp entering the U.S. between 2007 and 2015 from the Food and Drugs Administration (FDA). We analyze these data to identify common patterns between high risk shippers, man-ufacturers, U.S. consignees and importers, and use them to determine structural features of shipping supply chains that correlate with risk of adulteration. In our analysis of shrimp manufacturers, we distinguish two types of adulteration: inten-tional (driven by economic motivation) and uninteninten-tional (due to negligence or poor sanitary conditions). We use a Bayesian approach to model both the sampling or inspection procedure of the FDA, and the risk of adulteration. Our model is able to predict which companies are at risk of committing adulteration with high out-of-sample accuracy. We find that both geographical features (e.g., travel route, country of origin and transnational paths) and network features (e.g., number of partners, weight dispersion and diversity of the product portfolio) are significant and predic-tive of suspicious behavior. These outcomes can inform various decisions faced by the FDA in their sampling policy for honey and shrimp shipments, and their site inspection policy for consignees and importers. This work can also extend to other commodities with similar mechanisms, and provides a general framework to better
detect food safety failures and mitigate risk in food supply chains.
Thesis Supervisor: Tauhid Zaman
Title: KDD Career Development Professor in Communications and Technology, As-sistant Professor of Operations Management
Thesis Supervisor: Retsef Levi
Title: J. Spencer Standish (1945) Professor of Management, Professor of Operations Management
Acknowledgments
First and foremost, I would like to express my sincere gratitude to my advisors, Prof. Tauhid Zaman and Prof. Retsef Levi for their help, guidance and support. Their expertise has contributed greatly to this thesis, and I would not have come this far without their constant encouragement. Tauhid and Retsef have been exceptional role models for me. Working with them during my years at MIT has helped me grow both professionally and personally.
I also feel very fortunate to have worked closely with Prof. Vivek Farias as a
teaching assistant for the 15.778 course. He is a truly amazing teacher and inspiring researcher.
I would also like to thank Prof. Dimitris Bertsimas for his guidance, availability and support. I am also very grateful to Laura Rose and Andrew Carvalho for their administrative assistance.
I also want to acknowledge the sponsors of my research work, the Food and Drugs
Administration (FDA). This project has been a tremendous learning experience and an enjoyable journey.
Many thanks go to my friends at the ORC who have made my years at MIT unfor-gettable, and made the ORC a home-like atmosphere. I'm so fortunate to have met you and I look forward to many years of friendship. I am also grateful to my friends
outside of the ORC and back home for their constant support and encouragement. Finally, I owe my deepest gratitude to my parents and sister for their love and support. I owe them everything, and I dedicate this work to them.
Contents
1 Introduction 21
1.1 Background and Motivation . . . . 21
1.2 Thesis Outline. . . . . 23
1.2.1 D ata . . . . 24
1.2.2 Supply Chain Features . . . . 25
1.2.3 Model . . . . 26
1.2.4 Estimation Results . . . . 27
2 Data 29 2.1 Introduction . . . . 29
2.2 Supply Chain Data . . . . 29
2.2.1 Import Genius. . . . . 30
2.2.2 Shrimp Supply Chain Data . . . . 31
2.2.3 Honey Supply Chain Data . . . . 35
2.3 Labeling Data . . . . 36
2.3.1 Shrimp Labeling Data . . . . 36
2.3.2 Honey Labeling Data . . . . 39
3 Shrimp Consignee and Importer Inspection Models 41 3.1 Introduction . . . . 41
3.2 Shrimp Data . . . . 43
3.2.1 Consignee Product Data . . . . 44
3.3 Predictive Features . . . .
3.3.1 Consignee Inspection Model Features . . . .
3.3.2 Importer Inspection Model Features . . . . 3.4 Product Diversity Feature . . . . 3.4.1 Consignee Product Diversity . . . .
3.4.2 Importer Product Diversity . . . . 3.5 Consignees and Importers Inspection Model Framework
3.6 Model Estimation and Discussion . . . .
3.6.1 Consignee Inspection Model Estimation . . . . .
3.6.2 Importer Inspection Model Estimation . . . . .
3.7 Model Validation . . . . 3.7.1 Consignees Inspection Model Validation . . . .
3.7.2 Importer Inspection Model Validation . . . .
3.8 Sum m ary . . . .
4 Shrimp Manufacturer Sampling Model
4.1 Shrimp Adulteration . . . . 4.2 Shrimp Manufacturer Data . . . .
4.3 Predictive Features . . . .
4.4 Shrimp Manufacturers Model Framework . . . . 4.5 Model Estimation and Discussion . . . .
4.6 Model Validation . . . .
4.7 Optimization Formulation . . . . 4.8 Evaluating Policy Performance with Historical Data . . 4.8.1 Model for refusal rate conditioned on risk score 4.8.2 Optimization Results . . . . 4.9 Sum m ary . . . .
5 Honey Shippers Risk Model
5.1 Introduction and Background . . . .
5.2 H oney D ata . . . . 8 46 46 49 51 52 54 55 58 59 62 64 64 70 74 77 77 78 82 . . . 84 . . . 88 . . . 92 . . . 96 . . . 97 . . . 98 . . . 98 . . . 99 101 101 103
5.3 Explanatory Analysis . . . . 105
5.3.1 Data Inconsistencies . . . . 110
5.4 Shippers Risk Model Framework . . . . 113
5.5 Model Estimation and Discussion . . . . 118
5.6 Model Validation . . . . 119
5.6.1 Out of Sample Analysis . . . . 119
5.6.2 Model Robustness Check . . . . 122
5.7 Sum m ary . . . . 126
6 Conclusion 127 6.1 Summary of the Results . . . . 127
6.2 Extensions and Future Directions . . . . 128
A Details of MCMC Sampler 129
B Refusal Codes Tables 131
List of Figures
1-1 Increase in imports of FDA-regulated goods in the U.S. between 2006 and 2016. https://www.fda.gov/ForIndustry/ImportProgram/ . . .
1-2 Shipping supply chain diagram. . . . .
2-1 Shipping supply chain and data sources used in the analysis. . . . . . 2-2 Fraction of FDA shrimp shipment records entering the U.S. by air, road or sea between 2007 and 2015. . . . .
21 24
30
33
2-3 Histogram of air entries in the FDA shrimp data between 2007 and 2015. 33 2-4 Histogram of road entries in the FDA shrimp data between 2007 and
2015.. ... ... ... ... ....
2-5 Histogram of sea entries in the FDA shrimp data between 2007 and
2015... ... . ... ... ....
2-6 A honey bill of lading from Import Genius. . . . . 3-1 U.S. consignees with shrimp entries between 2007 and 2015. The radius
of the orange bubbles (created using a Gaussian kernel) is proportional to the number of consignees within that area. . . . .
3-2 Pie chart of the most common products identified in the 1.4 million
shipments of shrimp consignees, using Import Genius data between
2007 and 2015. ... ...
3-3 Number of entries to the U.S. in each product category between 2006 and 2015, from shrimp importers. . . . .
34 34 36 43 45 46
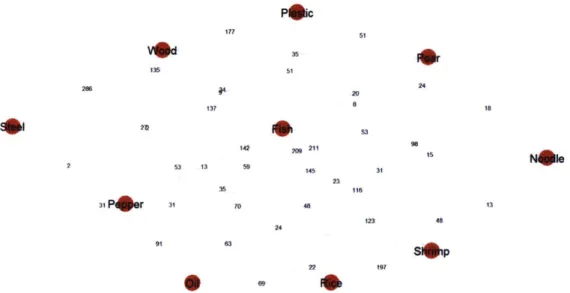
3-4 Subgraph of 10 products of shrimp consignees found in the FDA database.
A node indicates a product and an edge weight indicates the number
of unique consignees that received both products at the end points, between 2007 and 2015. . . . . 52 3-5 Illustration of steps to compute the product diversity feature among
consignees. . . . . 54
3-6 Subgraph of 10 products of shrimp importers found in the FDA database. A node indicates a product and a edge weight indicates the number
of unique importers that received both products at the end points, between 2007 and 2015. . . . . 55 3-7 Graphical model of the Bayesian model for predicting inspections and
inspection outcomes among shrimp consignees and importers. .... 58 3-8 Significant features for predicting inspections in the shrimp consignee
inspection models. The 90% posterior credibility interval is given be-tween parentheses. A positive sign (orange cell) means that the feature is positively correlated with risk, a negative sign (blue cell) means that it's negatively correlated with risk. No sign means that the feature is not significant. . . . . 59 3-9 Significant features for predicting violative inspections in the shrimp
consignee inspection models. The 90% posterior credibility interval is given between parentheses. A positive sign (orange cell) means that the feature is positively correlated with risk, a negative sign (blue cell) means that it's negatively correlated with risk. No sign means that the feature is not significant. . . . . 60 3-10 Significant features for predicting inspections in the shrimp importers
inspection models. The 90% posterior credibility interval is given be-tween parentheses. A positive sign (orange cell) means that the feature is positively correlated with risk, a negative sign (blue cell) means that it's negatively correlated with risk. No sign means that the feature is not significant. . . . . 62
3-11 Significant features for predicting violative inspections in the shrimp
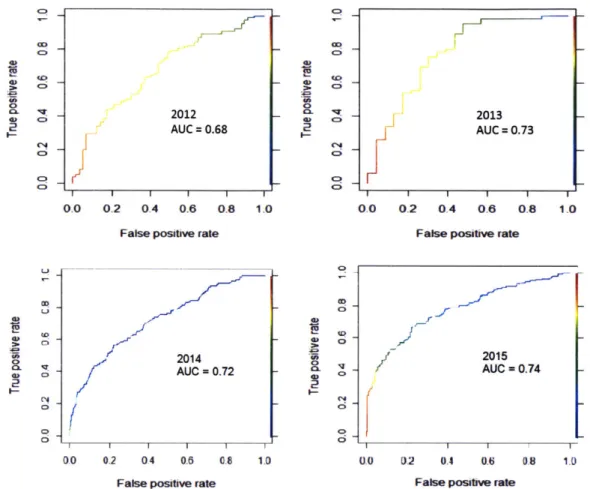
importers inspection models. The 90% posterior credibility interval is given between parentheses. A positive sign (orange cell) means that the feature is positively correlated with risk, a negative sign (blue cell) means that it's negatively correlated with risk. No sign means that the feature is not significant. . . . . 63 3-12 ROC for the shrimp consignees inspection model, predicting
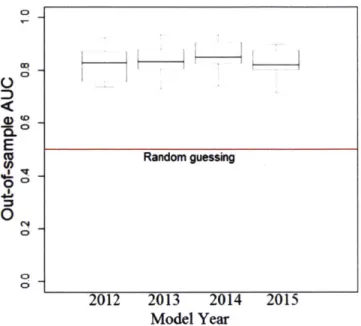
inspec-tions between 2012 and 2015. The AUC is shown in each plot. . . . . 65 3-13 Boxplot for shrimp consignees inspection model AUC across 10 random
data splits for predicting inspections. . . . . 65
3-14 ROC for the shrimp consignees inspection model, predicting inspection outcomes between 2012 and 2015. The AUC is shown in each plot. . . 66 3-15 Boxplot for shrimp consignees inspection model AUC across 10 random
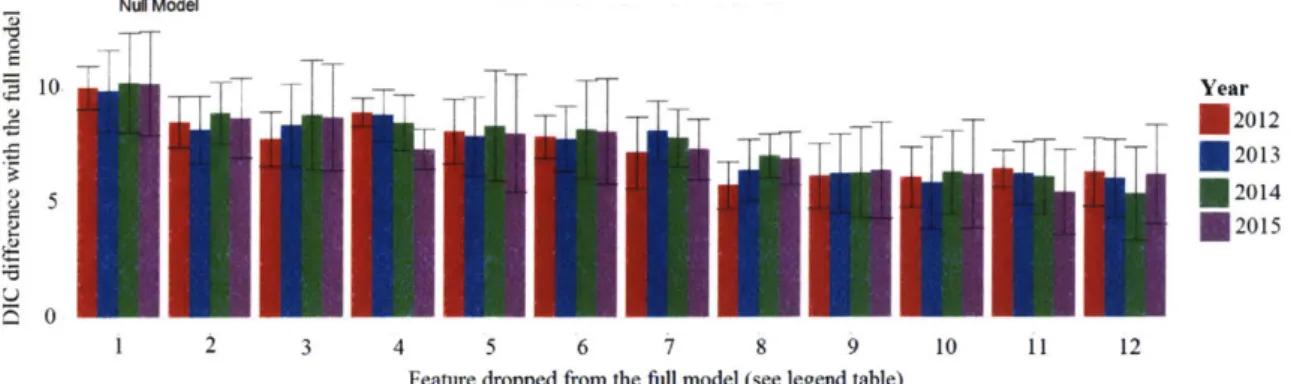
data splits for predicting inspection outcomes. . . . . 66 3-16 Inspection DIC of the full model (all features), compared to the null
model (no features), and model with different features removed (x axis). Error bars represent the standard error for 10 model trials. . . 68
3-17 Inspection outcome DIC of the full model (all features), compared to
the null model (no features), and model with different features removed (x axis). Error bars represent the standard error for 10 model trials. . 69
3-18 ROC for the shrimp importers inspection model, predicting
inspec-tions, 2012-2015. The AUC is shown in each plot. . . . . 70 3-19 Boxplot for shrimp importers inspection model AUC across 10 random
data splits for predicting inspections. . . . . 71
3-20 ROC for the shrimp importers inspection model, predicting inspection
outcomes, 2012-2015. The AUC is shown in each plot . . . . 71 3-21 Boxplot for shrimp importers inspection model AUC across 10 random
3-22 Inspection DIC of the full model (all features), compared to the null
model (no features), and model with different features removed (x axis). Error bars represent the standard error for 10 model trials. . . 72 3-23 Inspection outcome DIC of the full model (all features), compared to
the null model (no features), and model with different features removed (x axis). Error bars represent the standard error for 10 model trials. . 73
4-1 Top ten shrimp exporting countries (in terms of number of shipments) between 2007 and 2015. . . . . 79
4-2 Number and fraction of sampled shipments and refused shipments per country, for the top ten shrimp exporting countries (in terms of number of shipments) between 2007 and 2015 . . . . 79
4-3 FDA refusals between 2007 and 2015 due per refusal category in South Am erica and Asia. . . . . 80
4-4 Number of refused shrimp shipments per refusal category and per year, between 2007 and 2015. . . . . 81
4-5 Fraction of refusal categories out of refused shrimp shipments per year, between 2007 and 2015. . . . . 81
4-6 Illustration of dispersion of total shipment weight per consignee. Vari-ables w represent the weight fraction received by each consignee from the m anufacturer. . . . . 84
4-7 Graphical model of the Bayesian model for predicting sampling and adulteration among shrimp manufacturers. . . . . 87
4-8 Significant features for predicting sampling in the shrimp manufacturer sampling model. A positive sign (orange cell) means that the feature is positively correlated with risk, a negative sign (blue cell) means that it's negatively correlated with risk. No sign means that the feature is not significant. . . . . 88
4-9 Significant features for intentional adulteration in the shrimp manu-facturer sampling model. A positive sign (orange cell) means that the feature is positively correlated with risk, a negative sign (blue cell) means that it's negatively correlated with risk. No sign means that the feature is not significant. . . . . 89
4-10 Significant features for unintentional adulteration in the shrimp man-ufacturer sampling model. A positive sign (orange cell) means that the feature is positively correlated with risk, a negative sign (blue cell) means that it's negatively correlated with risk. No sign means that the feature is not significant. . . . . 91
4-11 Sampling DIC of the full model (all features), compared to the null model (no features), and model with different features removed (x axis). Error bars represent the standard error for 10 random data partitions. . . . . 93
4-12 Intentional Refusal DIC of the full model (all features), compared to the null model (no features), and model with different features removed (x axis). Error bars represent the standard error for 10 random data partitions. ... ... ... .. .. . .. ... 94
4-13 Unintentional Refusal DIC of the full model (all features), compared to the null model (no features), and model with different features removed (x axis). Error bars represent the standard error for 10 random data partitions. . . . . 95
5-1 Number of honey refusals per refusal code description between 2006
and 2015. ... ... . ... ... ... ... 103
5-2 Pie chart of the number of honey shipments per country (total number
of shipments is 62,000) between 2006 and 2015, using Import Genius data. . ... ... ... .. ... .... .... . 104
5-3 Pie chart of the total imported weight of honey per country (total
weight is 4.7 billion kilograms) between 2006 and 2015, using Import G enius data. . . . . 105
5-4 Illustration of the overall graph, high risk graph and low risk graph. . 106
5-5 High risk graph of honey shipments . . . . 106
5-6 Comparison of the distributions of the number of consignees per high
risk shipper and unknown shippers. . . . . 107 5-7 Comparison of the distributions of the average weight per high risk
shipper and unknown shippers. . . . . 108 5-8 Fraction of duplicate shipments among the 50 shippers with highest
number of shipments (Import Genius 2006-2015). . . . .111 5-9 Graph of shippers used in duplicate shipments. An edge indicates
that the two shippers names have been used in at least two duplicate shipments. . . . .111
5-10 Graph of consignees used in duplicate shipments. An edge indicates
that the two consignees names have been used for consignees in at least two identical shipments. . . . 113
5-11 Graphical model of the Bayesian model for predicting adulteration
among honey shippers. . . . . 117 5-12 Model parameters' statistics for sampling in the honey shipper risk
m odel. . . . . 118 5-13 Model parameters' statistics for adulteration in the honey shipper risk
model. A positive sign (orange cell) means that the feature is posi-tively correlated with risk, a negative sign (blue cell) means that it's negatively correlated with risk. No sign means that the feature is not significant. . . . . 119
5-14 ROC for honey shippers risk model using one random data split. The Area Under the Curve is 0.84. . . . . 120
5-15 Boxplot for honey shippers risk model AUC across 10 random data splits. 120 16
5-16 DIC shift from the full model (including all features) when we remove
one feature at a time, for predicting honey adulteration. The error bars represent the standard error over 10 random data partitions. The null model does not include any model feature . . . . 121
5-17 Boxplot of the average number of shipments and average number of
consignees for honey shippers on FDA refusals, before and after being put on a refusal . . . . 123 5-18 Boxplot of the average weight and average duplicate fraction for honey
shippers on FDA refusals, before and after being put on a refusal. . . 123 5-19 Density of in-sample predicted risk scores of honey shippers (red line)
showing three peaks. The blue line represents the estimated distribu-tion using a Gaussian mixture model. . . . . 124
C-1 Model parameters' for predicting sampling in the Chinese
manufactur-ers risk model. A positive sign (orange cell) means that the feature is positively correlated with risk, a negative sign (blue cell) means that it's negatively correlated with risk. No sign means that the feature is not significant. . . . . 138 C-2 Model parameters' for predicting intentional adulteration in the
Chi-nese manufacturers risk model. A positive sign (orange cell) means that the feature is positively correlated with risk, a negative sign (blue cell) means that it's negatively correlated with risk. No sign means that the feature is not significant. . . . . 139 C-3 Model parameters' for predicting unintentional adulteration in the
Chi-nese manufacturers risk model. A positive sign (orange cell) means that the feature is positively correlated with risk, a negative sign (blue cell) means that it's negatively correlated with risk. No sign means that the feature is not significant. . . . . 139
List of Tables
3.1 Posterior median and 90% credibility interval of the correlation coeffi-cient p for each year in the consignees inspection model. . . . . 61 3.2 Posterior median and 90% credibility interval of the correlation
coeffi-cient p for each year in the importers inspection model. . . . . 64
3.3 Legend table for Figure 3-16 with feature names in the x-axis. . . . . 68
3.4 Legend table for Figure 3-17 with feature names in the x-axis. .... 69 3.5 Legend table for Figure 3-22 with feature names in the x-axis. .... 73 3.6 Legend table for Figure 3-23 with feature names in the x-axis. .... 74
4.1 Posterior median and 90% credibility interval of the correlation coeffi-cient p for each year. . . . . 90
4.2 Posterior median and 90% credibility interval of the correlation coeffi-cient p for each year. . . . . 91
4.3 Out of sample Spearman rank correlation for predicting sampling and refusals. . . . . 92
4.4 Legend table for Figure 4-11 with feature names in the x-axis. .... 94 4.5 Legend table for Figure 4-12 with feature names in the x-axis. .... 95
4.6 Legend table for Figure 4-13 with feature names in the x-axis. .... 96
4.7 Number of violative shipments caught under the optimial policy com-pared to the FDA policy, using different definitions of the risk score. . 99
5.1 Five most common refusal categories of honey, based on FDA public refusals between 2006 and 2015. . . . . 104
5.2 Statistics of the number of consignees per shipper (shipper's degree) in
the overall graph, the high-risk graph and the low-risk graph . . . . . 107 5.3 Statistics of the average weight (in Kg) per shipper in the overall graph,
the high-risk graph and the low-risk graph. . . . . 108
5.4 Statistical tests p-values to compares features' distributions of the 30 shippers with shipments before and after FDA refusals, showing that we fail to reject the null hypothesis that the means are equal. . . . . 122
5.5 Statistics of shippers' features in the three K-means clusters. . . . . . 125
5.6 Statistics of shippers' fractions of shipment from each country of origin
that is significant in the model estimation, in the three K-means clusters. 125
B. 1 Violation codes and descriptions in honey refusals between 2006 and
2015. www.fda.gov/ForIndustry/ImportProgram/ImportRefusals/
ucm144864.htm . . . . 134
B.2 Translation of FDA violation codes in shrimp refusals refusals be-tween 2007 and 2015. www.fda.gov/ForIndustry/ImportProgram/
ImportRefusals/ucm144864.htm . . . . 135
Chapter 1
Introduction
1.1
Background and Motivation
It is estimated that 15% of all food products consumed in the U.S. are imported [3]. In some product categories, such as seafood, up to 90% is imported [4]. In fact, the number of imported entries in the U.S. has steadily increased every year since 2006 and reached close to 40 million unique shipments in 2016 (see Figure 1-1 [5]).
Total Unes* of Products Imported into the U.S. per Fiscal Year
*A line is a distinct product within a shipment. A single shipment may Include multiple lines.
Figure 1-1: Increase in imports of FDA-regulated goods in the U.S. between 2006 and 2016. https: //www.fda.gov/ForIndustry/ImportProgram/ 40,000,000 35,000,000 30,000,000 25,000,000 20,000,000 15,000,000 10,000,000 5,000,000 0
The globalization of food supply chains exposes them to a wide range of food safety risks stemming from different types of food adulteration
[6].
It is estimated that 48 million people get sick and 3,000 die each year from food-borne diseases globally[6]. Risks can be attributed to different types of adulteration, specifically
uninten-tional and intenuninten-tional adulteration. Unintenuninten-tional adulteration can be defined as any food adulteration resulting from lack of sufficient measures and processes to maintain the safety of food products. Salmonella contamination and the existence of filth in the food are often caused by negligence or lack of proper equipment facilities and processes, and environmental conditions. It is not necessarily a willful act on the part of the adulterer. Intentional adulteration involves a deliberate act of adding or substituting a substance or mislabeling a product. Intentional adulteration is often economically motivated, in which case it's called economically motivated adulter-ation (EMA). Intentional adulteradulter-ation includes the use of illegal animal drugs, food additives, color additives, and fraudulent misbranding.
The risks of food adulteration have become so severe that in response to a wave of incidents of food adulteration, the U.S. government passed the Food Safety Mod-ernization Act (FSMA) [7] in 2011 to strengthen the food safety system. The FSMA allows the Food and Drug Administration (FDA) to regulate the way food is grown, harvested, processed and transported to and within the U.S. Under the FSMA, the fo-cus of the FDA shifted from reactive mitigation strategies to preventative food safety measures. Food facilities are now required to implement a written Hazard Analysis and Risk-based Preventive Controls (HARPC) plan that evaluates the hazards that could affect food safety, specifies the preventive steps as well as the actions the facility will take to correct problems that arise [8].
The FSMA also establishes far more stringent standards with respect to shipment sampling and site inspection frequencies based on risk. For example, all high-risk domestic facilities must be inspected within five years of enactment and no less than every three years after [8].
There has been over 30 million food shipments each year to the U.S. which are subject to FDA regulation since 2014, but the FDA only has resources to sample less
than 1% of them [9]. Since prevention is achieved through sampling shipments at the port of entry and site inspections of local and foreign companies by the FDA, the high imbalance between the rapid growth of regulated food imports and the marginal increase in inspection and port sampling capabilities make it essential to develop systematic approaches to identify risky products and allocate the scarce shipment sampling and site inspection resources in the most effective way.
The FDA also implemented a new screening system for imports called
PRE-DICT (Predictive Risk-based Evaluation for Dynamic Import Compliance Targeting) [10], which assists entry reviewers in targeting higher-risk shipments for
examina-tion. PREDICT scores each entry line on the basis of risk factors and surveillance requirements using results of field exams, facility inspections and sample analyses of previous entries [10]. Risk includes factors, such as the inherent health risk of the product, compliance risk associated with firms, facility inspection results, and broker history, among others, and is then compared to all other entry lines within a specified commodity over the past 30 days
[11].
Particular emphasis was given to the development of science-based approaches to prepare and protect food supply chains at specific vulnerable points. With the massive amount of global shipment data available, there is great potential to develop such approaches using data-driven statistical methods. In fact, several attempts have been made to understand and reduce risk in the global food network [12], but none have mapped the supply chain structure to risk.
1.2
Thesis Outline
The goal of this thesis is to develop systematic and data-driven approaches to under-stand how the structure and dynamics of shipping supply chains are correlated with food safety related risks, and to predict risky companies involved at different stages of the shipping supply chain. The approach is based on the hypothesis that firms involved in adulteration, particularly EMA, have similar supply chain dynamics that are distinguishable from firms that are not.
We choose to study two of the most heavily imported and adulterated commodi-ties; honey and shrimp. Specifically, we develop predictive risk models of of food adulteration based on supply chain features for honey shippers, shrimp manufactur-ers, and shrimp consignees and importers.
1.2.1
Data
We describe here the shipping supply chain of shrimp and honey as well as the main data sources used in our analysis.
After the product is produced in a farm, it is processed by a manufacturer. The product is then handed by the manufacturer to the shipper at the place of receipt. After that, the product is carried to the foreign port, ready to be shipped to the U.S. The product is typically transported in containers on board of a vessel. It enters the
U.S. through the U.S. port (or port of arrival), and is then distributed to the consignee.
The shipping supply chain for sea shipments can be summarized in Figure 1-2.
... Ship
Fa ---- Manua m -- Plc Foreign us
Addes O Port port
Voyage N
...-1
ConsigneeAddress
Figure 1-2: Shipping supply chain diagram.
For the analysis of worldwide shippers of honey, we collect 62,000 bills of lading from a public database called Import Genius (https://www.importgenius.com/),
24
between 2006 and 2015. In order to classify honey shippers safety levels, we use
FDA import alerts and refusals [13, 14] for the same period.
For the analysis of U.S. shrimp consignees, importers and manufacturers, we ob-tain over a million shipment records between 2007 and 2015 from the FDA, and focus on the top seven shrimp exporting Asian countries (in terms of number of shipments), which amount to about 62% of the total worldwide shipments into the U.S. The rea-son we restrict the analysis to Asian countries is discussed in Chapter 3. We use FDA site inspection data [15] to classify consignees' and importers' safety levels, and we use FDA shipment records with sampling and refusal data to classify manufacturers' safety levels.
1.2.2
Supply Chain Features
From these data, we construct a variety of supply chain features that describe the geography and the complexity of the supply chain, and the shipping patterns of the different companies involved.
Geographical features include the traveled distance before the product is shipped to the U.S., an important measure for perishable products like shrimp. Another important geographical feature we consider in our analysis is called "transnational", which describes instances in which two ports or locations in the shipping supply chain
are located in different countries. This feature is important because crossing a border to ship a product could be an attempt to disguise the origin of the product if the country of origin is flagged by the FDA as hazardous.
Other features are related to the supply chain network. We hypothesize that a complex supply chain structure can be an attempt to hide suspicious behavior, and can result in bad product quality. Therefore, we compute the number of U.S. consignees each shipper or manufacturer works with, and extract the variation of this number across years, the variation of the number of shipments across years, as well as the shipped weight to the consignees and its dispersion among them. We consider similar features for consignees and importers where we compute the number
In the consignees and importers inspection models, we also account for the diver-sity of their product portfolios. We obtain data on all products received by shrimp consignees and importers, both from Import Genius and internal FDA data, and we construct a distance metric between those products. We aim to show whether ship-ping unrelated commodities can be used as a proxy for high risk behavior among consignees and importers.
1.2.3
Model
In our risk models, we assign a risk score between zero and one to each shipper, manufacturer, consignee or importer. We model this risk score as a probit regression of the companies' supply chain features. However, since there is sampling bias (some companies have never been sampled or inspected in the past), we explicitly model the
FDA sampling and inspection policies using a Bayesian framework. Shipments are
sampled by the FDA according to a sampling probability, which may be a function of the companies' features and country of origin. For consignees and importers, the framework is similar. However, instead of predicting the fraction of sampled shipments and the fraction of refused shipments, we predict a binary outcome: is the company inspected at least once? And in this scenario, is the inspection outcome violative?
In order to correct for the sampling bias due to the FDA sampling and inspection policies of shrimp, we use the Heckman Selection Model [16] to solve the model in two steps. First, we predict the likelihood of sampling or inspection, and second, we predict the likelihood of a violative response among sampled or inspected companies. Details of this method are provided in the model estimation sections of Chapters 2,
3 and 4.
We use a Metropolis Hastings within Gibbs MCMC algorithm [17] to estimate model parameters and assess the companies' risk scores. A higher risk score leads to a higher number of refused shipments for shippers and manufacturers, and a higher chance of violative inspections for consignees and importers. The Bayesian inference method provides us with significance of the different features using the posterior
credibility interval of estimated model parameters.
1.2.4
Estimation Results
Estimating the models using the honey and shrimp data yields several important insights. We find that companies with a more dispersed and complex supply chain are more likely to be high risk. Yearly changes in the supply chain structure also seems to correlate with high risk behavior. In addition, we find that high product diversity among consignees and importers correlates with more risk of failing FDA site inspections, conducted to determine companies' compliance with regulations. This finding shows that shipping unrelated commodities can indicate a higher risk of food adulteration.
Since our goal is to predict risk in new shipments, it is important to perform out of sample validation of the predicted risk scores. We use different validation methods and metrics such as Receiver Operating Characteristics (ROC) curves for models with binary outcomes, out-of-sample Spearman rank correlation tests, and likelihood tests using the Deviance Information Criterion (DIC) [18]. We find that all models exhibit good predictive power.
In summary, we are able to construct quantitative measures of which structural features and characteristics of shipping food supply chains are correlated with in-creased levels of safety risks in imported food. Our predictive models allow us to map shipment activity to risk at different points of the supply chain. The same framework can be applied to other commodities, in an attempt to catch adulteration and prevent food safety hazards in the U.S.
This thesis is organized as follows:
e Chapter 2: Data
e Chapter 3: Shrimp Consignees and Importers Inspection Models e Chapter 4: Shrimp Manufacturers Risk Model
" Chapter 5: Honey Shippers Risk Model
" Chapter 6: Conclusion
Chapter 2
Data
2.1
Introduction
In this chapter, we present the general supply chain data that we use throughout this thesis for the shrimp consignees and importers models, the shrimp manufacturers model, and for the honey shippers model. We describe the supply chain data we use, including public sources as well as private data obtained from the FDA. We also describe the data that we use to label companies as high or low risk.
2.2
Supply Chain Data
In this section, we describe supply chain data for honey and shrimp. The supply chain data starts at the farm where the product is produced. The product is then processed by the manufacturer, and handed to the shipper that carries it from the place of receipt to the foreign port. The shipper then ships the product to the U.S. Finally, the product is delivered to the U.S. consignee.
Figure 2-1 summarizes the shipping supply chain and the data sources used in our analysis. These data sources are detailed in the following subsections.
FDA data
Import
Genius
FDA sampiingl
Farm -- dManufacturer -l op ( --. Consignee
Resmipt
Container N
Voyage N
Figure 2-1: Shipping supply chain and data sources used in the analysis.
2.2.1 Import Genius
We use a public data source called Import Genius (https: //www.importgenius.com/) to obtain bills of lading for shrimp and honey shipments. A bill of lading is a legal document between the shipper and the carrier detailing the type, quantity and des-tination of the goods being carried. The bill of lading also serves as a receipt of the shipment.
Import Genius contains over 100 million bills of lading for sea shipments to dif-ferent countries including the U.S. Each bill of lading provides the following detailed supply chain information [19]:
" Product description: The description of the product. It can include
specifica-tions about the product and information about the packaging.
" Consignee: The firm that takes final delivery of the merchandise. In our data,
the consignee is located in the U.S.
" Consignee address: The address of the consignee in the U.S.
" Shipper: The company that ships the product. It could also be the manufacturer
or a logistic company.
" Shipper address: The address of the shipper. 30
" Arrival date: The day, month and year of arrival of the shipment to the U.S.
* Gross weight (kg): The weight in kilograms of the shipment.
" Foreign port: The last overseas port in which the shipment is laden on board a
vessel for transportation to the U.S.
" U.S. port: The U.S. port in which the shipment is discharged.
" Country of origin: The country in which an article being shipped is grown, produced, or manufactured.
" Place of receipt: The location where the shipper takes the shipment from the manufacturer.
" Bill of lading: A unique ID that identifies the bill of lading.
" Container number: The ID number of the container in which the product is being shipped.
" Voyage number: A number which is assigned to a round-trip sea voyage intended to transport trade goods along an existing trade route. These numbers are assigned by the ship owner or agent and are unique to both the ship and the trip.
" Carrier code: Four digits code referring to the party of the contract of carriage who has undertaken to perform the carriage.
2.2.2
Shrimp Supply Chain Data
For shrimp consignees, importers and manufacturers, we processed over 251,000 shrimp bills of lading that entered the U.S. from all countries between 2007 and
2015. These bills of lading are obtained by querying the words "shrimp",
"van-namei" and "camaron" and their misspellings in the product description of the ship-ments. We then clean the data set by removing shipments that contain the follow-ing strfollow-ings: "shrimp cakes", "shrimp balls", "shrimp crackers", "noodles", "chips",
"shrimp salad", "stew", "cat food", "dog food", "peanut", "spring roll", "vegetable",
"shrimp bag", "beans", "eggs", "animal feed", "seasoning", "plastic bags". These are
the main non-shrimp products we find in the data set.
For a more thorough cleaning, we go through 50,000 shipments where we manually mark shipments as relevant or not. This process was made faster by automatically marking shipments containing "black tiger", "headless shrimp", "white shrimp" or "vannamei shrimp" in the product description as relevant. We then split the data into a training set and a testing set of equal sizes. We use a Bag of Words approach to build a Classification and Regression Tree (CART) model that predicts if a shipment is relevant or not. The model has a 92% out-of-sample accuracy on the 50,000 shipments that were manually marked. We then run the model on the entire data set to identify relevant shipments based on the product description text field. At the end of this process, we obtain 218,000 bills of lading from Import Genius.
We also clean companies' names in the Import Genius database using an open source tool called OpenRefine [20]. OpenRefine is a software for cleaning and trans-forming messy data, it allows to cluster company names based on their spellings or pronunciations.
In addition, we obtain shrimp shipments data between 2007 and 2015 from the
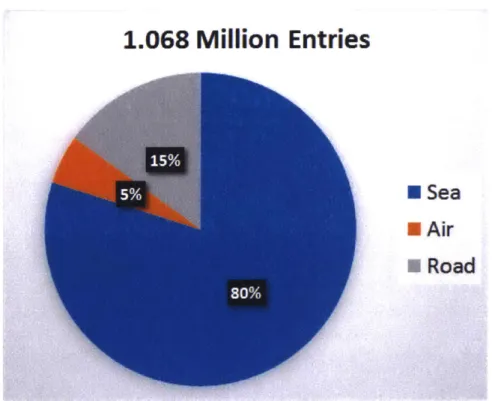
FDA. The FDA data for shrimp has over a million shipments arriving to the U.S.
through air, road or sea. We show the distribution of the three entry routes in Figure 2-2.
1.068 Million Entries
*
Sea
"Air
A
Road
Figure 2-2: Fraction of FDA shrimp shipment records entering the U.S. by air, road or sea between 2007 and 2015.
Our analysis shows that manufacturers use almost exclusively one type entry route; either air, road or sea, as seen in Figures 2-3, 2-4 and 2-5.
Histogram of Fractions of Air Entries
3500 3000 2500 2 2000 E , 1500 0 1000 E :3 z 500 0 Ln - Ln aN o m o q o o w o r- LA 0 0 0 0 0 0 0 0 wO LA m~ LA 6q 6 Oo 0 0
I
0Fraction of air entries
Histogram of Fractions of Road Entries 3500 e 3000 2500 2000 E 1500 -0 1000 EU Z500 0 --- - - - - - - - - -Q) Q1. o ZI t'@ 'oj CZ)i 4- r Z). Q1 ' lb 4
Fraction of road entries
Figure 2-4: Histogram of road entries in the FDA shrimp data between 2007 and
2015.
Histogram of fractions of sea entries
2500 3 2000 = 1500 C E 0 1000 E 500 z 0 - - - - - -- - - - - " LA -4 LA r4 LA m Ln qt LA LA LA wD LA r- LA co LA cn LA r-4 0 0 0 0 0 0 0 0 0 0
Fraction of sea entries
Figure 2-5: Histogram of sea entries in the FDA shrimp data between 2007 and 2015.
In order to leverage Import Genius data (which only has sea shipments), and given the high fraction of shrimp sea entries to the U.S., we restrict our analysis to sea shipments, which account for 852,000 bills of lading from all countries.
It is important to note that the FDA data has additional entries (such as the manufacturer name and address) that are not available in Import Genius, but at the same time misses some entries (such as the place of receipt and the foreign port) that are found in Import Genius. Therefore, we had to match shipments between the two data sets.
We consider two shipments from the two data sets to be identical if one of the following criteria is fulfilled:
" Same container number and date of arrival (we allow a 5 days window)
" Same bill of lading code and date of arrival (we allow a 5 days window)
" Same voyage number, carrier code and date of arrival (we allow a 5 days window)
The disproportionate number of shipment records between the two databases is due to the fact that Import Genius contains many master bills of lading which group shipments of different containers of shrimp, while the FDA data breaks them down to house bills of lading of single shrimp containers.
After matching FDA shipments to Import Genius bills of lading, we query ship-ment dates and container numbers of unmatched FDA shipship-ments in Import Genius to expand the Import Genius database. We were able to identify many bills of lad-ings that did not include the words 'shrimp', 'vannamei' or 'camaron' in the product description, but a more generic word such as 'food', 'seafood' or 'foodstuff'. At the end of this process, we are able to match 91% of FDA shipments to Import Ge-nius. The final matched data set has approximately 775,000 shipments, 1,916 unique manufacturers, 2,549 unique consignees, and 1,755 unique importers.
2.2.3
Honey Supply Chain Data
For the analysis of worldwide shippers of honey, we collect bills of lading from Import Genius between 2006 and 2015.
The honey database is obtained by querying the word "honey" in the product description field of the bills of lading in Import Genius. We then remove irrelevant data from the Import Genius database (such as bills of lading where the word "honey" is used for "honey dew", or to describe a color or a flavor of a different food product). We also correct shippers and consignees' names mispelling by clustering similar names using OpenRefine [20]. After processing the data, we are left with approximately
Figure 2-6 is a screenshot of a honey bill of lading from Import Genius, showing the most important supply chain-related fields used in the analysis:
CO.TACT.O
CONSMNEE SAAS.Ex M.LLC
NOSY PAATY W4EXLLC M.REVEREDMV. ILSEJESEY. u2n U
P.NW.:1A$AR NCO- LID. UU
LLA 1 hHBM23 "
1
11f17U3 THAI POLYLOA MONEa 0 M. C&I (3WKOSPER O*MIC OhI NO 9 001405G M03CI
TOTAL I&W: 10,501AKG&
Figure 2-6: A honey bill of lading from Import Genius.
2.3
Labeling Data
2.3.1
Shrimp Labeling Data
To label shrimp manufacturers as high risk, we use information about sampled and refused shipments available through the FDA shipment data. We identify sampled shipments using the 'Intermediate Activity Number'. If this variable has an entry in the data, it means that the shipment was sampled. We identify refused shipments using the 'Final Admissibility Activity Num'. Refused shipments are defined as in-stances where the "Final Admissibility Activity Number" is either "154: Refused Inform FDA Before Export" or "155: Refused Inform FDA After Export".
In addition to identifying refused shipments, we need to determine the reason for the refusals to distinguish intentional and unintentional adulteration. Therefore, we need to match FDA refused shipments with the FDA public refusal records, available in the following page: http: //www.accessdata.fda.gov/scripts/importrefusals/.
The FDA public refusal data set is a list of refused shipments with the manufac-turer name, the manufacmanufac-turer country, the product code, the date of the refusal, and
36
10MDEnn.
,w.'. VW
CAR Sm O-SNDCNNECTIONSLoGdSCSLTD COIi.ERCOit
23Wm 3 aU.' ST C= 0
CA .m1 NUISVSinhU H MRg1TROLLF WLUTWTU74HM
CONTACT NO: 3100MiM
uWIPMP.IN LMELA 0CIU713 LOTCM4MO I
NEWYL UA
winSEL VUUARD H OLFAA OE
-SOR NEW vow N YO
FONmOiPONT LAW CHAIAN TARE-21 KG
C0UvFi TANET. = DUCTOF1HA
PLACE OFCEIT LARASANG Tp#4...fAU) BiL
EL O L1M SIOUTH15U0I SpaOTHn106
ARWI CTE 21)154&M14
the violation code. The translation of the different violation codes can be found in the link above. The descriptions for the most common refusals in shrimp are summarized
in Appendix B.
We will focus on the two types of adulteration defined previously (intentional and unintentional) and run a separate model on each type.
To label consignees and importers as high risk, we use site inspection data. In particular, we use two inspection data sources for FDA site inspections of consignees and importers:
o Public inspection database
[13]:
List of firm site inspections from October 2008 to February 2016. It has over 83,000 inspections performed by the Center for Food Safety and Applied Nutrition (CFSAN) on manufacturers, consignees and importers. The public inspection database specifies the date of the inspection, the name of the inspected company and its address, as well as the project area and the outcome of the inspection. The project area gives an indication of the violation being tested for, such as 'Food-borne Biological Hazards' or 'Pesti-cides and Chemical Contaminants'. This information is used to understand the reason for failing inspections. The outcome of each inspection is either NAI (No Action Indicated), VAI (Voluntary Action Indicated) or OAI (Official Action Indicated). We label a consignee as failing an inspection if it resulted in VAI orOAI. These data include inspections for shrimp as well as other products, but
do not indicate the product that was tested for.
* FDA inspection database: This database was provided by the FDA, and
con-tains 5,933 inspections for consignees and importers between October 2005 and July 2016. The FDA inspection database provides information about the inspec-tion date, the name of the company, as well as the product code and descripinspec-tion, which allows us to restrict the analysis to companies being inspected specifically for shrimp. The FDA inspection database also has a list of Product Assignment Codes (PAC) for each inspection, but only one inspection outcome (NAI, VAI, OAI or RTS: Referred To State) that represents the "worst" outcome for all
the listed PAC codes. Product Assignment Codes provide a detailed reason for the type of inspection. The first 2 digits of the PAC code can be linked to the inspection project area.
We proceed to match the two inspection databases. The goal of the matching pro-cess is to restrict the analysis to inspections conducted specifically for shrimp, as well as to determine the inspection outcome corresponding to each Product Assignment Code in the FDA inspection database (and not just the worst outcome).
Our matching process is as follows:
" Filter the FDA inspection database on product description containing the strings "shrimp" or "mixed seafood" or "fish".
" Take the subset of inspections in the public inspection database where the date
of the inspection, the name of the company and the city of the company match with an inspection in the filtered FDA database. It is worth mentioning that the number of unique PAC codes (the unique first two digits of PAC codes) in the
FDA inspection database is the same as the number of unique project areas in
the public inspection database, for inspections where
{date,
name, city} match." Add to the obtained data set any inspections that were unmatched from the FDA inspection database, with either a unique PAC code or multiple PAC codes
with the same first two digits (for which we can determine the project area and the outcome for this specific project area), or inspections with different PAC codes but NAI as the inspection outcome (since we know that if NAI is the "worst" outcome for all these PAC codes, then it is the outcome for each one of the matched project areas.)
At the end of the matching process, we obtain 497 inspection records for shrimp (inspections are separated by project areas.)
Of the 2,549 consignees in the FDA shrimp database, we find that 158 have been
inspected at least once, and 93 failed at least one inspection between 2007 and 2015.
Of the 1,755 importers in the FDA shrimp database, we find that 188 have been 38
inspected at least once, and 130 had at least one failed inspection between 2007 and
2015.
2.3.2
Honey Labeling Data
In order to label honey shippers as high risk, we use FDA alert and refusal records, defined below:
* Alerts: violations of FDA regulation resulting in the detention of the product. Those violations appear on a 'red list alert'.
- Red lists include firms, products or countries that are subject to Detention without Physical Examination (DWPE) [21]. The FDA may detain with-out physical examination certain products offered for entry from a specified country or area, a specific manufacturer, a shipper, or an entire product from all countries outside of the U.S. Some of the reasons a product or firm may be subject to DWPE are [22]:
* FDA has sampled a product and it tested violative for a pathogen
* FDA has sampled a product and it contains illegal colors or food
ad-ditives
* The product contains pesticides that are not allowed or do not meet tolerance levels
* The firm has not provided sufficient evidence to support adding them to the green list
* The product is an unapproved new drug
* The foreign firm had a violative inspection by FDA
- Green list alerts are lists of firms, products and/or countries that have met criteria for exemption from Detention without Physical Examination (DWPE) [22]. In order for the FDA to consider removing a product and/or firm from DWPE and add it to the green list, the FDA must have evidence that the conditions that gave rise to the apparent violation have been
resolved and that gives FDA confidence future entries will be in compliance with laws and regulations. Note that there are no FDA green list alerts for honey.
e Refusals: failure to meet FDA standards resulting in refusal of admission of the
product or part of the product.
These data are obtained from public records on the FDA website [13, 14]. They are used as a proxy to classify high risk shippers. Specifically, shippers that appear on at least one red alert or on at at least one refusal are classified as high risk.
40
Chapter 3
Shrimp Consignee and Importer
Inspection Models
3.1
Introduction
Many food poisoning incidents in the U.S. have been linked to imported seafood from Asian countries, such as Bangladesh and Malaysia [23]. Under the FSMA, consignees and importers are required to perform certain risk-based activities to verify that seafood imported into the U.S. has been produced in a manner that meets applicable U.S. safety standards. For this purpose, the FDA conducts site inspections of regulated facilities to assess compliance with regulations and protect public health. The only currently active program by the FDA is for shrimp [24].
For each regulatory action, the FDA provides a prioritized list of high potential risk seafood products based on the health hazard they may pose to consumers. The risk status is determined by a combination of the severity of the hazard, its likelihood of occurrence, and previous industry compliance data.
The products with a high priority for field examinations are [24]:
9 Refrigerated seafood products packed in oxygen limiting packaging or reduced
oxygen packaged (ROP). Seafood in such packages has increased likelihood for the growth and toxin formation by C. botulinum
" Raw (fresh and fresh frozen) molluscan shellfish from un-certified shippers. The
major concern is the harvest from unapproved waters, which may result in the presence of pathogens, marine toxins or heavy metals
* Ready-to-eat fish or fishery products using any of the following processes: cook-ing or pasteurization process (e.g., cooked shrimp, crabmeat, cooked lobster, cooked crayfish, pasteurized crabmeat, surimi-based analogs, etc.) hot or cold smoking process
The major concerns are inadequate cooking, pasteurization or smoking processes and insanitary processing conditions that allow the re-introduction of post-process pathogens, including Listeria monocytogenes and salmonella, that will not be destroyed by any subsequent cooking step prior to consumption by the consumer. The FDA recommends performing 90% of the number of planned inspections at importers that have been identified as problematic importers, and have an average of
100 or more entry line items per year. The remaining 10% of the number of planned
inspections should be made at importers that import less than 100 entry line items per year [24].
In this chapter, we use this site inspection data to assess the risk of failing at least one inspection for shrimp consignees and importers.
In addition to supply chain features, we introduce a new feature called "product diversity", based on a distance metric we build between different products. We hy-pothesize that consignees or importers that receive shipments of unrelated products are more likely to fail FDA site inspections. It is more suspicious to receive unrelated products, and this could also indicate a poor regulatory structure in place for the different products among non-specialized companies.
In this chapter, we present a framework for identifying risk at the consignee and importer levels, using global shrimp data. First, we present data on the consignees and importers in the FDA shrimp database for shipments, site inspections and re-ceived products. Then, we present the consignees' and importers' inspection model frameworks and the models estimation results. Finally, we validate the models using
42
ROC curves and the Deviance Information Criterion [18].
3.2
Shrimp Data
The consignee is the party in shipment documents to whose order a consignment will be delivered at the port of destination. The consignee is the buyer or the owner of the consignment. The importer is the entity responsible for ensuring the imported goods comply with local laws and regulations, filing a completed duty entry and associated documents and paying the assessed import duties and other taxes on those goods.
As mentioned in Chapter 2, we obtain companies' data from the shrimp shipments records obtained from the FDA, for all global sea shipments of shrimp entering the
U.S. between 2007 and 2015. These data contain 2,549 unique consignees, and 1,755
unique importers. Consignees and importers overlap in 64% of sea shipments in the
FDA shrimp data.
All shrimp consignees in the FDA data set are located in the U.S. We represent
in Figure 3-1 a map of these consignees.
Figure 3-1: U.S. consignees with shrimp entries between 2007 and 2015. The radius of the orange bubbles (created using a Gaussian kernel) is proportional to the number of consignees within that area.